
Sündmused
Tehisintelektirakenduste ja agentide koostamine
17. märts, 21 - 21. märts, 10
Liituge sarjaga, et luua muude arendajate ja ekspertidega skaleeritavad tehisintellektilahendused, mis põhinevad reaalajas kasutusjuhtumitel.
Registreeruge koheSeda brauserit enam ei toetata.
Uusimate funktsioonide, turbevärskenduste ja tehnilise toe kasutamiseks võtke kasutusele Microsoft Edge.
Applies to: Azure Logic Apps (Consumption + Standard)
After you run a logic app workflow, you can check that workflow's run status, trigger history, workflow run history, and performance.
This guide shows you how to perform the following tasks:
For real-time event monitoring and richer debugging, you can set up diagnostics logging for your logic app workflow by using Azure Monitor logs. This Azure service helps you monitor your cloud and on-premises environments so that you can more easily maintain their availability and performance. You can then find and view events, such as trigger events, run events, and action events. By storing this information in Azure Monitor logs, you can create log queries that help you find and analyze this information. You can also use this diagnostic data with other Azure services, such as Azure Storage and Azure Event Hubs. For more information, see Monitor logic apps by using Azure Monitor.
Each workflow run starts with a trigger, which either fires on a schedule or waits for an incoming request or event. The trigger history lists all the trigger attempts that your workflow made and information about the inputs and outputs for each trigger attempt.
In the Azure portal, open your Consumption logic app resource and workflow in the designer.
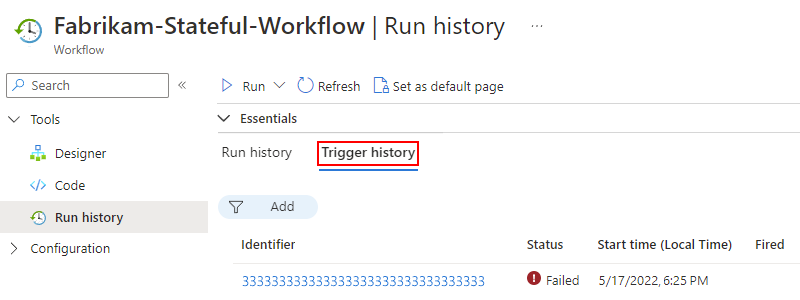
On your logic app menu, select Overview. On the Overview page, select Trigger history.
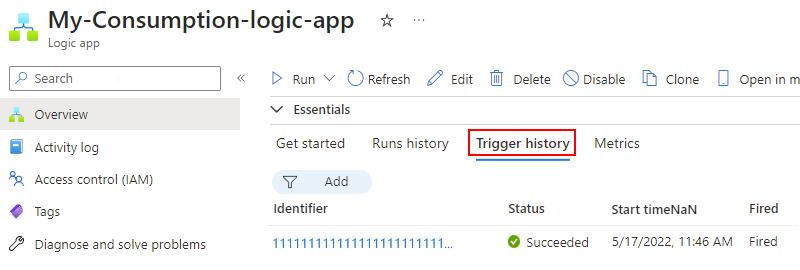
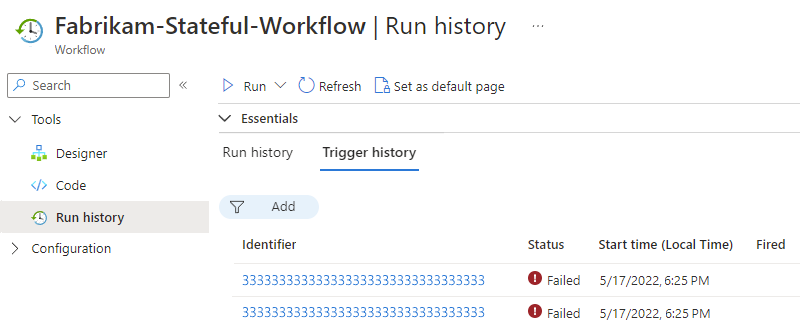
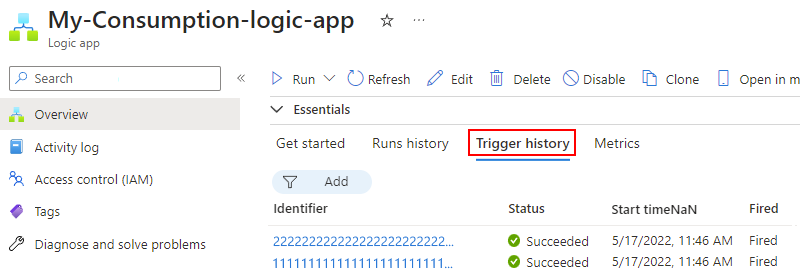
Under Trigger history, all trigger attempts appear. Each time the trigger successfully fires, Azure Logic Apps creates an individual workflow instance and runs that instance. By default, each instance runs in parallel so that no workflow has to wait before starting a run. If your workflow triggers for multiple events or items at the same time, a trigger entry appears for each item with the same date and time.
The following table lists the possible trigger statuses:
| Trigger status | Description |
|---|---|
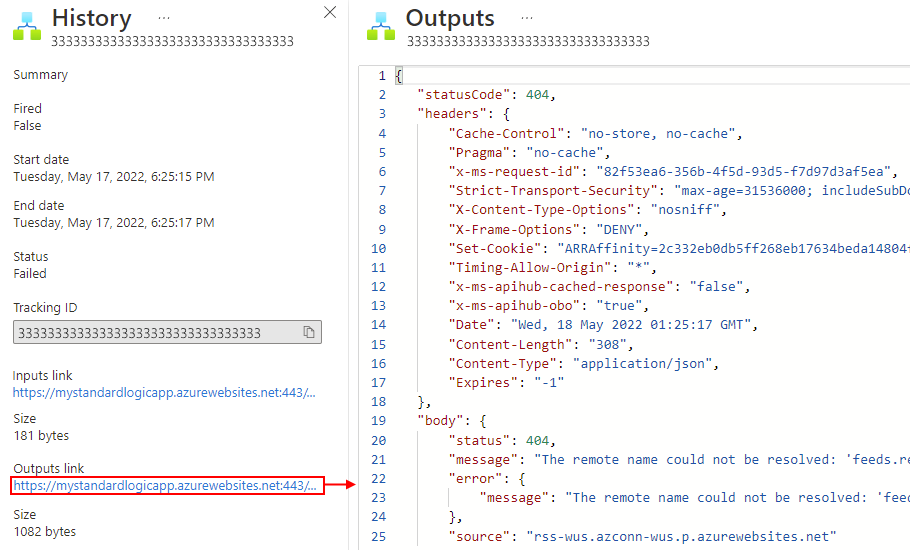
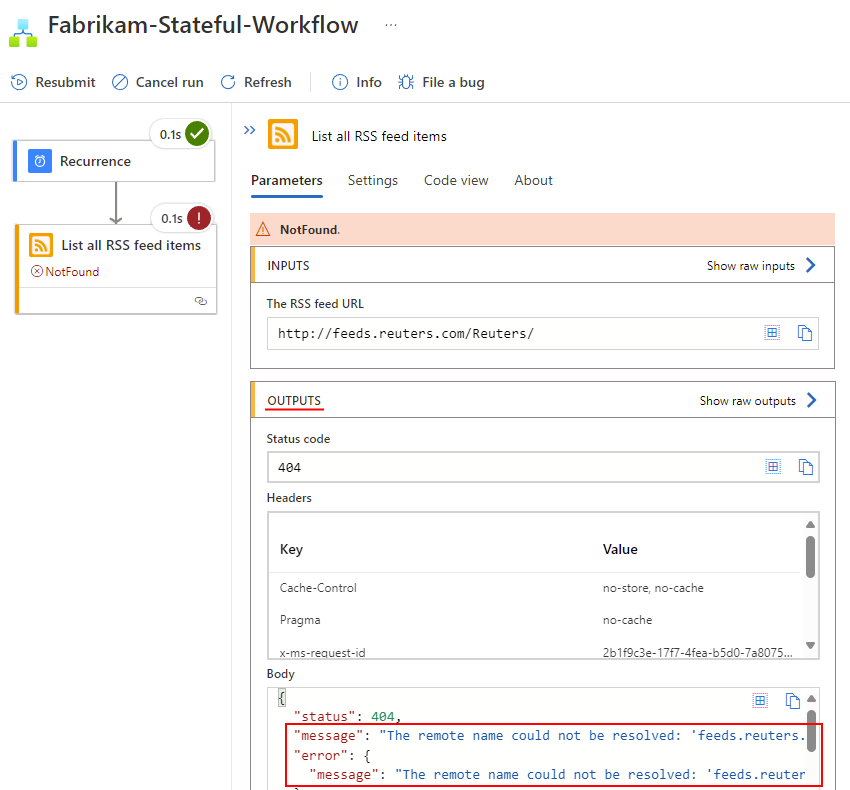
| Failed | An error occurred. To review any generated error messages for a failed trigger, select that trigger attempt, and choose Outputs. For example, you might find inputs that aren't valid. |
| Skipped | The trigger checked the endpoint but found no data that met the specified criteria. |
| Succeeded | The trigger checked the endpoint and found available data. Usually, a Fired status also appears alongside this status. If not, the trigger definition might have a condition or SplitOn command that wasn't met. This status can apply to a manual trigger, recurrence-based trigger, or polling trigger. A trigger can run successfully, but the run itself might still fail when the actions generate unhandled errors. |
Näpunäide
You can recheck the trigger without waiting for the next recurrence. On the Overview page toolbar or on the designer toolbar, select Run, Run.
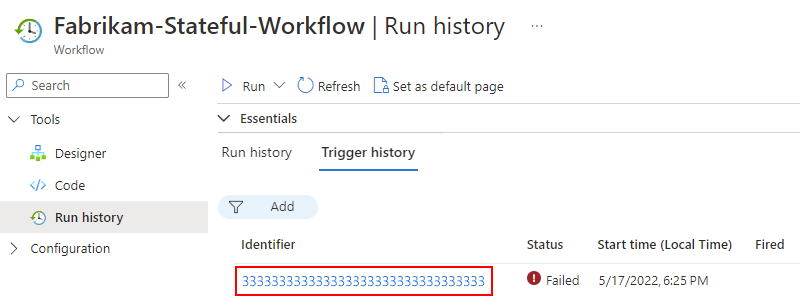
To view information about a specific trigger attempt, select that trigger event.
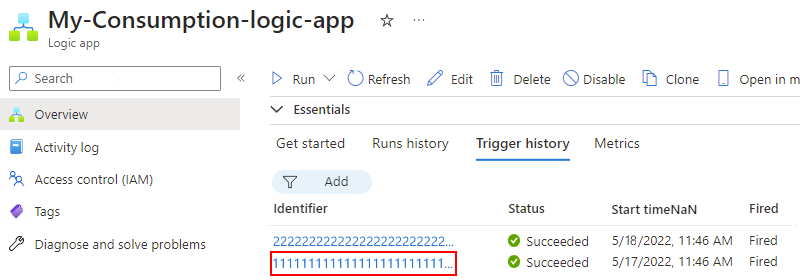
If the list shows many trigger attempts, and you can't find the entry that you want, try filtering the list. If you don't find the data that you expect, try selecting Refresh on the toolbar.
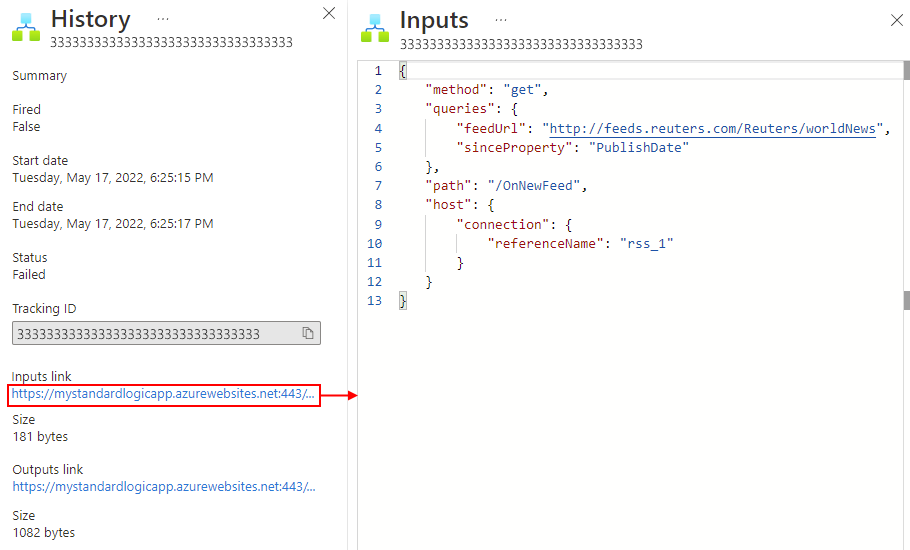
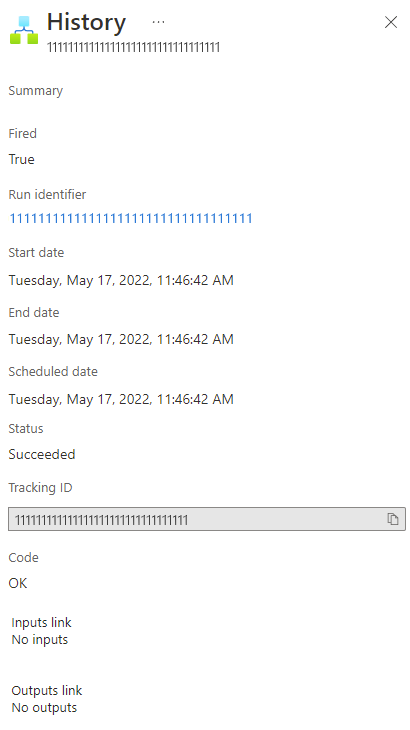
You can now review information about the selected trigger event, for example:
Each time that a trigger successfully fires, Azure Logic Apps creates a workflow instance and runs that instance. By default, each instance runs in parallel so that no workflow has to wait before starting a run. You can review what happened during each run, including the status, inputs, and outputs for each step in the workflow.
In the Azure portal, open your Consumption logic app resource and workflow in the designer.
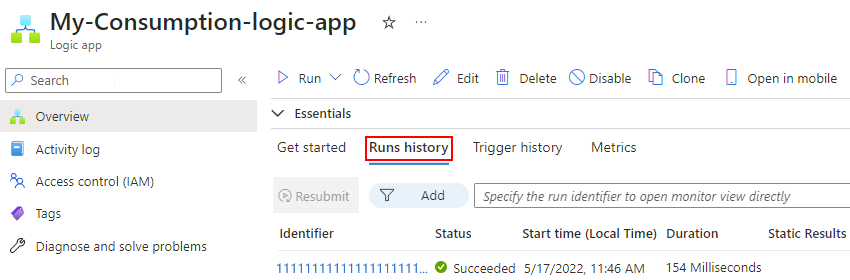
On your logic app menu, select Overview. On the Overview page, select Runs history.
Under Runs history, all the past, current, and any waiting runs appear. If the trigger fires for multiple events or items at the same time, an entry appears for each item with the same date and time.
Näpunäide
If the run status doesn't appear, try refreshing the Overview page by selecting Refresh. No run happens for a trigger that is skipped due to unmet criteria or finding no data.
The following table lists the possible run statuses:
| Run status | Description |
|---|---|
| Aborted | The run stopped or didn't finish due to external problems, for example, a system outage or lapsed Azure subscription. |
| Cancelled | The run was triggered and started, but received a cancellation request. |
| Failed | At least one action in the run failed. No subsequent actions in the workflow were set up to handle the failure. |
| Running | The run was triggered and is in progress. However, this status can also appear for a run that is throttled due to action limits or the current pricing plan. Tip: If you set up diagnostics logging, you can get information about any throttle events that happen. |
| Succeeded | The run succeeded. If any action failed, a subsequent action in the workflow handled that failure. |
| Timed out | The run timed out because the current duration exceeded the run duration limit, which is controlled by the setting named Run history retention in days. The run duration is calculated by using the run's start time and run duration limit at that start time. Note: If the run duration also exceeds the current run history retention limit, which is also controlled by the setting named Run history retention in days, the run is cleared from the run history by a daily cleanup job. Whether the run times out or completes, the retention period is always calculated by using the run's start time and current retention limit. So, if you reduce the duration limit for an in-flight run, the run times out. However, the run either stays or is cleared from the run history based on whether the run duration exceeded the retention limit. |
| Waiting | The run didn't start yet or is paused, for example, due to an earlier workflow instance that is still running. |
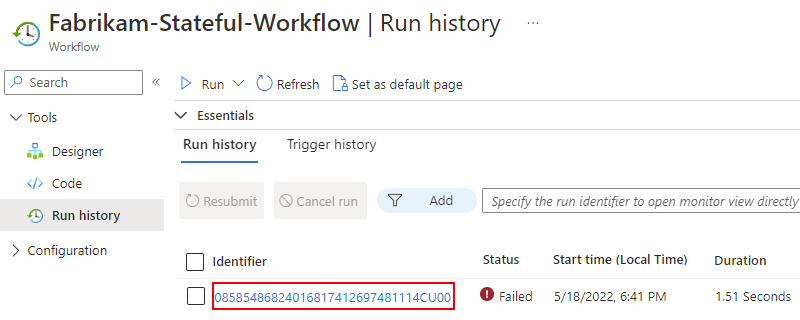
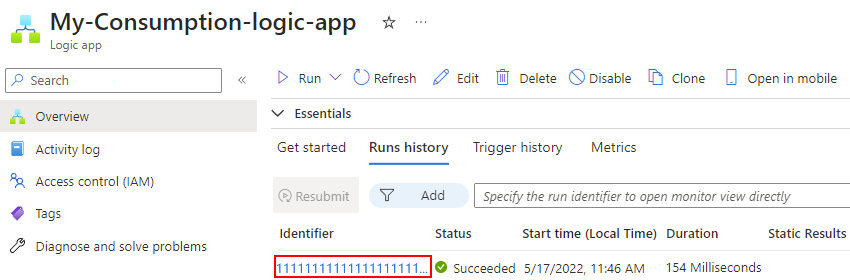
To review the steps and other information for a specific run, under Runs history, select that run. If the list shows many runs, and you can't find the entry that you want, try filtering the list.
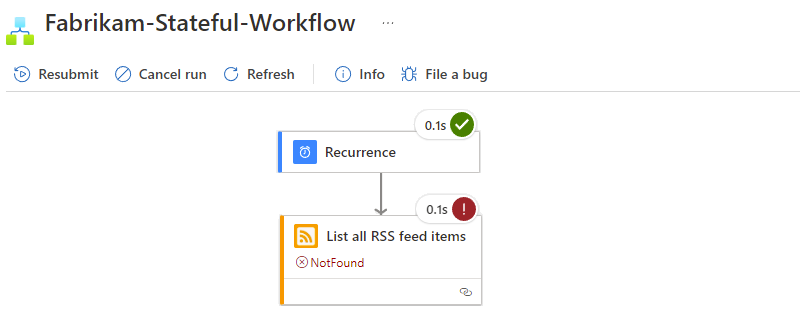
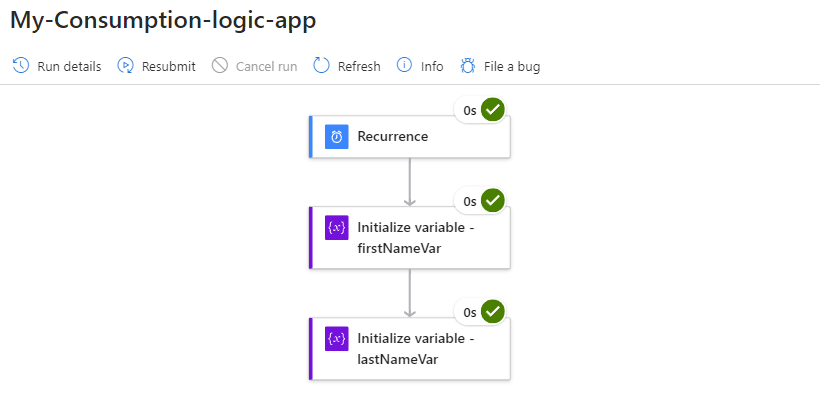
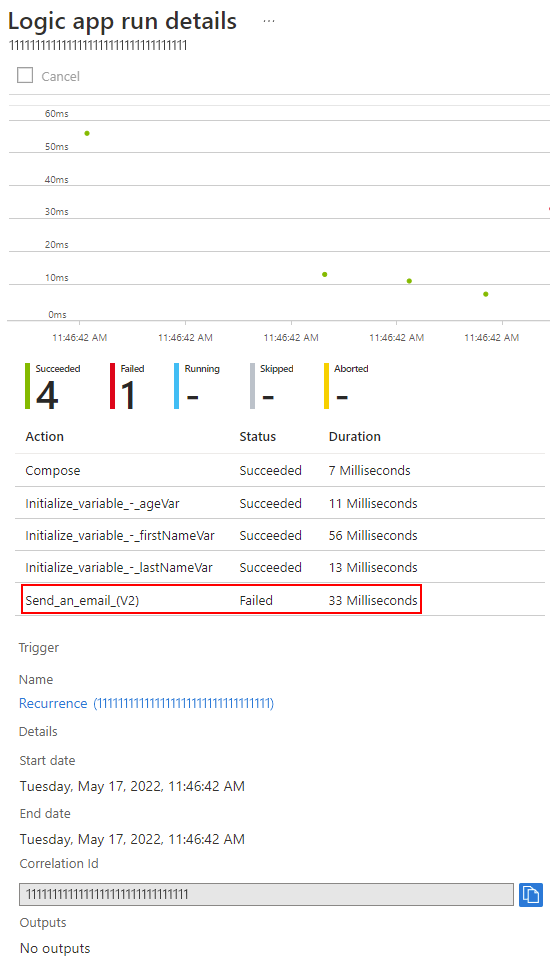
The run history page opens and shows the status for each step in the selected run, for example:
The following table shows the possible statuses that each workflow action can have and show in the portal:
| Action status | Icon | Description |
|---|---|---|
| Aborted |  |
The action stopped or didn't finish due to external problems, for example, a system outage or lapsed Azure subscription. |
| Cancelled |  |
The action was running but received a cancel request. |
| Failed |  |
The action failed. |
| Running |  |
The action is currently running. |
| Skipped |  |
The action was skipped because its runAfter conditions weren't met, for example, a preceding action failed. Each action has a runAfter object where you can set up conditions that must be met before the current action can run. |
| Succeeded |  |
The action succeeded. |
| Succeeded with retries |  |
The action succeeded but only after a single or multiple retries. To review the retry history, on the run history page, select that action so that you can view the inputs and outputs. |
| Timed out |  |
The action stopped due to the time-out limit specified by that action's settings. |
| Waiting |  |
Applies to a webhook action that is waiting for an inbound request from a caller. |
To view the information in list form, on the run history toolbar, select Run details.
The Logic app run details pane lists each step, their status, and other information.
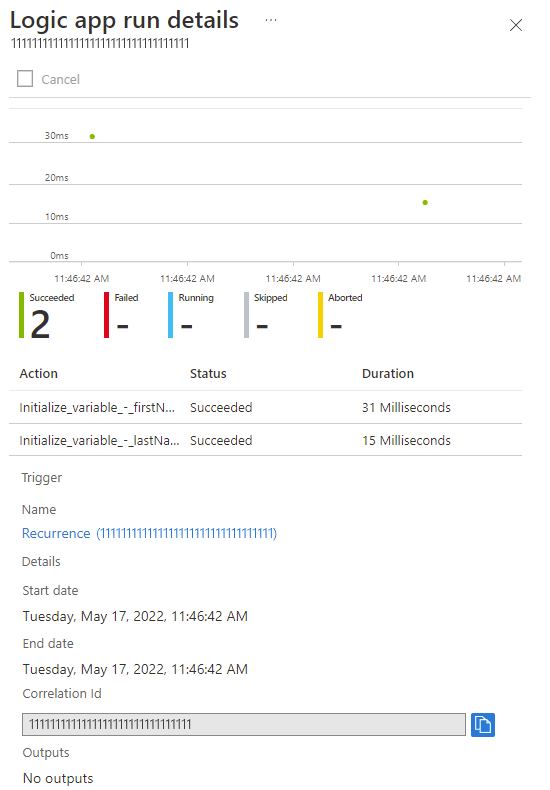
For example, you can get the run's Correlation Id property, which you might need when you use the REST API for Logic Apps.
To get more information about a specific step, select either option:
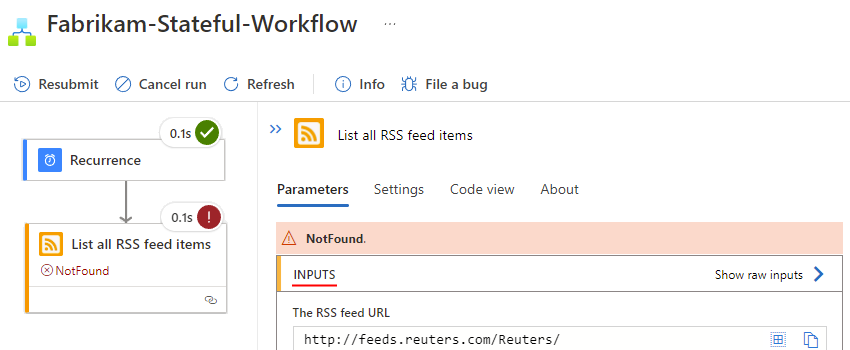
On the run history page, select a step to open a pane that shows the inputs, outputs, and any errors that happened in that step.
For example, suppose you have a workflow with a failed step. You want to review the inputs that might have caused the step to fail.
In this scenario, the failure resulted from an invalid or missing connection to an email account that is used to send an email.
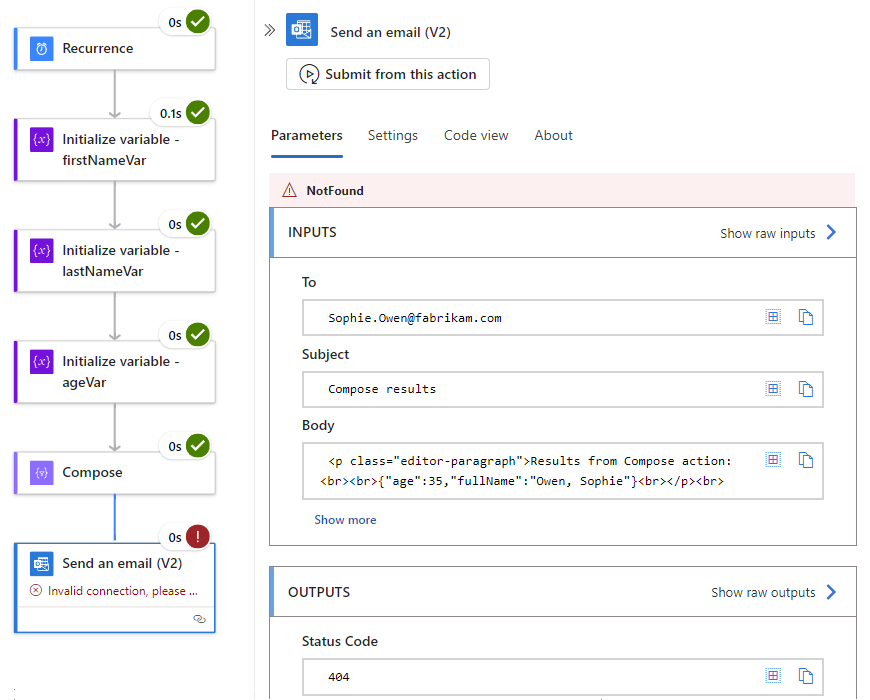
On the run history page toolbar, select Run details. In the Logic app run details pane that opens, select the step that you want, for example:
Märkus
All runtime details and events are encrypted within Azure Logic Apps and are decrypted only when a user requests to view that data. You can hide inputs and outputs in the workflow run history or control user access to this information by using Azure role-based access control (Azure RBAC).
You can rerun a previously finished workflow with the same inputs that the workflow used previously in the following ways:
Rerun the entire workflow.
Rerun the workflow starting at a specific action. The resubmitted action and all subsequent actions run as usual.
Completing this task creates and adds a new workflow run to your workflow's run history.
By default, only Consumption workflows and Standard stateful workflows, which record and store run history, are supported. To use these capabilities with a stateless Standard workflow, enable stateful mode. For more information, see Enable run history for stateless workflows and Enable stateful mode for stateless connectors.
The resubmitted run executes the same workflow version as the original run, even if you updated the workflow definition.
You can rerun only actions from sequential workflows. Workflows with parallel paths are currently not supported.
The workflow must have a completed state, such as Succeeded, Failed, or Cancelled.
The workflow must have 40 or fewer actions for you to rerun from a specific action.
If your workflow has operations such as create or delete operations, resubmitting a run might create duplicate data or try to delete data that no longer exists, resulting in an error.
These capabilities currently are unavailable with Visual Studio Code or Azure CLI.
In the Azure portal, open your Consumption logic app resource and workflow in the designer.
On your logic app menu, select Overview. On the Overview page, select Runs history.
Under Runs history, all the past, current, and any waiting runs appear. If the trigger fires for multiple events or items at the same time, an entry appears for each item with the same date and time.
On the Runs history page, select the run that you want to rerun, and then select Resubmit.
The Runs history tab adds the resubmitted run to the runs list.
Näpunäide
If the resubmitted run doesn't appear, on the Runs history page toolbar, select Refresh. No run happens for a trigger that is skipped due to unmet criteria or finding no data.
To review the inputs and outputs after the resubmitted run finishes, on the Runs history tab, select that run.
The rerun action capability is available for most actions except for nonsequential workflows, complex concurrency scenarios, and the following limitations:
| Actions | Resubmit availability and limitations |
|---|---|
| Condition action and actions in the True and False paths | - Yes for Condition action - No for actions in the True and False paths |
| For each action plus all actions inside the loop and after the loop | No for all actions |
| Switch action and all actions in the Default path and Case paths | - Yes for Switch action - No for actions in the Default path and Case paths |
| Until action plus all actions inside the loop and after the loop | No for all actions |
In the Azure portal, open your Consumption logic app resource.
On the logic app resource menu, select Overview. On the Overview page, select Runs history, which shows the run history for the workflow.
On the Runs history tab, select the run that has the action from where you want to rerun the workflow.
The run history page opens and shows the status for each step in the selected run.
To rerun the workflow starting from a specific action, choose either option:
Find the action from where to start rerunning the workflow, open the shortcut menu, and select Submit from this action.
Select the action from where to start rerunning the workflow. In the pane that opens, under the action name, select Submit from this action.
The run history page refreshes and shows the resubmitted run. All the operations that precede the resubmitted action show a lighter-colored status icon, representing reused inputs and outputs. The resubmitted action and subsequent actions show the colored status icons. For more information, see Review workflow run history.
Näpunäide
If the resubmitted run doesn't fully finish, on the run details page toolbar, select Refresh.
To get alerts based on specific metrics or exceeded thresholds in your workflow, set up your logic app resource with alerts in Azure Monitor. For more information, see Metrics in Azure.
To set up alerts without using Azure Monitor, follow these steps, which apply to both Consumption and Standard logic app resources:
On your logic app resource menu, under Monitoring, select Alerts. On the toolbar, select Create > Alert rule.
On the Create an alert rule page, from the Signal name list, select the signal for which you want to get an alert.
Märkus
Alert signals differ between Consumption and Standard logic apps. For example, Consumption logic apps have many trigger-related signals, such as Triggers Completed and Triggers Failed, while Standard workflows have the Workflow Triggers Completed Count and Workflow Triggers Failure Rate signals.
For example, to send an alert when a trigger fails in a Consumption workflow, follow these steps:
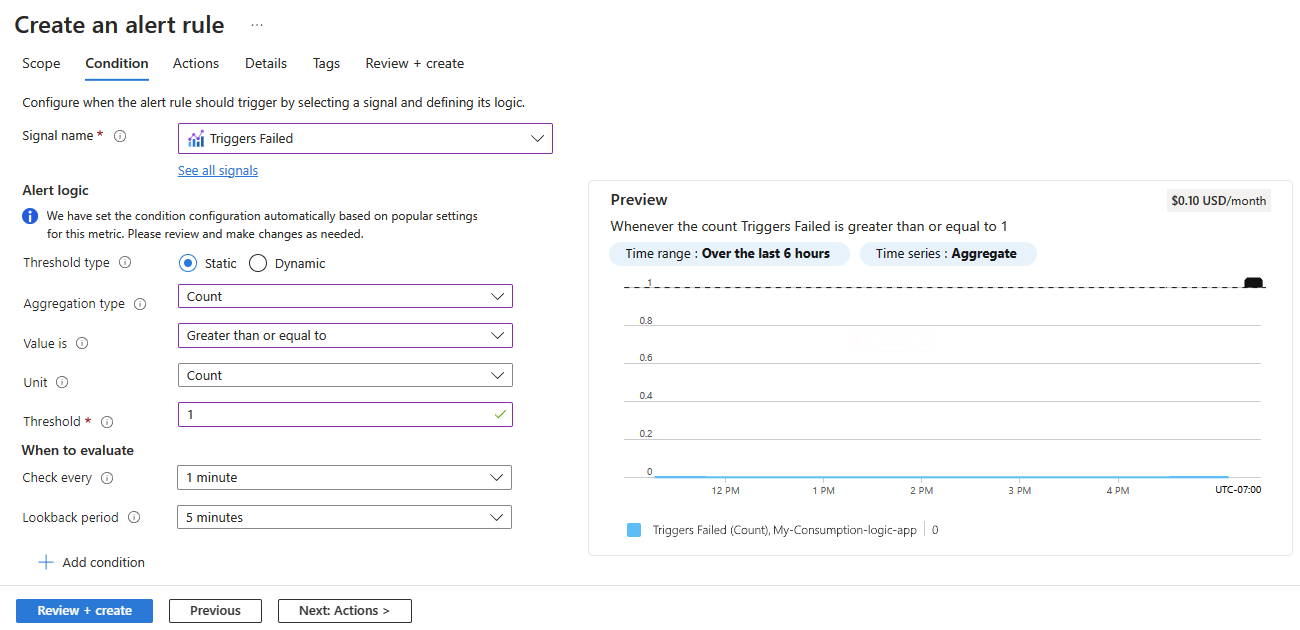
From the Signal name list, select the Triggers Failed signal.
Under Alert logic, set up your condition, for example:
| Property | Example value |
|---|---|
| Threshold | Static |
| Aggregation type | Count |
| Operator | Greater than or equal to |
| Unit | Count |
| Threshold value | 1 |
The Preview section now shows the condition that you set up, for example:
Whenever the count Triggers Failed is greater than or equal to 1
Under When to evaluate, set up the schedule for checking the condition:
| Property | Example value |
|---|---|
| Check every | 1 minute |
| Lookback period | 5 minutes |
For example, the finished condition looks similar to the following example, and the Create an alert rule page now shows the cost for running that alert:
When you're ready, select Review + Create.
For general information, see Create an alert rule from a specific resource - Azure Monitor.
Sündmused
Tehisintelektirakenduste ja agentide koostamine
17. märts, 21 - 21. märts, 10
Liituge sarjaga, et luua muude arendajate ja ekspertidega skaleeritavad tehisintellektilahendused, mis põhinevad reaalajas kasutusjuhtumitel.
Registreeruge koheKoolitus
Moodul
Route and process data automatically using Azure Logic Apps - Training
Learn how to create a workflow to run your business with Azure Logic Apps using prebuilt triggers, actions, and condition operators.