Tutorial: Run code in the Debugger in Visual Studio
This article presents Step 4 in the tutorial series Work with Python in Visual Studio.
Visual Studio provides capabilities to manage projects, a rich editing experience, the Interactive Window, and full-featured debugging for Python code. In Step 4 of this tutorial series, you use the Debugger to run your code step by step, including every iteration of a loop. In the Debugger, you can pause your program whenever certain conditions are true. At any point when the program is paused, you can examine the entire program state and change the value of variables. Such actions are essential for tracking down program bugs, and also provide helpful aids for following the exact program flow.
In Step 4 of the tutorial, you learn how to:
- Run Python code in the Debugger in Visual Studio
- Set breakpoints and conditions
- Examine program state and change variables
- Explore Debugger windows and actions
Prerequisites
- A Python application project that has a Python file (.py) with code created in Step 2: Write and run Python code and Step 3: Use the Interactive REPL window of this tutorial.
Prepare the Python file
To prepare for the debugging exercise, follow these steps to update your Python project file to include more robust code:
Open your Python project file (.py) in the editor.
Replace the code in the file with the following code. This version of the code expands the
make_dot_stringfunction so you can examine its discrete steps in the debugger. It moves theforloop into amainfunction and runs it explicitly by calling themainfunction:from math import cos, radians # Create a string with spaces proportional to a cosine of x in degrees def make_dot_string(x): rad = radians(x) # cos works with radians numspaces = int(20 * cos(rad) + 20) # Scale to 0-40 spaces st = ' ' * numspaces + 'o' # Place 'o' after the spaces return st def main(): for i in range(0, 1800, 12): s = make_dot_string(i) print(s) main()
Start debugging
Now you're ready to start checking your updated Python code in the Debugger.
Confirm the code works properly by selecting Debug > Start Debugging on the toolbar or use the F5 keyboard shortcut. These commands run the code in the Debugger.
The Debugger doesn't detect any issues, so the program runs successfully. An output window opens and you see a few iterations of the cosine wave pattern. Select any key to close the output window.
Tip
To close the output window automatically when the program completes, select Tools > Options, expand the Python> Debugging tab, and clear the Wait for input when process exits normally option.
Set a breakpoint on the
forloop statement by using one of the following methods:- Select in the left margin for the line of code.
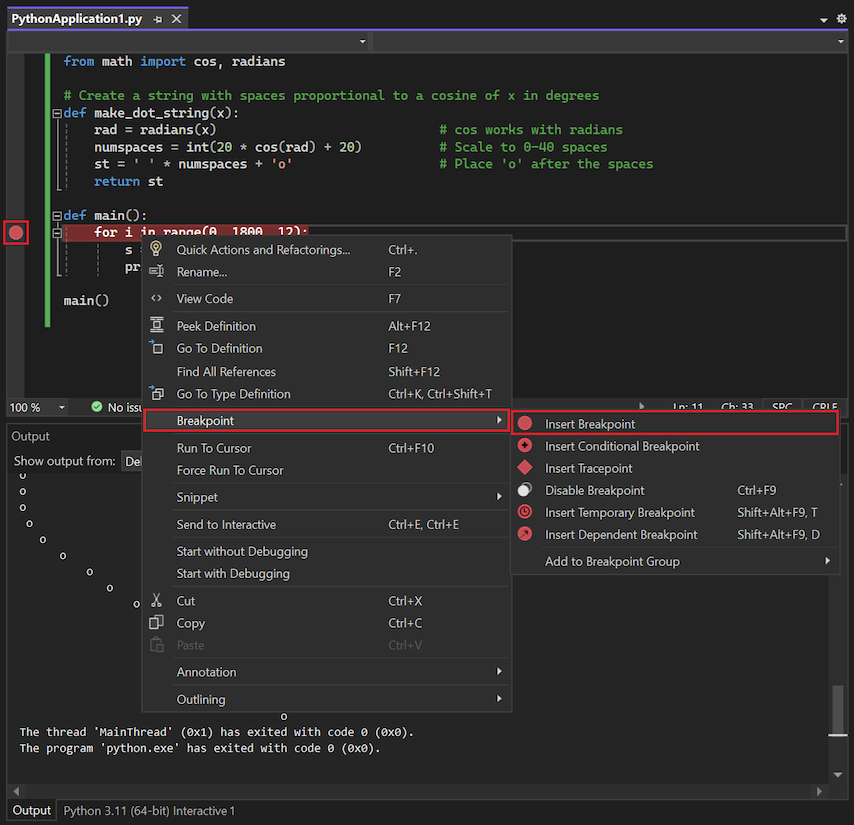
- Right-click the line of code and select Breakpoint > Insert Breakpoint.
- Place the insertion caret in the line of code and select Debug > Toggle Breakpoint (or use the F9 keyboard shortcut).
Breakpoints stop execution of code at a marked point so you can inspect the program state. A red dot appears on each line that has a set breakpoint.
Start the Debugger again (F5). The running code for the program stops on the line with the set breakpoint. You can now inspect the call stack and examine variables for this state of the running program code.
Visual Studio provides many ways to observe your program code and execution data, including the following windows:
- The Call stack shows the history of function and method calls by the program code.
- Defined variables that are in-scope appear in the Autos window.
- The Locals view shows all variables that Visual Studio finds in the current scope (including functions), even before they're defined in the code.
To see the full list of available windows and actions, select Debug > Windows.
You can open the Debugger windows to view your program state when a breakpoint is encountered:


Use Debugger actions
When Visual Studio stops code execution at a breakpoint, there are several commands you can use to step through your code or run blocks of code before breaking again. The commands are available in a few places in Visual Studio, including the Debugger toolbar, the Debug menu, the right-click context menu in the code editor, and through keyboard shortcuts.
The Debugger toolbar along the top of the Visual Studio window provides quick access to the most common debugging commands:

The following table summarizes these commands as they appear from left to right on the toolbar:
| Action | Shortcut | Description |
|---|---|---|
| Continue | F5 | Run code until you reach the next breakpoint or until program completion. |
| Break All | Ctrl+Alt+Break | Pause a long-running program. |
| Stop Debugging | Shift+F5 | Stop the program at the current point, and exit the Debugger. |
| Restart | Ctrl+Shift+F5 | Stop the program at the current point, and restart program execution from the beginning in the Debugger. |
| Show Next Statement | Alt+Num+\ | Return to the next statement to run in the code. This command helps you locate the place in your code where the Debugger is stopped. |
| Step Into | F11 | Run the next statement and stop. If the next statement is a call to a function, the Debugger steps into the function and stops at the first line. |
| Step Over | F10 | Run the next statement, including making a call to a function (running all its code) and applying any return value. This command allows you to easily skip functions that you don't need to debug. |
| Step Out | Shift+F11 | Run the code until the end of the current function, then step to the calling statement and pause. This command is useful when you don't need to debug the remainder of the current function. |
Follow these steps to work with Debugger actions in your Python code:
Step over the
forloop statement by using the Step Over action.Stepping causes the Debugger to run the current line of code, including any called function, and immediately pause again. After you step over, notice that the variable
iis now defined in the Locals and Autos windows.Step Over the next line of code, which calls the
make_dot_stringfunction.In this instance, Step Over causes the Debugger to run the complete
make_dot_stringfunction and pause after the return from the function. The Debugger doesn't stop inside the function unless a separate breakpoint exists there.Continue stepping over the code a few more times and observe how the values in the Locals or Autos window change.
In the Locals or Autos window, double-click the Value column for a variable to edit the value. In this example, change the value for the
svariable to'Hello, Python Application'. Be sure to enclose the value in single quotes. Select Enter or any area outside the value to apply your changes.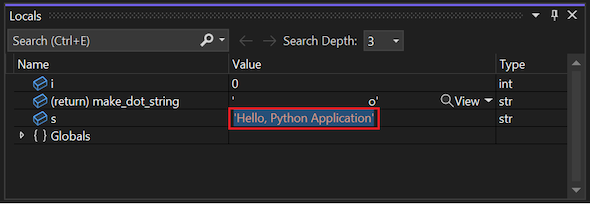
Continue stepping through the code by using Step Into until the call to the
make_dot_stringfunction.For a function, Step Into causes the Debugger to both call the function and also step into the function code. When the debugging process is inside a function, you can examine its local variables and step through its code specifically. In this example, the Step into action moves into the
make_dot_stringfunction.Continue stepping with Step Into until the return from the
make_dot_stringfunction.When you reach the end of the
make_dot_stringfunction code, the next step returns the *Debugger to theforloop with the new return value in thesvariable.As you step again to the
printstatement, notice that the Step Into action on theprintstatement doesn't enter into that function. This behavior is because theprintfunction isn't written in Python. It's native code inside the Python runtime.Continue using Step Into until you're again partway into the
make_dot_stringfunction, then use Step Out and notice that the Debugger returns to theforloop.With Step Out, the Debugger runs the remainder of the function and then automatically pauses in the calling code. This action is helpful after you step through some portion of a lengthy function and you want to end your observation of the function. Step Out steps through the remaining code or until it reaches an explicit breakpoint set in the calling code.
Continue running the program until the next breakpoint is reached by using Continue (F5). Because you have a breakpoint set in the
forloop, you break on the next iteration.You can confirm the program is continuing to execute by observing the changing value for the
svariable in the Locals window.

Use breakpoint conditions
Stepping through hundreds of iterations of a loop can be tedious, so Visual Studio lets you add a condition to a breakpoint. When you set a breakpoint condition, the Debugger pauses the program at the breakpoint only when the condition is met.
The following steps show how to define a breakpoint condition on the for loop statement so the Debugger pauses only when the value of the i variable exceeds 1600:
To set the breakpoint condition, right-click the red breakpoint dot and select Conditions or use the keyboard shortcut Alt+F9 > C.
In the Breakpoint Settings popup dialog, configure the following settings to create the Condition:
Set the condition type to Conditional Expression.
Define the condition evaluation to Is true.
Enter
i > 1600as the condition value.Select Close.

Select F5 to continue debugging and program execution. Observe that the program runs many iterations before it reaches the conditional breakpoint.
You can confirm that the Debugger correctly pauses program execution when it reaches the conditional breakpoint. When the condition is met, the Locals window shows the
ivariable value as1608.To run the program to completion, you can disable the breakpoint and continue the program execution.
Hover over the red dot and select Disable, or right-click the red dot and select Disable breakpoint.
Select Continue (or press F5) to run the program.
When the program ends, Visual Studio stops the debugging session and returns to editing mode.
You can also delete a breakpoint. Select the red dot or right-click the dot and select Delete breakpoint. This action also deletes any defined conditions.

Tip
In some situations, such as a failure to launch the Python interpreter itself, the Python output window might close immediately after the program finishes without pausing and showing the Press any key to continue prompt. To force the pause and prompt, add the -i argument to the Run > Interpreter Arguments field on the Debug tab. This argument puts the Python interpreter into interactive mode after the code runs. The program waits for you to select Ctrl+Z+Enter to close the window.
Next step
Visszajelzés
Hamarosan elérhető: 2024-ben fokozatosan kivezetjük a GitHub-problémákat a tartalom visszajelzési mechanizmusaként, és lecseréljük egy új visszajelzési rendszerre. További információ: https://aka.ms/ContentUserFeedback.
Visszajelzés küldése és megtekintése a következőhöz: