Thirty Day Retention report
The Thirty day Retention report table illustrates how many of your players came back to the game within a 30-day period.
A new Cohort of players is formed every day, based on all the players (new and returning), who have logged in to your game on a given day (Day 0).
Cohort size is determined by the number of players within it. Then each cell shows the percentage of players (%) from a given Cohort who returned on each subsequent day.
The Thirty Day Retention report table illustrates how many of your players came back to the game within a 30-day period.
The example report shown below was generated on 1/24/2018. It shows, for instance, that on 12/25/2017, 1.38M users logged in.
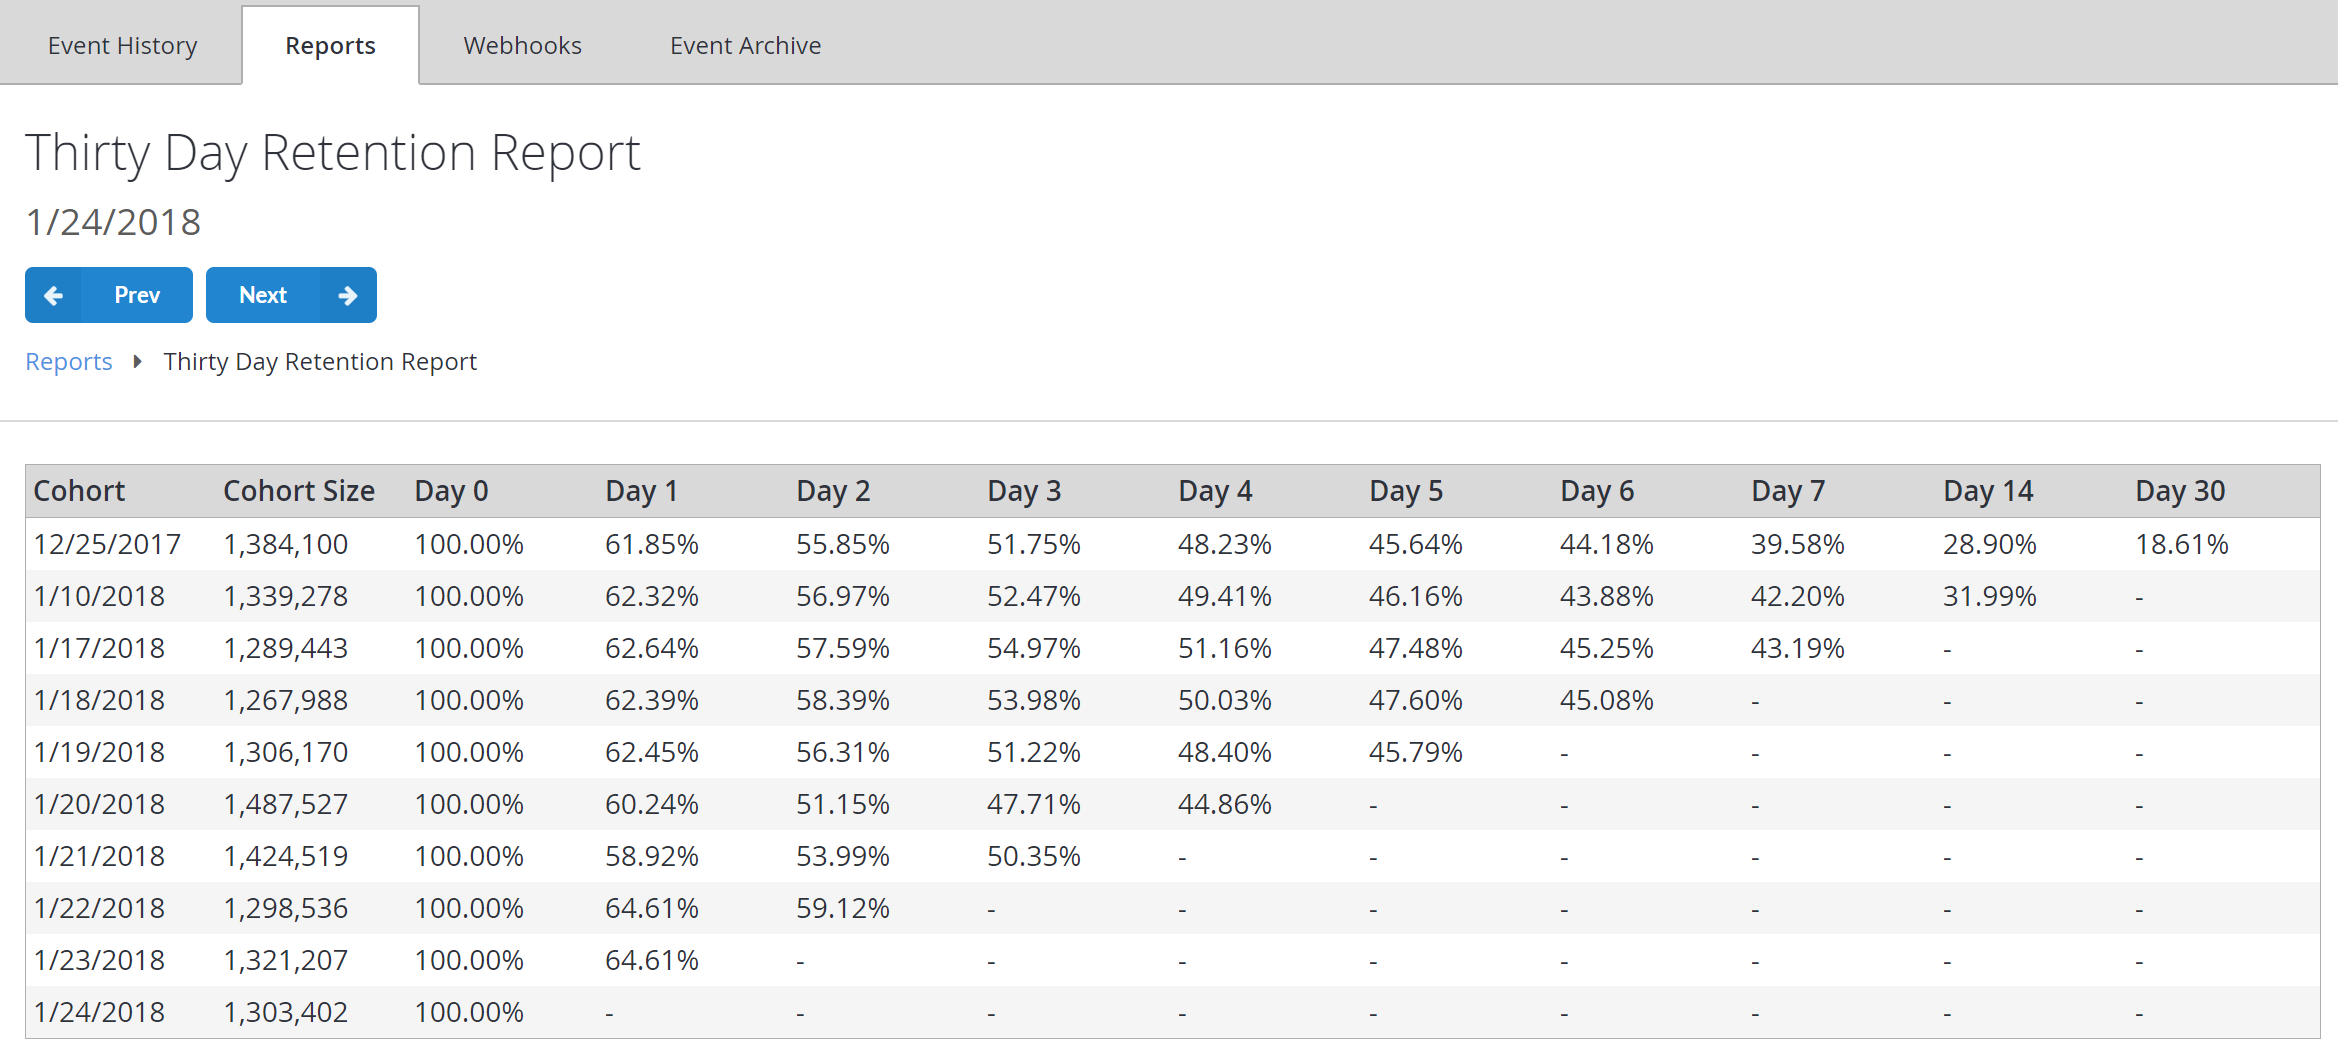
Then 61.85% of them logged in the next day, and 55.85% of them logged in two days later.
Finally, 18.6% came back 30 days later, which corresponds to the report generate date, 1/24/2018.
This report, in addition to the New User Retention Report, is especially useful when you are running a LiveOps event, and want to check its effect on boosting engagement of existing players. For additional details, see Metrics and Terminology.
Populating the report
To populate this report, you need to register a player, and then have them log in several days in a row at least once.
This, however, will produce trivial results, (with 100% retention for each day). Throwing more players into the process and skipping some days will produce more interesting results.
The following API calls may be used to log in:
Visszajelzés
Hamarosan elérhető: 2024-ben fokozatosan kivezetjük a GitHub-problémákat a tartalom visszajelzési mechanizmusaként, és lecseréljük egy új visszajelzési rendszerre. További információ: https://aka.ms/ContentUserFeedback.
Visszajelzés küldése és megtekintése a következőhöz: