Оқыту
Оқыту бағдарламасы
Use advance techniques in canvas apps to perform custom updates and optimization - Training
Use advance techniques in canvas apps to perform custom updates and optimization
Бұл браузерге бұдан былай қолдау көрсетілмейді.
Соңғы мүмкіндіктерді, қауіпсіздік жаңартуларын және техникалық қолдауды пайдалану үшін Microsoft Edge браузеріне жаңартыңыз.
В этой статье показано, как визуализировать области геометрии компонентов Polygon и MultiPolygon на карте с помощью слоя многоугольников.
Ескерім
Прекращение использования пакета SDK для Android для Azure Maps
Пакет SDK для машинного кода Azure Maps для Android теперь не рекомендуется и будет снят с 3.31.25. Чтобы избежать сбоев в работе служб, перейдите в веб-пакет SDK Azure Maps на 3/31/25. Дополнительные сведения см . в руководстве по миграции пакета SDK для Android для Azure Maps.
Обязательно выполните действия, описанные в кратком руководстве по созданию приложения Android. Блоки кода, приведенные в этой статье, можно поместить в обработчик событий onReady для карт.
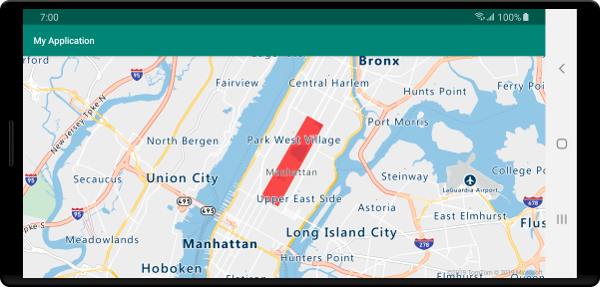
Если слой многоугольников подключен к источнику данных и загружен на карту, он отображает область с компонентами Polygon и MultiPolygon. Чтобы создать многоугольник, добавьте его в источник данных и отрисовку с помощью слоя многоугольников с помощью PolygonLayer класса.
//Create a data source and add it to the map.
DataSource source = new DataSource();
map.sources.add(source);

//Create a rectangular polygon.
source.add(Polygon.fromLngLats(
    Arrays.asList(
        Arrays.asList(
            Point.fromLngLat(-73.98235, 40.76799),
            Point.fromLngLat(-73.95785, 40.80044),
            Point.fromLngLat(-73.94928, 40.79680),
            Point.fromLngLat(-73.97317, 40.76437),
            Point.fromLngLat(-73.98235, 40.76799)
        )
    )
));

//Create and add a polygon layer to render the polygon on the map, below the label layer.
map.layers.add(new PolygonLayer(source,
    fillColor("red"),
    fillOpacity(0.7f)
), "labels");
//Create a data source and add it to the map.
val source = DataSource()
map.sources.add(source)

//Create a rectangular polygon.
source.add(
    Polygon.fromLngLats(
        Arrays.asList(
            Arrays.asList(
                Point.fromLngLat(-73.98235, 40.76799),
                Point.fromLngLat(-73.95785, 40.80044),
                Point.fromLngLat(-73.94928, 40.79680),
                Point.fromLngLat(-73.97317, 40.76437),
                Point.fromLngLat(-73.98235, 40.76799)
            )
        )
    )
)

//Create and add a polygon layer to render the polygon on the map, below the label layer.
map.layers.add(
    PolygonLayer(
        source,
        fillColor("red"),
        fillOpacity(0.7f)
    ), "labels"
)
На следующем снимке экрана показан приведенный выше код для отрисовки области многоугольника с помощью слоя многоугольников.
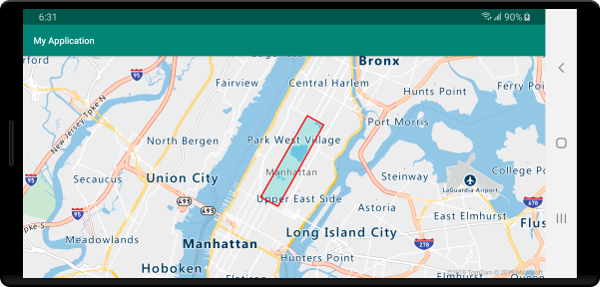
Контуры многоугольников можно визуализировать с помощью слоев линий. Следующий пример кода визуализирует многоугольник, как в предыдущем примере, но теперь добавляет слой линии. Этот слой линий является вторым слоем, подключенным к источнику данных.
//Create a data source and add it to the map.
DataSource source = new DataSource();
map.sources.add(source);

//Create a rectangular polygon.
source.add(Polygon.fromLngLats(
    Arrays.asList(
        Arrays.asList(
            Point.fromLngLat(-73.98235, 40.76799),
            Point.fromLngLat(-73.95785, 40.80044),
            Point.fromLngLat(-73.94928, 40.79680),
            Point.fromLngLat(-73.97317, 40.76437),
            Point.fromLngLat(-73.98235, 40.76799)
        )
    )
));

//Create and add a polygon layer to render the polygon on the map, below the label layer.
map.layers.add(new PolygonLayer(source,
    fillColor("rgba(0, 200, 200, 0.5)")
), "labels");

//Create and add a line layer to render the outline of the polygon.
map.layers.add(new LineLayer(source,
    strokeColor("red"),
    strokeWidth(2f)
));
//Create a data source and add it to the map.
val source = DataSource()
map.sources.add(source)

//Create a rectangular polygon.
source.add(
    Polygon.fromLngLats(
        Arrays.asList(
            Arrays.asList(
                Point.fromLngLat(-73.98235, 40.76799),
                Point.fromLngLat(-73.95785, 40.80044),
                Point.fromLngLat(-73.94928, 40.79680),
                Point.fromLngLat(-73.97317, 40.76437),
                Point.fromLngLat(-73.98235, 40.76799)
            )
        )
    )
)

//Create and add a polygon layer to render the polygon on the map, below the label layer.
map.layers.add(
    PolygonLayer(
        source,
        fillColor("rgba(0, 200, 200, 0.5)")
    ), "labels"
)

//Create and add a line layer to render the outline of the polygon.
map.layers.add(
    LineLayer(
        source,
        strokeColor("red"),
        strokeWidth(2f)
    )
)
На следующем снимке экрана показан приведенный выше код, который выполняет отрисовку многоугольника с отображением его контура с помощью слоя линий.
Шайпұл
При создании контура многоугольника с помощью линейного слоя необходимо закрыть все кольца в многоугольниках таким, чтобы все массивы точек имеют одинаковые начальные и конечные точки. Если этого не сделать, то слой линий не сможет соединить последнюю точку многоугольника с первой точкой.
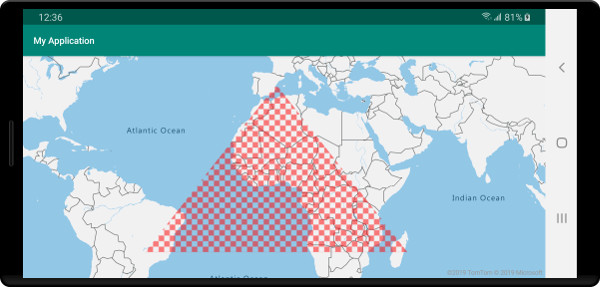
Кроме заливки многоугольника цветом, можно использовать изображение узора для заливки многоугольника. Загрузите шаблон изображения в ресурсы спрайтов изображения карт, а затем сошлитесь на это изображение с параметром fillPattern слоя полигонов.
//Load an image pattern into the map image sprite.
map.images.add("fill-checker-red", R.drawable.fill_checker_red);

//Create a data source and add it to the map.
DataSource source = new DataSource();
map.sources.add(source);

//Create a polygon.
source.add(Polygon.fromLngLats(
    Arrays.asList(
        Arrays.asList(
            Point.fromLngLat(-50, -20),
            Point.fromLngLat(0, 40),
            Point.fromLngLat(50, -20),
            Point.fromLngLat(-50, -20)
        )
    )
));

//Create and add a polygon layer to render the polygon on the map, below the label layer.
map.layers.add(new PolygonLayer(source,
        fillPattern("fill-checker-red"),
        fillOpacity(0.5f)
), "labels");
//Load an image pattern into the map image sprite.
map.images.add("fill-checker-red", R.drawable.fill_checker_red)

//Create a data source and add it to the map.
val source = DataSource()
map.sources.add(source)

//Create a polygon.
source.add(
    Polygon.fromLngLats(
        Arrays.asList(
            Arrays.asList(
                Point.fromLngLat(-50, -20),
                Point.fromLngLat(0, 40),
                Point.fromLngLat(50, -20),
                Point.fromLngLat(-50, -20)
            )
        )
    )
)

//Create and add a polygon layer to render the polygon on the map, below the label layer.
map.layers.add(
    PolygonLayer(
        source,
        fillPattern("fill-checker-red"),
        fillOpacity(0.5f)
    ), "labels"
)
В этом примере приведенное ниже изображение загружается в прорисовываемую папку приложения.
 |
|---|
| fill-checker-red.png |
На следующем рисунке показан снимок экрана приведенного выше кода, отрисовка многоугольника с шаблоном заливки на карте.
Дополнительные примеры кода для добавления в карты см. в следующих статьях:
Оқыту
Оқыту бағдарламасы
Use advance techniques in canvas apps to perform custom updates and optimization - Training
Use advance techniques in canvas apps to perform custom updates and optimization