Application Insights를 사용하여 Azure Batch .NET 애플리케이션 모니터링 및 디버깅
Application Insights는 개발자가 Azure 서비스에 배포된 애플리케이션을 모니터링 및 디버그할 수 있는 세련되고 강력한 방법을 제공합니다. Application Insights를 사용하여 성능 카운터 및 예외를 모니터링하고 사용자 지정 메트릭 및 추적으로 코드를 계측할 수 있습니다. Application Insights를 Azure Batch 애플리케이션과 통합하면 동작에 대한 구체적인 인사이트를 얻고 거의 실시간으로 문제를 조사할 수 있습니다.
이 문서에서는 Azure Batch .NET 솔루션에 Application Insights 라이브러리를 추가 및 구성하고 애플리케이션 코드를 계측하는 방법을 보여줍니다. Azure Portal을 통해 애플리케이션을 모니터링하고 사용자 지정 대시보드를 빌드하는 방법도 보여줍니다. 다른 언어로 지원되는 Application Insights는 언어, 플랫폼 및 통합 설명서를 참조하세요.
이 문서에서 코드와 함께 사용할 샘플 C# 솔루션은 GitHub에서 제공합니다. 이 예제에서는 Application Insights 계측 코드를 TopNWords 예제에 추가합니다. 이 예제에 익숙하지 않은 경우 먼저 TopNWords를 빌드하고 실행해 보세요. 여러 컴퓨팅 노드에서 입력 Blobs 세트를 병렬로 처리하는 기본 Batch 워크플로를 이해하는 데 도움이 될 것입니다.
팁
대안으로 Batch Explorer의 VM 성능 카운터 같은 Application Insights 데이터를 표시하도록 Batch 솔루션을 구성합니다. Batch Explorer는 Azure Batch 애플리케이션을 만들고, 디버그하고, 모니터링할 수 있도록 하는 무료의 풍부한 기능을 가진 독립 실행형 클라이언트 도구입니다. Mac, Linux 또는 Windows의 경우 설치 패키지를 다운로드합니다. Batch Explorer에서 Application Insights 데이터를 사용하도록 설정하는 빠른 단계는 일괄 처리 인사이트 리포지토리를 참조하세요.
필수 조건
Application Insights 리소스. Azure Portal을 사용하여 Application Insights 리소스를 만듭니다. 일반애플리케이션 유형을 선택합니다.
Azure Portal에서 계측 키를 복사합니다. 나중에 이 값이 필요합니다.
참고 항목
Application Insights에 저장된 데이터에 대한 요금이 부과될 수 있습니다. 여기에는 이 문서에서 살펴보는 진단 및 모니터링 데이터가 포함됩니다.
프로젝트에 Application Insights 추가
Microsoft.ApplicationInsights.WindowsServer NuGet 패키지와 해당 종속성이 프로젝트에 필요합니다. 애플리케이션의 프로젝트에 추가하거나 복원해야 합니다. 패키지를 설치하려면 Install-Package 명령 또는 NuGet 패키지 관리자를 사용합니다.
Install-Package Microsoft.ApplicationInsights.WindowsServer
Microsoft.ApplicationInsights 네임스페이스를 사용하여 .NET 애플리케이션에서 Application Insights를 참조합니다.
코드 계측
코드를 계측하려면 솔루션에서 Application Insights TelemetryClient를 만들어야 합니다. 예제의 TelemetryClient는 ApplicationInsights.config 파일의 구성을 로드합니다. 다음 프로젝트의 ApplicationInsights.config를 Application Insights 계측 키 Microsoft.Azure.Batch.Samples.TelemetryStartTask and TopNWordsSample로 업데이트해야 합니다.
<InstrumentationKey>YOUR-IKEY-GOES-HERE</InstrumentationKey>
또한 TopNWords.cs 파일의 계측 키를 추가합니다.
TopNWords.cs 파일의 예제에서는 Application Insights API의 다음 계측 호출을 사용합니다.
TrackMetric()- 컴퓨팅 노드에서 필요한 텍스트 파일을 다운로드하는 데 걸리는 평균 시간을 추적합니다.TrackTrace()- 코드에 디버깅 호출을 추가합니다.TrackEvent()- 캡처할 흥미로운 이벤트를 추적합니다.
이 예제에서는 예외 처리를 의도적으로 배제합니다. 그 대신, Application Insights가 처리되지 않은 예외를 자동으로 보고하므로 디버깅 환경이 크게 개선됩니다.
다음 코드 조각은 이러한 메서드를 사용하는 방법을 보여줍니다.
public void CountWords(string blobName, int numTopN, string storageAccountName, string storageAccountKey)
{
    // simulate exception for some set of tasks
    Random rand = new Random();
    if (rand.Next(0, 10) % 10 == 0)
    {
        blobName += ".badUrl";
    }

    // log the url we are downloading the file from
    insightsClient.TrackTrace(new TraceTelemetry(string.Format("Task {0}: Download file from: {1}", this.taskId, blobName), SeverityLevel.Verbose));

    // open the cloud blob that contains the book
    var storageCred = new StorageCredentials(storageAccountName, storageAccountKey);
    CloudBlockBlob blob = new CloudBlockBlob(new Uri(blobName), storageCred);
    using (Stream memoryStream = new MemoryStream())
    {
        // calculate blob download time
        DateTime start = DateTime.Now;
        blob.DownloadToStream(memoryStream);
        TimeSpan downloadTime = DateTime.Now.Subtract(start);

        // track how long the blob takes to download on this node
        // this will help debug timing issues or identify poorly performing nodes
        insightsClient.TrackMetric("Blob download in seconds", downloadTime.TotalSeconds, this.CommonProperties);

        memoryStream.Position = 0; //Reset the stream
        var sr = new StreamReader(memoryStream);
        var myStr = sr.ReadToEnd();
        string[] words = myStr.Split(' ');

        // log how many words were found in the text file
        insightsClient.TrackTrace(new TraceTelemetry(string.Format("Task {0}: Found {1} words", this.taskId, words.Length), SeverityLevel.Verbose));
        var topNWords =
            words.
                Where(word => word.Length > 0).
                GroupBy(word => word, (key, group) => new KeyValuePair<String, long>(key, group.LongCount())).
                OrderByDescending(x => x.Value).
                Take(numTopN).
                ToList();
        foreach (var pair in topNWords)
        {
            Console.WriteLine("{0} {1}", pair.Key, pair.Value);
        }

        // emit an event to track the completion of the task
        insightsClient.TrackEvent("Done counting words");
    }
}
Azure Batch 원격 분석 이니셜라이저 도우미
지정된 서버 및 인스턴스에 대한 원격 분석 데이터를 보고할 때 Application Insights는 기본값에 Azure VM 역할 및 VM 이름을 사용합니다. Azure Batch의 컨텍스트에서 이 예제에는 풀 이름 및 컴퓨팅 노드 이름을 대신 사용하는 방법을 보여줍니다. 원격 분석 이니셜라이저를 사용하여 기본값을 재정의합니다.
using Microsoft.ApplicationInsights.Channel;
using Microsoft.ApplicationInsights.Extensibility;
using System;
using System.Threading;

namespace Microsoft.Azure.Batch.Samples.TelemetryInitializer
{
    public class AzureBatchNodeTelemetryInitializer : ITelemetryInitializer
    {
        // Azure Batch environment variables
        private const string PoolIdEnvironmentVariable = "AZ_BATCH_POOL_ID";
        private const string NodeIdEnvironmentVariable = "AZ_BATCH_NODE_ID";

        private string roleInstanceName;
        private string roleName;

        public void Initialize(ITelemetry telemetry)
        {
            if (string.IsNullOrEmpty(telemetry.Context.Cloud.RoleName))
            {
                // override the role name with the Azure Batch Pool name
                string name = LazyInitializer.EnsureInitialized(ref this.roleName, this.GetPoolName);
                telemetry.Context.Cloud.RoleName = name;
            }

            if (string.IsNullOrEmpty(telemetry.Context.Cloud.RoleInstance))
            {
                // override the role instance with the Azure Batch Compute Node name
                string name = LazyInitializer.EnsureInitialized(ref this.roleInstanceName, this.GetNodeName);
                telemetry.Context.Cloud.RoleInstance = name;
            }
        }

        private string GetPoolName()
        {
            return Environment.GetEnvironmentVariable(PoolIdEnvironmentVariable) ?? string.Empty;
        }

        private string GetNodeName()
        {
            return Environment.GetEnvironmentVariable(NodeIdEnvironmentVariable) ?? string.Empty;
        }
    }
}
원격 분석 이니셜라이저를 사용하기 위해 TopNWordsSample 프로젝트의 ApplicationInsights.config 파일에 다음 항목이 포함됩니다.
<TelemetryInitializers>
    <Add Type="Microsoft.Azure.Batch.Samples.TelemetryInitializer.AzureBatchNodeTelemetryInitializer, Microsoft.Azure.Batch.Samples.TelemetryInitializer"/>
</TelemetryInitializers>
Application Insights 이진 파일을 포함하도록 작업 및 태스크를 업데이트합니다.
Application Insights가 컴퓨팅 노드에서 올바르게 실행되도록 이진 파일을 올바르게 배치합니다. 태스크가 실행될 때 다운로드되도록 필요한 이진 파일을 태스크의 리소스 파일 컬렉션에 추가합니다. 다음 코드 조각은 Job.cs의 코드와 비슷합니다.
먼저 업로드할 Application Insights 파일의 정적 목록을 만듭니다.
private static readonly List<string> AIFilesToUpload = new List<string>()
{
    // Application Insights config and assemblies
    "ApplicationInsights.config",
    "Microsoft.ApplicationInsights.dll",
    "Microsoft.AI.Agent.Intercept.dll",
    "Microsoft.AI.DependencyCollector.dll",
    "Microsoft.AI.PerfCounterCollector.dll",
    "Microsoft.AI.ServerTelemetryChannel.dll",
    "Microsoft.AI.WindowsServer.dll",

    // custom telemetry initializer assemblies
    "Microsoft.Azure.Batch.Samples.TelemetryInitializer.dll",
 };
...
다음으로 태스크에서 사용할 준비 파일을 만듭니다.
...
// create file staging objects that represent the executable and its dependent assembly to run as the task.
// These files are copied to every node before the corresponding task is scheduled to run on that node.
FileToStage topNWordExe = new FileToStage(TopNWordsExeName, stagingStorageAccount);
FileToStage storageDll = new FileToStage(StorageClientDllName, stagingStorageAccount);

// Upload Application Insights assemblies
List<FileToStage> aiStagedFiles = new List<FileToStage>();
foreach (string aiFile in AIFilesToUpload)
{
    aiStagedFiles.Add(new FileToStage(aiFile, stagingStorageAccount));
}
...
FileToStage 메서드는 로컬 디스크에서 Azure Storage BLOB으로 파일을 간편하게 업로드할 수 있게 해주는 코드 샘플의 도우미 함수입니다. 각 파일은 나중에 컴퓨팅 노드로 다운로드되어 태스크에 의해 참조됩니다.
마지막으로 작업에 태스크를 추가하고 필요한 Application Insights 이진 파일을 포함합니다.
...
// initialize a collection to hold the tasks that will be submitted in their entirety
List<CloudTask> tasksToRun = new List<CloudTask>(topNWordsConfiguration.NumberOfTasks);
for (int i = 1; i <= topNWordsConfiguration.NumberOfTasks; i++)
{
    CloudTask task = new CloudTask("task_no_" + i, String.Format("{0} --Task {1} {2} {3} {4}",
        TopNWordsExeName,
        string.Format("https://{0}.blob.core.windows.net/{1}",
            accountSettings.StorageAccountName,
            documents[i]),
        topNWordsConfiguration.TopWordCount,
        accountSettings.StorageAccountName,
        accountSettings.StorageAccountKey));

    //This is the list of files to stage to a container -- for each job, one container is created and
    //files all resolve to Azure Blobs by their name (so two tasks with the same named file will create just 1 blob in
    //the container).
    task.FilesToStage = new List<IFileStagingProvider>
                        {
                            // required application binaries
                            topNWordExe,
                            storageDll,
                        };
    foreach (FileToStage stagedFile in aiStagedFiles)
   {
        task.FilesToStage.Add(stagedFile);
   }
    task.RunElevated = false;
    tasksToRun.Add(task);
}
Azure Portal에서 데이터 보기
Application Insights를 사용하도록 작업 및 태스크를 구성했으니, 이제 풀의 예제 작업을 실행합니다. Azure Portal로 이동하여 이전에 프로비전한 Application Insights 리소스를 엽니다. 풀이 프로비전되면 데이터가 흐르고 기록되는 것을 볼 수 있습니다. 이 문서의 나머지 부분에서는 몇 가지 Application Insights 기능만 다루지만, 전체 기능 집합을 자유롭게 살펴보셔도 좋습니다.
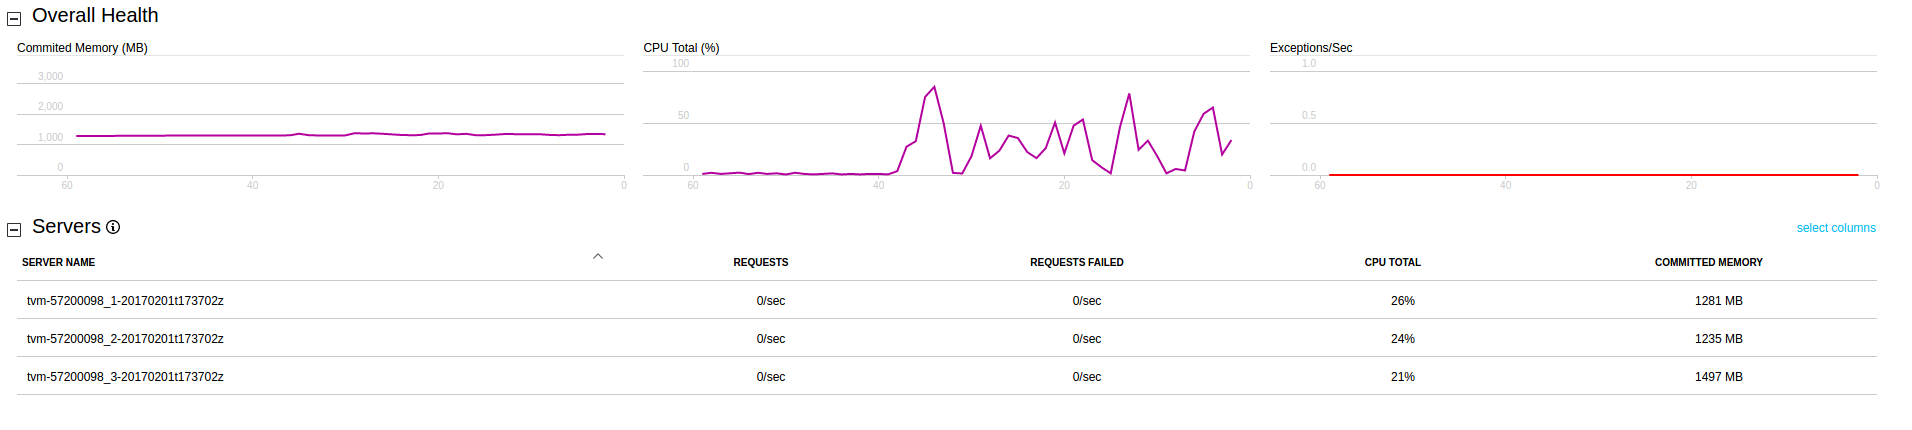
라이브 스트림 데이터 보기
Application Insights 리소스에서 추적 로그를 보려면 라이브 스트림을 클릭합니다. 다음 스크린샷은 풀의 컴퓨팅 노드에서 오는 라이브 데이터(예: 컴퓨팅 노드당 CPU 사용량)를 보는 방법을 보여줍니다.
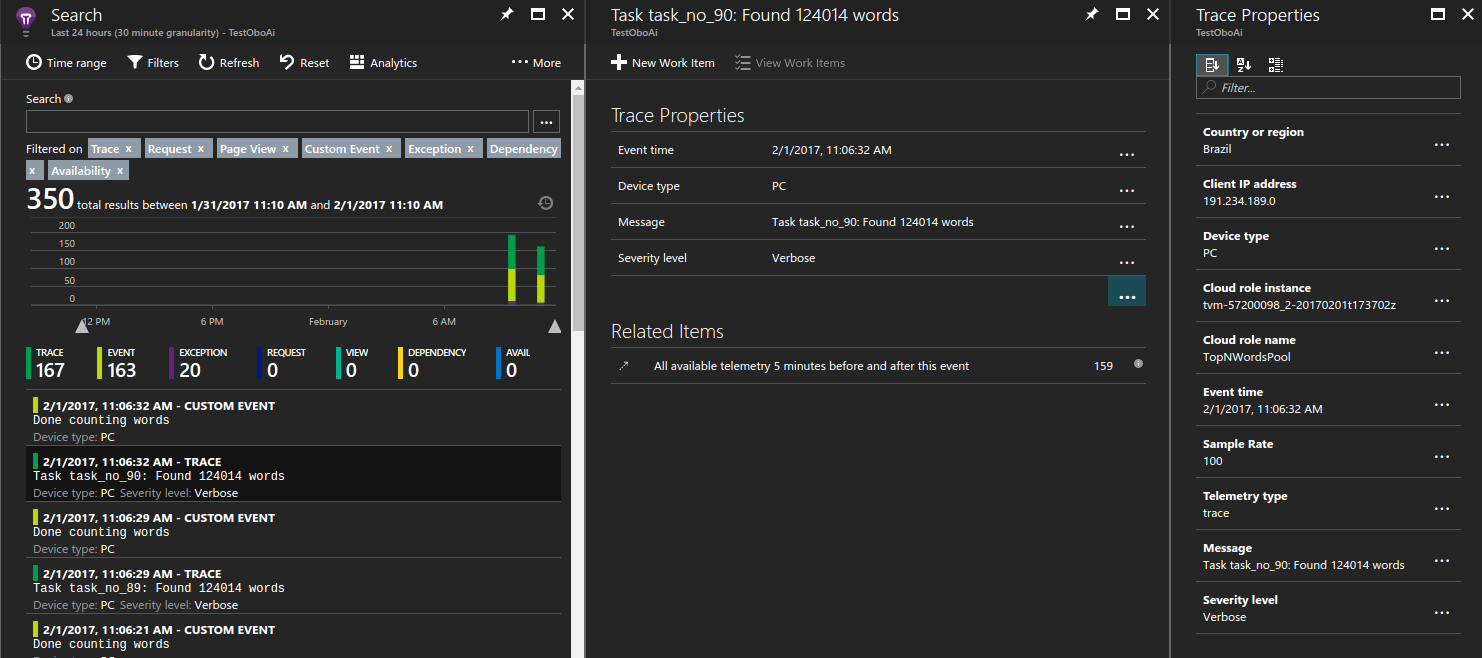
추적 로그 보기
Application Insights 리소스에서 추적 로그를 보려면 검색을 클릭합니다. 이 보기에는 추적, 이벤트 및 예외를 포함하여 Application Insights에서 캡처한 진단 데이터 목록이 표시됩니다.
다음 스크린샷은 태스크에 대한 단일 추적이 기록되고 나중에 디버깅을 위해 쿼리되는 원리를 보여줍니다.
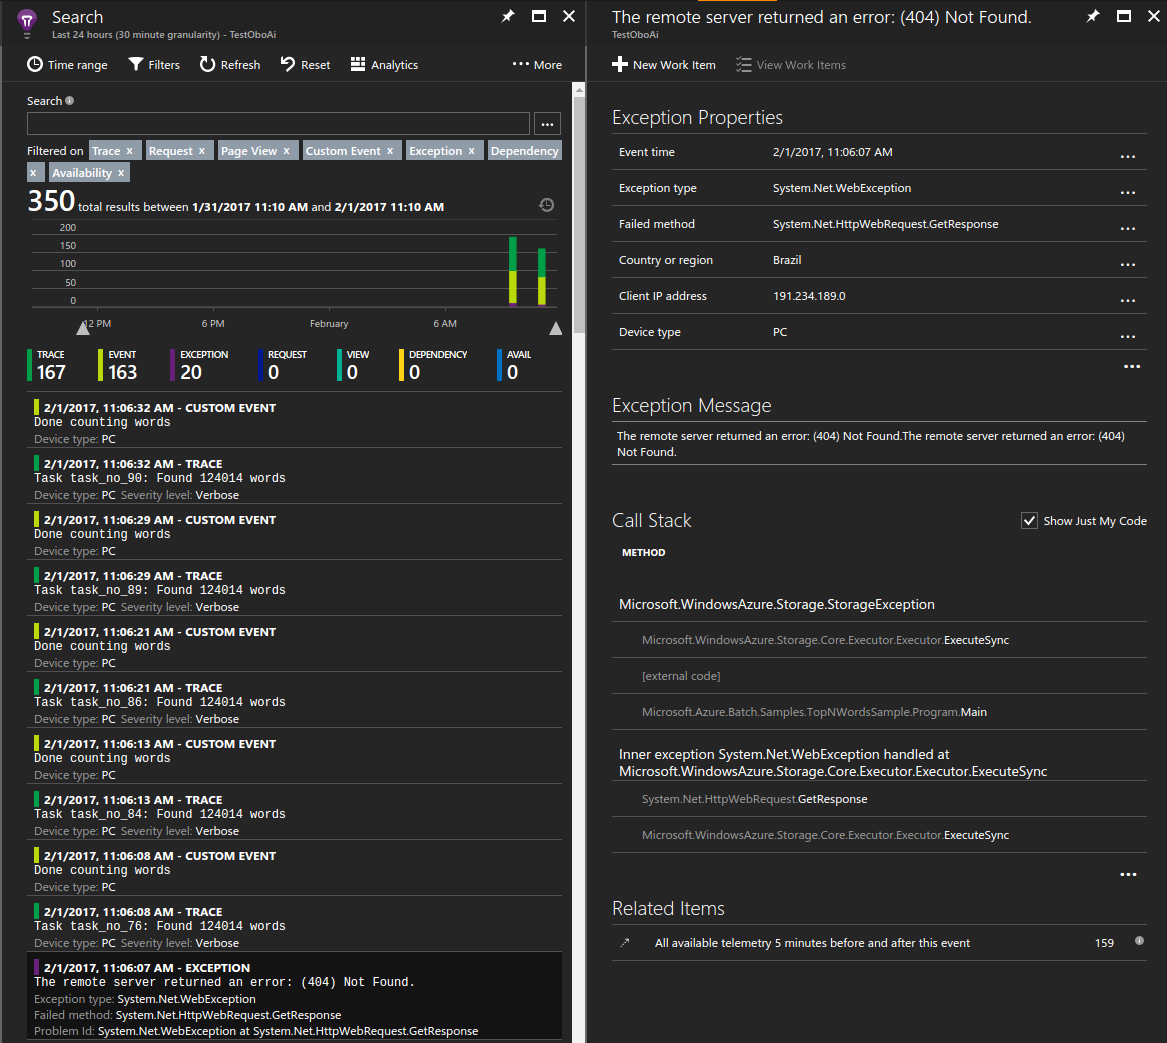
처리되지 않은 예외 보기
Application Insights는 애플리케이션에서 throw된 예외를 기록합니다. 이 예에서는 애플리케이션이 예외를 throw한 후 수 초 이내에 특정 예외를 자세히 들여다 보고 문제를 진단할 수 있습니다.
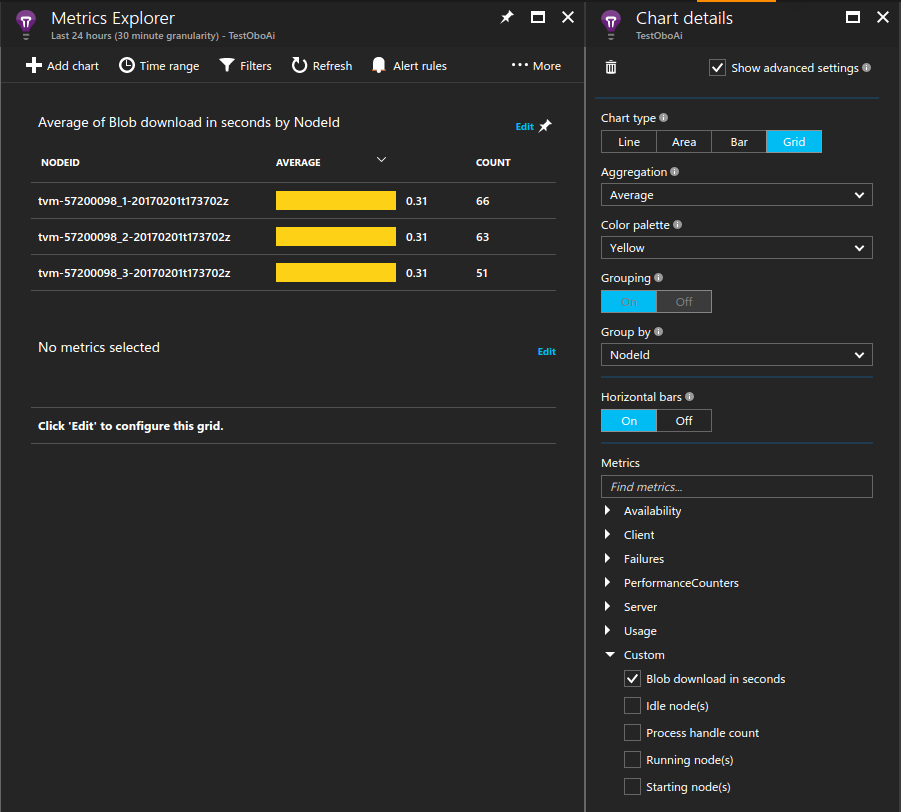
BLOB 다운로드 시간 측정
사용자 지정 메트릭도 포털의 유용한 도구입니다. 예를 들어 각 컴퓨팅 노드가 처리 중인 필수 텍스트 파일을 다운로드하는 데 걸린 평균 시간을 표시할 수 있습니다.
샘플 차트를 만들려면:
- Application Insights 리소스에서 메트릭 탐색기>차트 추가를 클릭합니다.
- 추가된 차트에서 편집을 클릭합니다.
- 다음과 같이 차트 세부 정보를 업데이트합니다.
- 차트 종류를 그리드로 설정합니다.
- 집계를 평균으로 설정합니다.
- 그룹화 기준을 NodeId로 설정합니다.
- 메트릭에서 사용자 지정>다음 시간(초) 후에 BLOB 다운로드를 선택합니다.
- 디스플레이 색상표를 원하는 대로 조정합니다.
컴퓨팅 노드를 지속적으로 모니터링
성능 카운터를 포함한 모든 메트릭은 태스크가 실행 중일 때만 기록된다는 것을 알고 계신 분도 있을 것입니다. 이 동작은 Application Insights가 기록하는 데이터 양을 제한하므로 유용합니다. 그러나 컴퓨팅 노드를 항상 모니터링하려는 경우가 있습니다. 예를 들어 Batch 서비스를 통해 예약되지 않는 백그라운드 작업을 실행 중일 수 있습니다. 이 경우 컴퓨팅 노드의 수명 동안 실행되는 모니터링 프로세스를 설정합니다.
이 동작을 획득하는 한 가지 방법은 Application Insights 라이브러리를 로드하고 백그라운드에서 실행되는 프로세스를 생성하는 것입니다. 예제에서는 시작 태스크가 컴퓨터에서 이진 파일을 로드하고 프로세스를 무기한 실행합니다. 이 프로세스가 성능 카운터처럼 사용자가 원하는 추가 데이터를 내보내도록 Application Insights 구성 파일을 구성합니다.
...
 // Batch start task telemetry runner
private const string BatchStartTaskFolderName = "StartTask";
private const string BatchStartTaskTelemetryRunnerName = "Microsoft.Azure.Batch.Samples.TelemetryStartTask.exe";
private const string BatchStartTaskTelemetryRunnerAIConfig = "ApplicationInsights.config";
...
CloudPool pool = client.PoolOperations.CreatePool(
    topNWordsConfiguration.PoolId,
    targetDedicated: topNWordsConfiguration.PoolNodeCount,
    virtualMachineSize: "standard_d1_v2",
    VirtualMachineConfiguration: new VirtualMachineConfiguration(
    imageReference: new ImageReference(
                        publisher: "MicrosoftWindowsServer",
                        offer: "WindowsServer",
                        sku: "2019-datacenter-core",
                        version: "latest"),
    nodeAgentSkuId: "batch.node.windows amd64");
...

// Create a start task which will run a dummy exe in background that simply emits performance
// counter data as defined in the relevant ApplicationInsights.config.
// Note that the waitForSuccess on the start task was not set so the Compute Node will be
// available immediately after this command is run.
pool.StartTask = new StartTask()
{
    CommandLine = string.Format("cmd /c {0}", BatchStartTaskTelemetryRunnerName),
    ResourceFiles = resourceFiles
};
...
팁
솔루션의 관리 효율성을 개선하려면 어셈블리를 애플리케이션 패키지에 번들화하면 됩니다. 그런 다음, 풀에 애플리케이션 패키지를 자동으로 배포하도록 풀 구성에 애플리케이션 패키지 참조를 추가합니다.
스로틀 및 샘플 데이터
프로덕션 환경에서 실행되는 Azure Batch 애플리케이션은 그 규모가 크기 때문에 비용 관리를 위해 Application Insights에서 수집하는 데이터 양을 제한할 수 있습니다. 자세한 메커니즘은 Application Insights의 샘플링을 참조하세요.
다음 단계
- Application Insights에 대해 자세히 알아봅니다.
- 다른 언어로 지원되는 Application Insights는 언어, 플랫폼 및 통합 설명서를 참조하세요.