Azure AI Health Bot Custom Telemetry
Azure AI Health Bot provides two types of reporting mechanisms. For out of the box functionality you can apply the built-in reports dashboard. However, for more flexibility, Azure AI Health Bot provides a custom telemetry integration with Application Insights.
For example, if your organization has specific business metrics that need to be measured or reporting requirements you can build out a custom dashboard with Application Insights and Power BI.
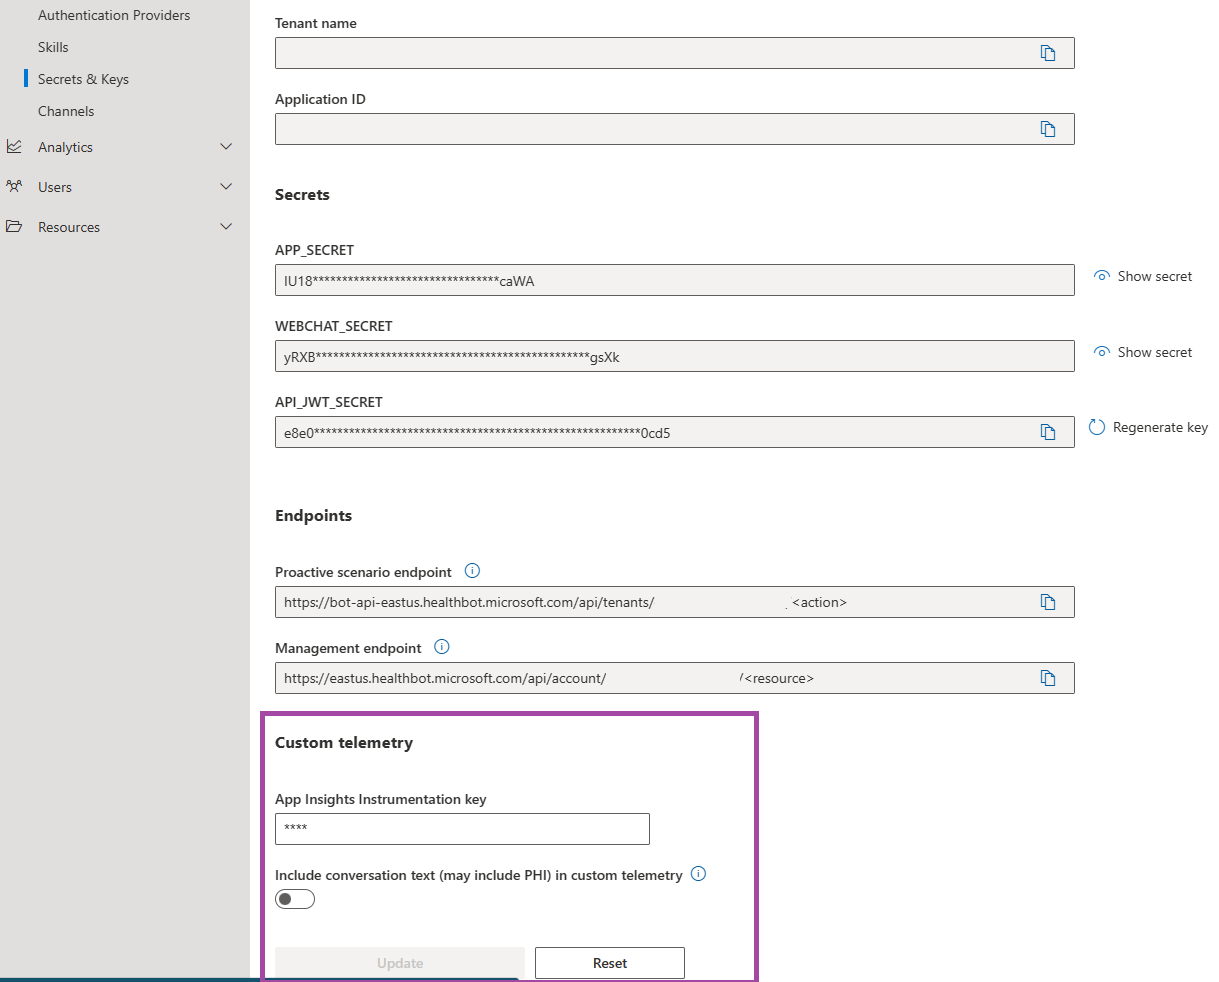
To enable custom telemetry you need to create an Application Insights Resource in your Azure Subscription. Access the Azure AI Health Bot Management portal and navigate to Integration > Secrets > Custom telemetry and provide the Application Insights Instrumentation key.
Custom Telemetry includes different types of events. Events are sent from the bot for all messages, built-in scenario and custom scenarios:
Utterances
- TopLevelUtterance
- UtteranceMisunderstanding
- Message
The Message event can include the message text that is sent between the bot and the end-user. This needs to be enabled separately, however you should be aware that the message text may include PHI provided by the end-user. Tenants are responsible for complying with any data privacy regulations applicable to data that is sent to your Application Insights account.
Custom Scenarios
- ScenarioOccurrence
- ScenarioStart
- ScenarioOutcome
- StepExecuted
The StepExecuted event fires on any Statement or Prompt step in the scenario. This event is good for isolating responses to a specific question in your flow or for identifying users that taken a specific path in the scenario decision tree. This event contains details such as the Step ID, Step Response (if conversation text is enabled) and the Step type.
Built-in Scenarios
- BuiltinDialogOccurrence (in all built-in dialogs)
- TriageStart
- TriageEnd
- TriageOutcome
Logging functions You can also fire events programatically from within action steps in the scenario flow. Use the following functions to trigger an outcome event or a custom event with any name and any payload. This can help to track scenario parameters you have collected during the scenario.
session.logCustomEvent(<eventName>, <eventPayload>)
session.logOutcomeEvent(<outcomeLabel>)
Errors and exceptions To assist with debugging your scenarios we also pipe runtime data including errors and warnings and exceptions into your Application Insights account.
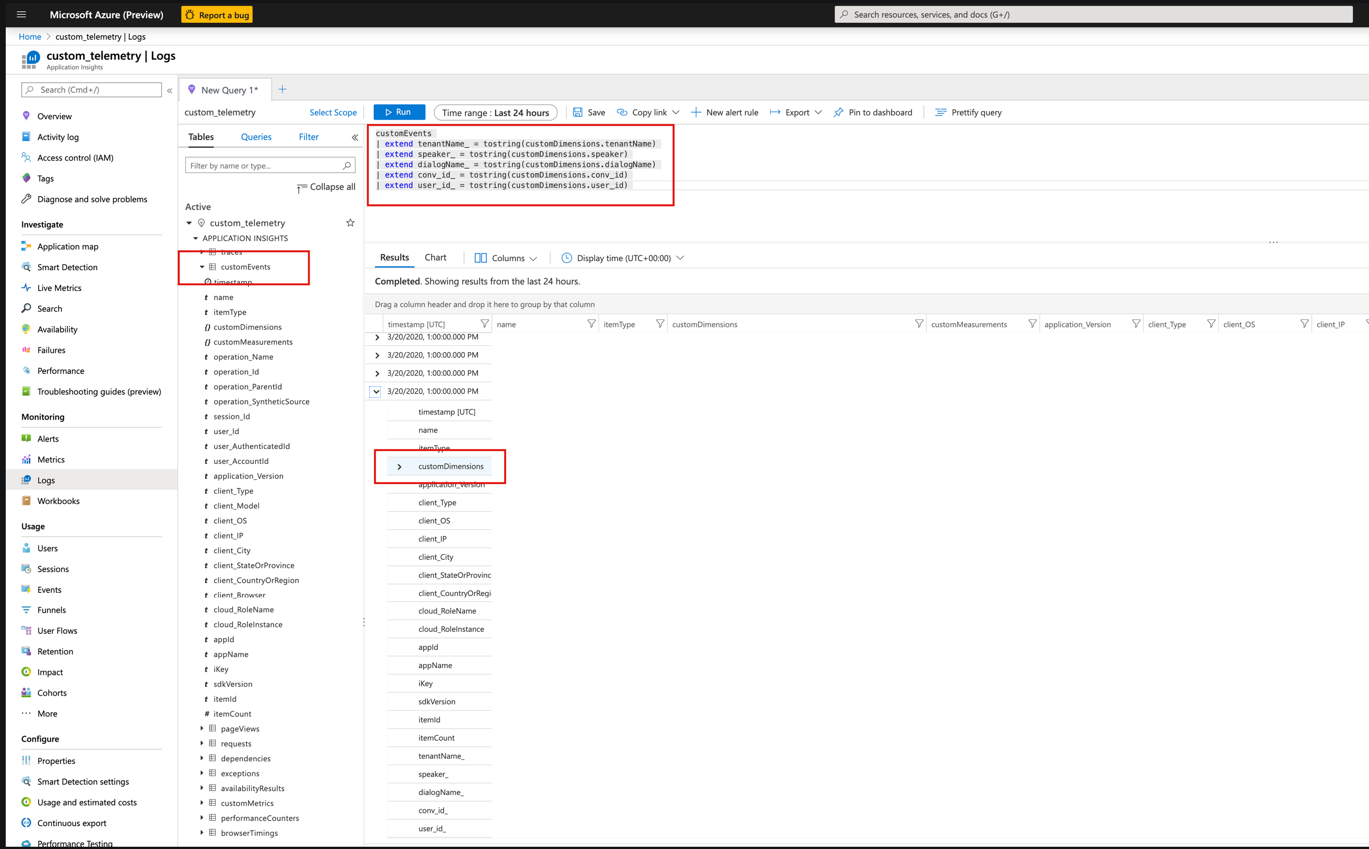
All the events and data are collected within the Custom Events table and event data can be found in the "Custom Dimensions" property. Depending on the type of event different data is collected. Most events include a Conversation ID and User ID so that you can follow the timeline for a specific conversation end to end according to the timestamps.
Collecting Insights
Once the data has been collected in Application Insights you can use different methods to analyze the data. For example, you can use log analytics to query the data in the Azure portal or Power BI to create visualizations.