Įvykiai
03-17 21 - 03-21 10
Prisijunkite prie meetup serijos, kad sukurtumėte keičiamo dydžio DI sprendimus, pagrįstus realaus pasaulio naudojimo atvejais, su kolegomis kūrėjais ir ekspertais.
Registruotis dabarŠi naršyklė nebepalaikoma.
Atnaujinkite į „Microsoft Edge“, kad pasinaudotumėte naujausiomis funkcijomis, saugos naujinimais ir techniniu palaikymu.
APPLIES TO: ![]() NoSQL
NoSQL
This article contains known causes and solutions for various 429 status code errors for the API for NoSQL. If you're using the API for MongoDB, see the Troubleshoot common issues in API for MongoDB article for how to debug status code 16500.
A "Request rate too large" exception, also known as error code 429, indicates that your requests against Azure Cosmos DB are being rate limited.
When you use provisioned throughput, you set the throughput measured in request units per second (RU/s) required for your workload. Database operations against the service such as reads, writes, and queries consume some number of request units (RUs). Learn more about request units.
In a given second, if the operations consume more than the provisioned request units, Azure Cosmos DB will return a 429 exception. Each second, the number of request units available to use is reset.
Before taking an action to change the RU/s, it's important to understand the root cause of rate limiting and address the underlying issue.
Arbatpinigiai
The guidance in this article applies to databases and containers using provisioned throughput - both autoscale and manual throughput.
There are different error messages that correspond to different types of 429 exceptions:
This is the most common scenario. It occurs when the request units consumed by operations on data exceed the provisioned number of RU/s. If you're using manual throughput, this occurs when you've consumed more RU/s than the manual throughput provisioned. If you're using autoscale, this occurs when you've consumed more than the maximum RU/s provisioned. For example, if you have a resource provisioned with manual throughput of 400 RU/s, you'll see 429 when you consume more than 400 request units in a single second. If you have a resource provisioned with autoscale max RU/s of 4000 RU/s (scales between 400 RU/s - 4000 RU/s), you'll see 429 responses when you consume more than 4000 request units in a single second.
Arbatpinigiai
All operations are charged based on the number of resources they consume. These charges are measured in request units. These charges include requests that do not complete successfully due to application errors such as 400, 412, 449, etc. While looking at throttling or usage, it is a good idea to investigate if some pattern has changed in your usage which would result in an increase of these operations. Specifically, check for tags 412 or 449 (actual conflict).
For more information about provisioned throughput, see provisioned throughput in Azure Cosmos DB.
Seeing 429 error messages doesn't necessarily mean there's a problem with your database or container. A small percentage of 429 responses is normal whether you're using manual or autoscale throughput, and is a sign that you're maximizing the RU/s you've provisioned.
Determine what percent of your requests to your database or container resulted in 429 responses, compared to the overall count of successful requests. From your Azure Cosmos DB account, navigate to Insights > Requests > Total Requests by Status Code. Filter to a specific database and container.
By default, the Azure Cosmos DB client SDKs and data import tools such as Azure Data Factory and bulk executor library automatically retry requests on 429s. They retry typically up to nine times. As a result, while you may see 429 responses in the metrics, these errors may not even have been returned to your application.

In general, for a production workload, if you see between 1-5% of requests with 429 responses, and your end to end latency is acceptable, this is a healthy sign that the RU/s are being fully utilized. No action is required. Otherwise, move to the next troubleshooting steps.
Svarbu
This 1-5% range is assuming that your account partitions are evenly distributed. If your partitions are not evenly distributed, your problem partition may return a large amount of 429 errors while the overall rate may be low.
If you're using autoscale, it's possible to see 429 responses on your database or container, even if the RU/s wasn't scaled to the maximum RU/s. See the section Request rate is large with autoscale for an explanation.
One common question that arises is, "Why am I seeing 429 responses in the Azure Monitor metrics, but none in my own application monitoring?" If Azure Monitor Metrics show you have 429 responses, but you've not seen any in your own application, this is because by default, the Azure Cosmos DB client SDKs automatically retried internally on the 429 responses and the request succeeded in subsequent retries. As a result, the 429 status code isn't returned to the application. In these cases, the overall rate of 429 responses is typically minimal and can be safely ignored, assuming the overall rate is between 1-5% and end to end latency is acceptable to your application.
A hot partition arises when one or a few logical partition keys consume a disproportionate amount of the total RU/s due to higher request volume. This can be caused by a partition key design that doesn't evenly distribute requests. It results in many requests being directed to a small subset of logical (which implies physical) partitions that become "hot." Because all data for a logical partition resides on one physical partition and total RU/s is evenly distributed among the physical partitions, a hot partition can lead to 429 responses and inefficient use of throughput.
Here are some examples of partitioning strategies that lead to hot partitions:
date. All data for a single date will reside on the same logical and physical partition. Because all the data written each day has the same date, this would result in a hot partition every day.
id (either a GUID or device ID), or a synthetic partition key combining id and date would yield a higher cardinality of values and better distribution of request volume.tenantId. If one tenant is much more active than the others, it results in a hot partition. For example, if the largest tenant has 100,000 users, but most tenants have fewer than 10 users, you'll have a hot partition when partitioned by tenantID.
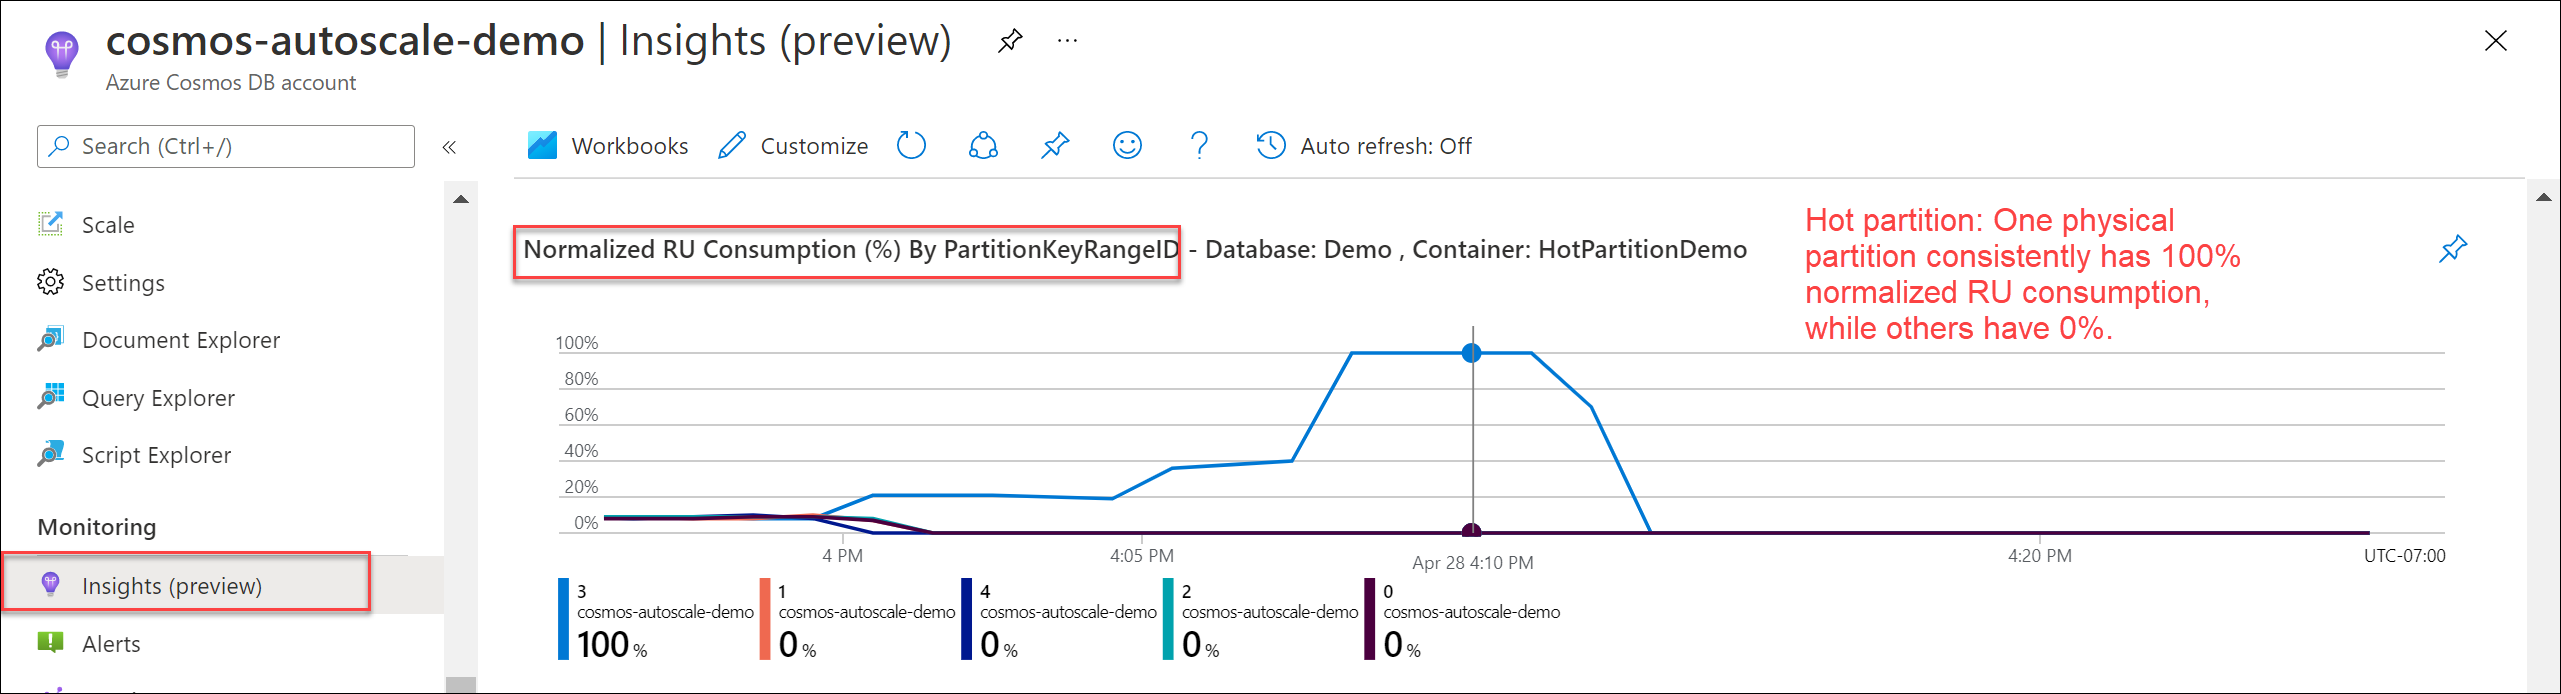
UserId.To verify if there's a hot partition, navigate to Insights > Throughput > Normalized RU Consumption (%) By PartitionKeyRangeID. Filter to a specific database and container.
Each PartitionKeyRangeId maps to one physical partition. If there's one PartitionKeyRangeId that has much higher Normalized RU consumption than others (for example, one is consistently at 100%, but others are at 30% or less), this can be a sign of a hot partition. Learn more about the Normalized RU Consumption metric.
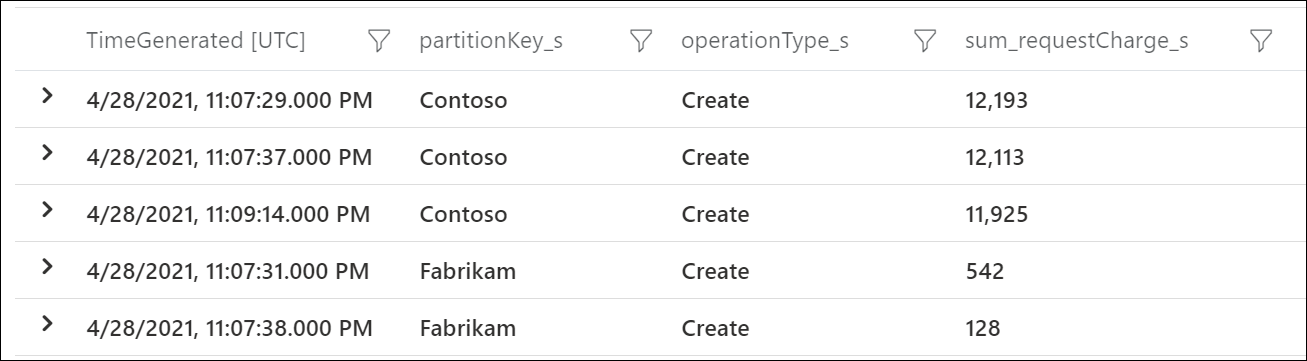
To see which logical partition keys are consuming the most RU/s, use Azure Diagnostic Logs. This sample query sums up the total request units consumed per second on each logical partition key.
Svarbu
Enabling diagnostic logs incurs a separate charge for the Log Analytics service, which is billed based on the volume of data ingested. It's recommended you turn on diagnostic logs for a limited amount of time for debugging, and turn off when no longer required. See pricing page for details.
 CDBPartitionKeyRUConsumption
 | where TimeGenerated >= ago(24hour)
 | where CollectionName == "CollectionName"
 | where isnotempty(PartitionKey)
 // Sum total request units consumed by logical partition key for each second
 | summarize sum(RequestCharge) by PartitionKey, OperationName, bin(TimeGenerated, 1s)
 | order by sum_RequestCharge desc
This sample output shows that in a particular minute, the logical partition key with value "Contoso" consumed around 12,000 RU/s, while the logical partition key with value "Fabrikam" consumed less than 600 RU/s. If this pattern was consistent during the time period where rate limiting occurred, this would indicate a hot partition.
Arbatpinigiai
In any workload, there will be natural variation in request volume across logical partitions. You should determine if the hot partition is caused by a fundamental skewness due to choice of partition key (which may require changing the key) or temporary spike due to natural variation in workload patterns.
Review the guidance on how to chose a good partition key.
If there's high percent of rate limited requests and no hot partition:
If there's high percent of rate limited requests and there's an underlying hot partition:
Arbatpinigiai
When you increase the throughput, the scale-up operation will either complete instantaneously or require up to 5-6 hours to complete, depending on the number of RU/s you want to scale up to. If you want to know the highest number of RU/s you can set without triggering the asynchronous scale-up operation (which requires Azure Cosmos DB to provision more physical partitions), multiply the number of distinct PartitionKeyRangeIds by 10,0000 RU/s. For example, if you have 30,000 RU/s provisioned and 5 physical partitions (6000 RU/s allocated per physical partition), you can increase to 50,000 RU/s (10,000 RU/s per physical partition) in an instantaneous scale-up operation. Increasing to >50,000 RU/s would require an asynchronous scale-up operation. Learn more about best practices for scaling provisioned throughput (RU/s).
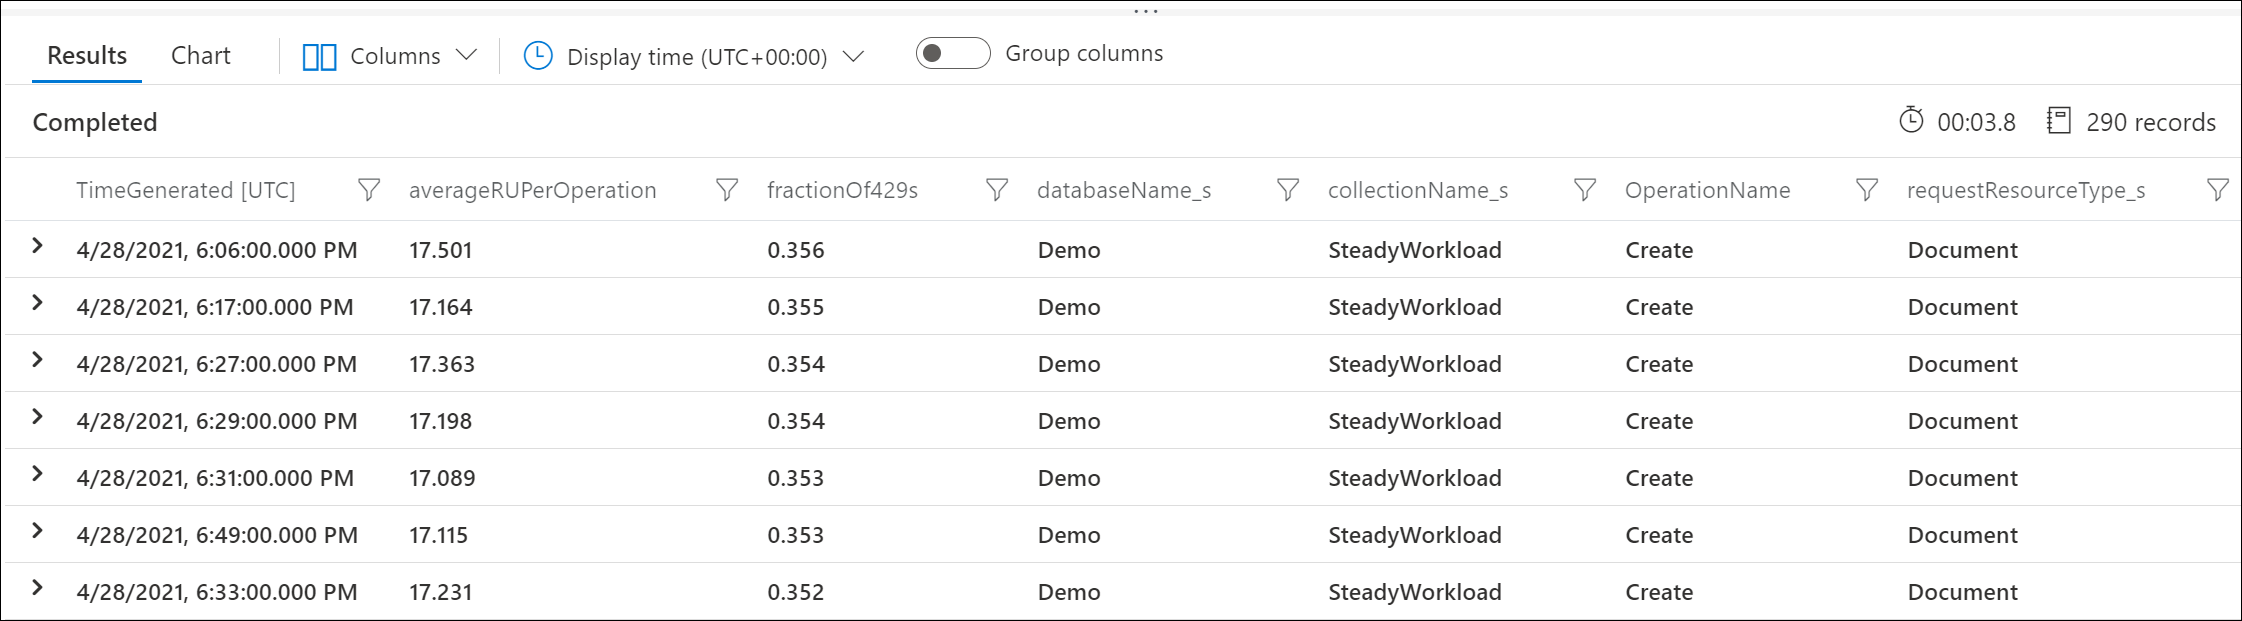
Use Azure Diagnostic Logs to identify which requests are returning 429 responses and how many RUs they consumed. This sample query aggregates at the minute level.
Svarbu
Enabling diagnostic logs incurs a separate charge for the Log Analytics service, which is billed based on volume of data ingested. It is recommended you turn on diagnostic logs for a limited amount of time for debugging, and turn off when no longer required. See pricing page for details.
 CDBDataPlaneRequests
 | where TimeGenerated >= ago(24h)
 | summarize throttledOperations = dcountif(ActivityId, StatusCode == 429), totalOperations = dcount(ActivityId), totalConsumedRUPerMinute = sum(RequestCharge) by DatabaseName, CollectionName, OperationName, RequestResourceType, bin(TimeGenerated, 1min)
 | extend averageRUPerOperation = 1.0 * totalConsumedRUPerMinute / totalOperations
 | extend fractionOf429s = 1.0 * throttledOperations / totalOperations
 | order by fractionOf429s desc
For example, this sample output shows that each minute, 30% of Create Document requests were being rate limited, with each request consuming an average of 17 RUs.
You can use the Azure Cosmos DB capacity planner to understand what is the best provisioned throughput based on your workload (volume and type of operations and size of documents). You can customize further the calculations by providing sample data to get a more accurate estimation.
All the guidance in this article applies to both manual and autoscale throughput.
When using autoscale, a common question that arises is, "Is it still possible to see 429 responses with autoscale?"
Yes. There are two main scenarios where this can occur.
Scenario 1: When the overall consumed RU/s exceeds the max RU/s of the database or container, the service will throttle requests accordingly. This is analogous to exceeding the overall manual provisioned throughput of a database or container.
Scenario 2: If there's a hot partition, that is, a logical partition key value that has a disproportionately higher amount of requests compared to other partition key values, it is possible for the underlying physical partition to exceed its RU/s budget. As a best practice, to avoid hot partitions, choose a good partition key that results in an even distribution of both storage and throughput. This is similar to when there's a hot partition when using manual throughput.
For example, if you select the 20,000 RU/s max throughput option and have 200 GB of storage with four physical partitions, each physical partition can be autoscaled up to 5000 RU/s. If there was a hot partition on a particular logical partition key, you'll see 429 responses when the underlying physical partition it resides in exceeds 5000 RU/s, that is, exceeds 100% normalized utilization.
Follow the guidance in Step 1, Step 2, and Step 3 to debug these scenarios.
Another common question that arises is, Why is normalized RU consumption 100%, but autoscale didn't scale to the max RU/s?
This typically occurs for workloads that have temporary or intermittent spikes of usage. When you use autoscale, Azure Cosmos DB only scales the RU/s to the maximum throughput when the normalized RU consumption is 100% for a sustained, continuous period of time in a 5-second interval. This is done to ensure the scaling logic is cost friendly to the user, as it ensures that single, momentary spikes to not lead to unnecessary scaling and higher cost. When there are momentary spikes, the system typically scales up to a value higher than the previously scaled to RU/s, but lower than the max RU/s. Learn more about how to interpret the normalized RU consumption metric with autoscale.
Metadata rate limiting can occur when you're performing a high volume of metadata operations on databases and/or containers. Metadata operations include:
There's a system-reserved RU limit for these operations, so increasing the provisioned RU/s of the database or container will have no impact and isn't recommended. See Control Plane Service Limits.
Navigate to Insights > System > Metadata Requests By Status Code. Filter to a specific database and container if desired.

If your application needs to perform metadata operations, consider implementing a backoff policy to send these requests at a lower rate.
Use static Azure Cosmos DB client instances. When the DocumentClient or CosmosClient is initialized, the Azure Cosmos DB SDK fetches metadata about the account, including information about the consistency level, databases, containers, partitions, and offers. This initialization may consume a high number of RUs, and should be performed infrequently. Use a single DocumentClient instance and use it for the lifetime of your application.
Cache the names of databases and containers. Retrieve the names of your databases and containers from configuration or cache them on start. Calls like ReadDatabaseAsync/ReadDocumentCollectionAsync or CreateDatabaseQuery/CreateDocumentCollectionQuery will result in metadata calls to the service, which consume from the system-reserved RU limit. These operations should be performed infrequently.
This 429 error is returned when the request encounters a transient service error. Increasing the RU/s on the database or container will have no impact and isn't recommended.
Retry the request. If the error persists for several minutes, file a support ticket from the Azure portal.
Įvykiai
03-17 21 - 03-21 10
Prisijunkite prie meetup serijos, kad sukurtumėte keičiamo dydžio DI sprendimus, pagrįstus realaus pasaulio naudojimo atvejais, su kolegomis kūrėjais ir ekspertais.
Registruotis dabarMokymas
Modulis
Monitor responses and events in Azure Cosmos DB for NoSQL - Training
We will learn to use a rich set of REST response codes returned by Azure Cosmos DB request to help you analyze potential issues.
Sertifikatas
Microsoft Certified: Azure Cosmos DB Developer Specialty - Certifications
Write efficient queries, create indexing policies, manage, and provision resources in the SQL API and SDK with Microsoft Azure Cosmos DB.