Notikumi
Veidojiet inteliģentas lietotnes
17. marts 21 - 21. marts 10
Pievienojieties meetup sērijai, lai kopā ar citiem izstrādātājiem un ekspertiem izveidotu mērogojamus AI risinājumus, kuru pamatā ir reālas lietošanas gadījumi.
Reģistrēties tūlītŠī pārlūkprogramma vairs netiek atbalstīta.
Jauniniet uz Microsoft Edge, lai izmantotu jaunāko līdzekļu, drošības atjauninājumu un tehniskā atbalsta sniegtās priekšrocības.
Azure DevOps Services | Azure DevOps Server 2022 - Azure DevOps Server 2019
In this article, learn how to establish a seamless connection between Power BI and Azure DevOps by using Data Connector. This integration allows you to extract valuable insights from your Azure DevOps data and create compelling reports within Power BI. Power BI Data Connector uses Analytics views.
Svarīgi
Analytics views only support Azure Boards data (work items). Analytics views don't support other data types, such as pipelines. Views provide a flat-list of work items and don't support work item hierarchies. At this point, we have no plans to update the connector to support other types of data. For information on other approaches, see About Power BI integration.
| Category | Requirements |
|---|---|
| Access levels | - Project member. - At least Basic access. |
| Permissions | Analytics permissions. If you're a member of the Contributors group for the project, you have permission. |
| Tools | - Azure Boards enabled - Power BI Desktop |
| Tasks | - Familiarity with What is Analytics and the knowledge base of Power BI articles. - Create an Analytics view that you want to create a Power BI report. |
| Category | Requirements |
|---|---|
| Access levels | - Project member. - At least Basic access. |
| Permissions | Analytics permissions. If you're a member of the Contributors group for the project, you have permission. |
| Tools | - Analytics installed and enabled. Account owners or a members of the Project Collection Administrators group can add extensions or enable the service. - Azure Boards enabled - Power BI Desktop |
| Tasks | - Familiarity with What is Analytics and the knowledge base of Power BI articles. - Create an Analytics view that you want to create a Power BI report. |
Svarīgi
Azure DevOps doesn't support Alternate Credentials authentication. If you're still using Alternate Credentials, we strongly encourage you to switch to a more secure authentication method.
Open Power BI Desktop.
Sign in to the service. First-time access requires you to sign in and have your credentials authenticated. Power BI Desktop saves your credentials so you only have to do so once.
Piezīme
Azure DevOps doesn't support cross-tenant scenarios using OAuth. Instead, use service principals and managed identities.
Select Connect upon verification of your credentials.

Select Get Data > Online Services, then select Azure DevOps (Boards only) for cloud services or select Azure DevOps Server (Boards only) for on-premises. Select Connect. Analytics views only support queries against work items and test cases.

Specify the basic parameters to connect to your data.


http://fabrikam-server/AzureDevOpsServer/fabrikam-collection.http://fabrikam-server/AzureDevOpsServer/fabrikam-collection/Fabrikam-Fiber.Svarīgi
Don't confuse the team name with the project name, which is a common mistake. For example, if the URL that you use is http://fabrikam-server/AzureDevOpsServer/fabrikam-collection/Fabrikam-Fiber-Git/Device, then Fabrikam-Fiber-Git is the project name and Device is the team name.
After successful sign-in, Power BI verifies that your user credentials have permissions to access the specified project. If any errors arise, see the FAQs for solutions to the most common problems.
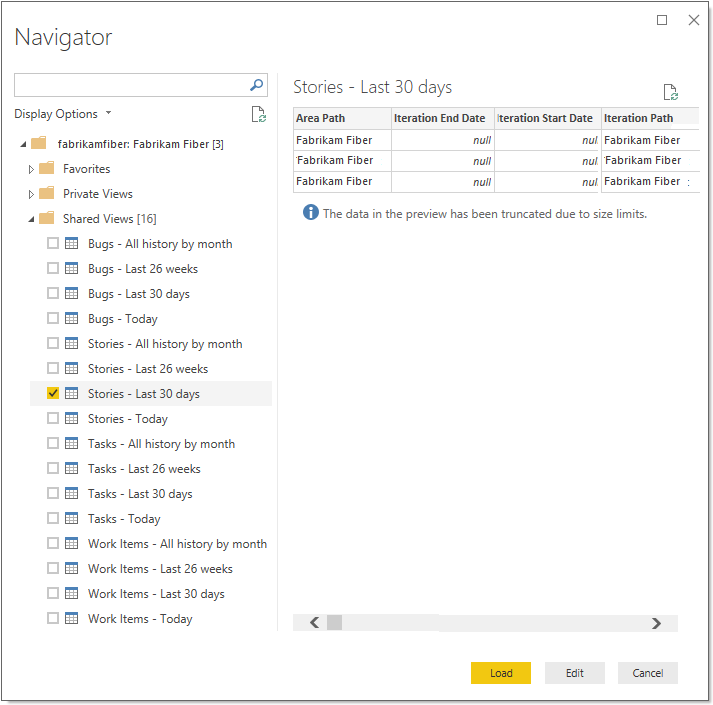
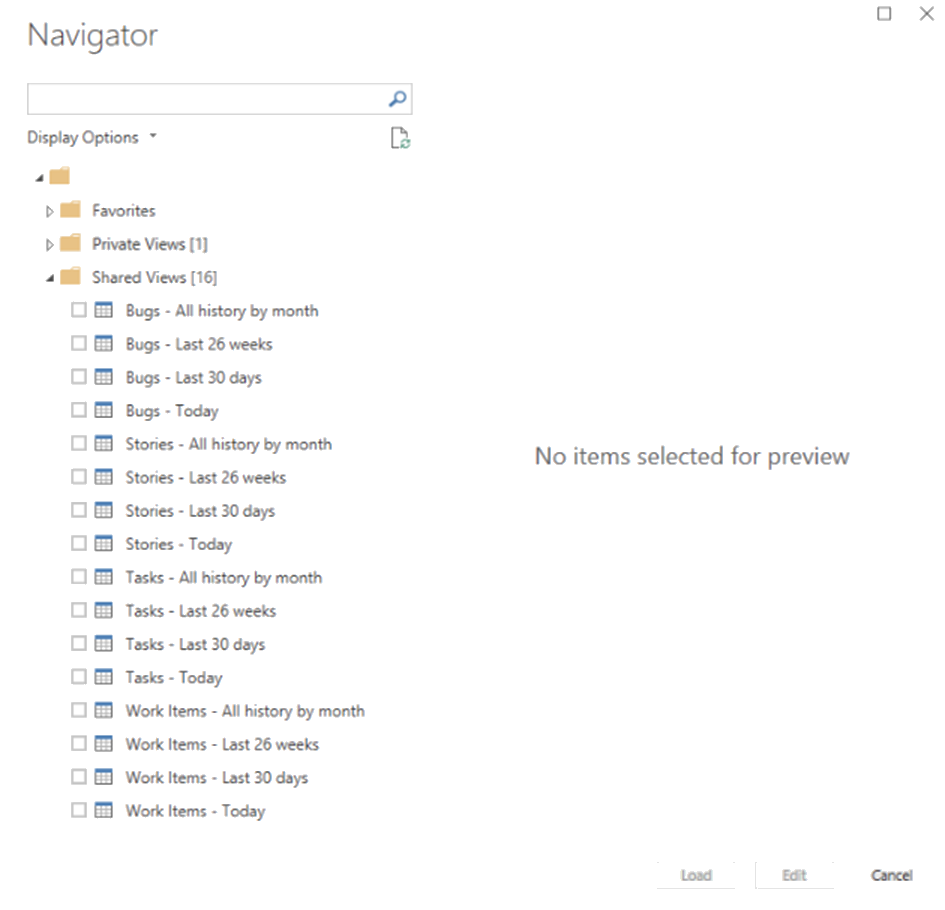
Expand the Shared Views folder, select an Analytics view, and then select Load. The Data Connector presents a list of available Analytics views. Each view represents a set of data that you can pull into Power BI. You can also create custom Analytics views.
The following image shows the default Analytics views. Your list of views might differ based on the process model used to create your project. All views listed, except the views appended with "Today," provide historical trend data.
In the following example, we select Stories - Last 30 days, which filters for product backlog items.
Piezīme
Because you verified the view in the previous section, the view should load. If the view doesn't load, it's most likely because the dataset is too large. Return to the view under the Analytics view in the web portal and adjust the filters to decrease the size of the dataset.
Select the view.
Piezīme
The preview shown for any selected views in the navigator can be truncated depending on the number of fields selected and the size of the dataset. The data is truncated only for the preview and won't affect the full data refresh.
Piezīme
Analytics views don't apply filters defined by using Power BI on the server. Any filters applied in Power BI limit the data shown to end users but don't reduce the amount of data retrieved from Analytics. If the filter is intended to reduce the size of the dataset, apply it by customizing the view.
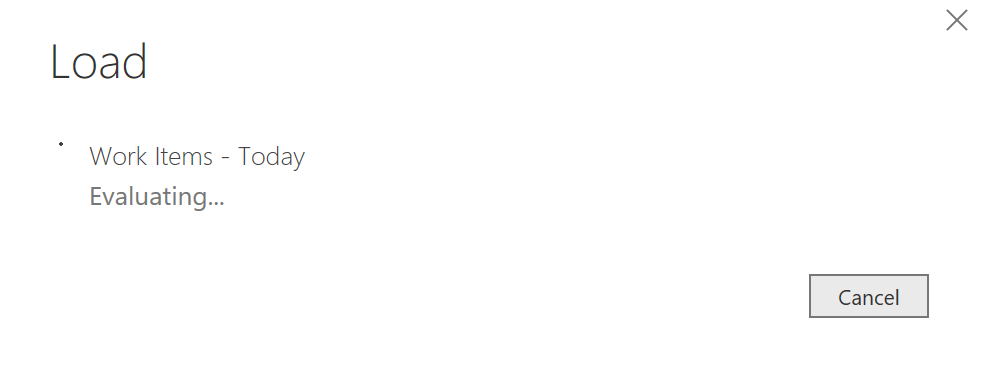
Wait for the data to load. You can observe its progress by looking at the status messages, which appear directly under the table name. If you see any errors, see the FAQs section for solutions to the most common problems.
Review the Data model. While the model loads, review the dataset design for the Power BI Data Connector.
Create a report based on the loaded data. After the load operation finishes, you can explore the data by creating custom reports. For examples of common reports, see Data Connector - Example reports.

Find answers to common questions about Power BI Data Connector and Analytics error messages.
A: You might feel challenged reading error messages coming from the connector because they typically contain extra contextual information. If the load operation fails, then the message starts with "Failed to save modifications to the server...". When you see it, search for [DataSource.Error] Azure DevOps...:. The following example shows the error message returned from the connector. The most important part of the error message is "Query result exceeds maximum size. Reduce the number of records by applying additional filters."

A: You get the following error if the number of records retrieved from Analytics exceeds 250,000:
"Failed to save modifications to the server. Error returned: 'OLE DB or ODBC error: [DataSource.Error] VSTS: Request failed: The remote server returned an error: (400) Bad Request. (Query result exceeds maximum size. Reduce the number of records by applying additional filters).'"
This error typically occurs when your project has a large number of work items. Reduce the size of the dataset by customizing the view. Do this step before you use it in Power BI.
A: You might get this error if you try to access a project that you don't have permissions to. You might also see it if Power BI doesn't recognize your credentials. To check your permissions, see Set permissions to access Analytics and Analytics views. If it's a credential issue, work with your administrator to see if they can help resolve the problem. For more information, see Power BI security, user authentication, and Troubleshooting sign-in issues for Power BI.

Piezīme
Power BI uses Microsoft Entra ID to authenticate users who sign in to the Power BI service, and in turn, uses the Power BI sign-in credentials whenever a user attempts to access resources that require authentication. Users sign in to the Power BI service by using the email address used to establish their Power BI account. Power BI uses that sign-in email as the effective username, which is passed to resources whenever a user attempts to connect to data. The effective username is then mapped to a user principal name and resolved to the associated Windows domain account, against which authentication is applied.
A: You might get this error if you have access to a specific project but you don't have the View analytics permissions. Work with your project administrator to get these permissions. For more information about the security model, see Analytics security.

A: This error indicates that the value you entered for Project name doesn't correspond to any project. A common mistake that users make is to confuse the project name with a team name.
For example, if the URL you use is https://dev.azure.com/fabrikam-fiber-inc/Fabrikam-Fiber-Git/Device, then Fabrikam-Fiber-Git is the project name and it should be used in the parameter. Device is the team name.

Notikumi
Veidojiet inteliģentas lietotnes
17. marts 21 - 21. marts 10
Pievienojieties meetup sērijai, lai kopā ar citiem izstrādātājiem un ekspertiem izveidotu mērogojamus AI risinājumus, kuru pamatā ir reālas lietošanas gadījumi.
Reģistrēties tūlītApmācība
Mācību ceļš
Use advance techniques in canvas apps to perform custom updates and optimization - Training
Use advance techniques in canvas apps to perform custom updates and optimization
Sertifikācija
Microsoft Certified: Power BI Data Analyst Associate - Certifications
Demonstrate methods and best practices that align with business and technical requirements for modeling, visualizing, and analyzing data with Microsoft Power BI.