View the call stack and use the Call Stack window in the debugger
By using the Call Stack window, you can view the function or procedure calls that are currently on the stack. The Call Stack window shows the order in which methods and functions are getting called. The call stack is a good way to examine and understand the execution flow of an app.
When debugging symbols are not available for part of a call stack, the Call Stack window might not be able to display correct information for that part of the call stack, displaying instead:
[Frames below may be incorrect and/or missing, no symbols loaded for name.dll]
Note
The dialog boxes and menu commands you see might differ from those described here, depending on your active settings or edition. To change your settings, select Import and Export Settings on the Tools menu. See Reset all settings. The Call Stack window is similar to the Debug perspective in some IDEs like Eclipse.
View the call stack while in the debugger
While debugging, in the Debug menu, select Windows > Call Stack or press ctrl+alt+C.
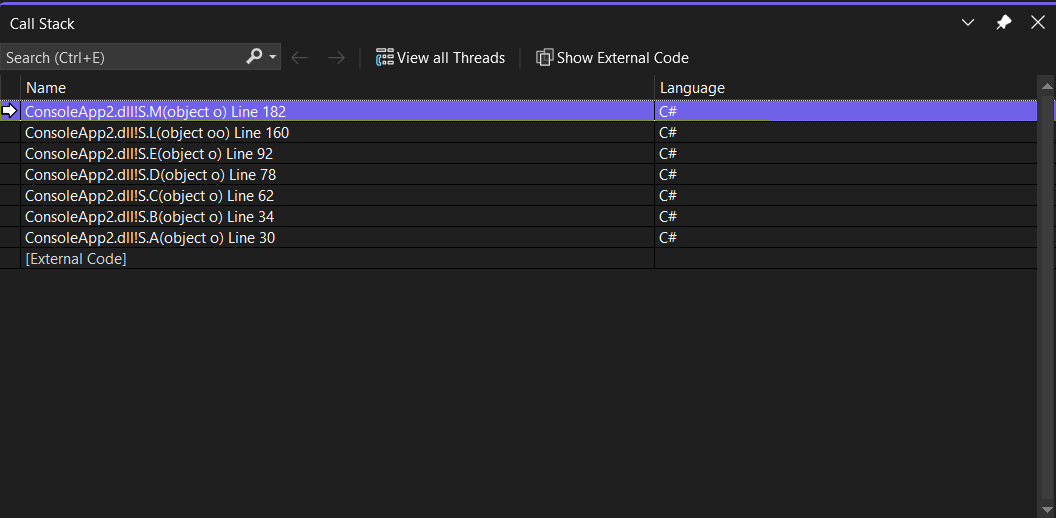 A arrow identifies the stack frame where the execution pointer is currently located. By default, this stack frame's information appears in the source, Locals, Autos, Watch, and Disassembly windows. To change the debugger context to another frame on the stack, switch to another stack frame.
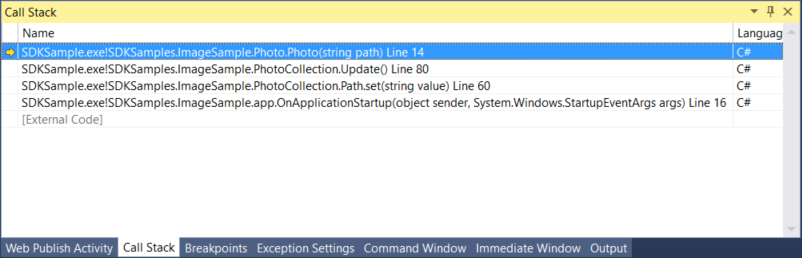
A yellow arrow identifies the stack frame where the execution pointer is currently located. By default, this stack frame's information appears in the source, Locals, Autos, Watch, and Disassembly windows. To change the debugger context to another frame on the stack, switch to another stack frame.
You can also view exception stack frames in the call stack while debugging. For more information, see View the call stack in the Exception helper.
Display non-user code in the Call Stack window
To display external or non-user code toggle the Show External code right-click on the Call Stack window and select Show External Code.
To display external or non-user code, toggle the Show External Code button from the call stack toolbar or right-click on the Call Stack window and select Show External Code.
Non-user code is any code that is not shown when Just My Code is enabled. In managed code, non-user code frames are hidden by default. The following notation appears in place of the non-user code frames:
[<External Code>]
Switch to another stack frame (change the debugger context)
In the Call Stack window, right-click the stack frame whose code and data that you want to view.
Or, you can double-click a frame in the Call Stack window to switch to that frame.
Select Switch to Frame.
A green arrow with a curly tail appears next to the stack frame you selected. The execution pointer remains in the original frame, which is still marked with the yellow arrow. If you select Step or Continue from the Debug menu, execution will continue in the original frame, not the frame you selected.
View all related threads
Toggle the View all threads button to see all the related threads in the Parallel Stack window.
Call Stack Search
You can search for relevant call stack frames by typing relevant search terms in the search box located in the top left corner of the call stack window. The pertinent call stack frames will get highlighted.
View the source code for a function on the call stack
In the Call Stack window, right-click the function whose source code you want to see and select Go To Source Code.
Run to a specific function from the Call Stack window
In the Call Stack window, select the function, right-click, and then choose Run to Cursor.
Set a breakpoint on the exit point of a function call
See Set a breakpoint at a call stack function.
Display calls to or from another thread
Right-click the Call Stack window and select Include Calls To/From Other Threads.
Visually trace the call stack
In Visual Studio Enterprise (only), you can view code maps for the call stack while debugging.
In the Call Stack window, open the shortcut menu. Choose Show Call Stack on Code Map (Ctrl + Shift + `).
For more information, see Map methods on the call stack while debugging.

View the disassembly code for a function on the call stack (C#, C++, Visual Basic, F#)
In the Call Stack window, right-click the function whose disassembly code you want to see and select Go To Disassembly.
Change the optional information displayed
Right-click in the Call Stack window and set or clear Show <the information that you want>.
Autodecompile .NET external code
Starting in Visual Studio 2022 version 17.7, you can autodecompile .NET code by double-clicking external code in the Call Stack window. For more information, see Generate source code from .NET assemblies while debugging.
Load symbols for a module (C#, C++, Visual Basic, F#)
In the Call Stack window, you can load debugging symbols for code that doesn't currently have symbols loaded. These symbols can be .NET or system symbols downloaded from the Microsoft public symbol servers, or symbols in a symbol path on the computer that you're debugging.
See Specify symbol (.pdb) and source files.
To load symbols
In the Call Stack window, right-click the stack frame for which symbols are not loaded. The frame will be dimmed.
Point to Load Symbols and then select Microsoft Symbol Servers (if available), or browse to the symbol path.
To set the symbol path
In the Call Stack window, choose Symbol Settings from the shortcut menu.
The Options dialog box opens and the Symbols page is displayed.
Select Symbol Settings.
In the Options dialog box, click the Folder icon.
In the Symbol file (.pdb) locations box, a cursor appears.
Enter a directory pathname to the symbol location on the computer that you're debugging. For local and remote debugging, this is a path on your local computer.
Select OK to close the Options dialog box.
Related content
Feedback
Binnenkort beschikbaar: In de loop van 2024 zullen we GitHub Issues geleidelijk uitfaseren als het feedbackmechanisme voor inhoud. Het wordt vervangen door een nieuw feedbacksysteem. Zie voor meer informatie: https://aka.ms/ContentUserFeedback.
Feedback verzenden en weergeven voor