Optimizing Profiler settings
The Performance Profiler and Diagnostic Tools window in Visual Studio have many different settings that affect the overall performance of the tools. Changing some settings can cause analysis to run quickly or cause additional wait times while processing results in tools. Below is a summary of certain settings and their impact on performance.
Symbol Settings
The symbols settings found in the debugger options (Debug > Options > Symbols or Tools > Options > Debugging > Symbols) have a significant impact on how long it takes to generate results in the tools. Enabling symbol servers or using the _NT_SYMBOL_PATH causes the profiler to request symbols for each loaded module in a report. Currently, the profiler always automatically loads all symbols regardless of the automatic symbol loading preference.

Progress on symbol loading can be seen in the Output window under the Diagnostic Tools heading.

Once downloaded, symbols are cached, which will speed up future analysis but still requires loading and analyzing the files. If symbol loading is slowing down analysis, try turning off symbol servers and clear your symbol cache. Instead, rely on symbols built locally for your project.
Show External Code
Many of the tools within the Performance Profiler and Diagnostic Tools window have a concept of user code versus external code. User code is any code built by the open solution or open workspace. External code is anything else. By keeping the Show external code setting disabled, or Show just my code enabled, you allow the tools to aggregate external code to a single first level frame, greatly reducing the amount of processing required to show results. This allows users to see what was called in external code that created the slow down while keeping the data to be processed to a minimum. When possible, leave Show external code disabled and ensure that you have the solution or workspace open for the diagsession you're analyzing.
Trace Duration
Profiling smaller durations results in less data, which is faster to analyze. Typically we recommend that you try to limit your traces to no longer than five minutes of performance data. Some tools, such as the CPU Usage tool, allow you to pause data collection while the tool is running, so that you can limit the amount of collected data to the scenario that you're interested in analyzing.
Sampling Frequency
Certain tools, such as the CPU Usage tool and NET Object Allocation tool, allow you to adjust a sampling frequency. Increasing this sampling frequency lets you measure more precisely, but increases the amount of generated data. Typically, it's best to leave this setting at the default rate unless a specific issue is being investigated.


Set the collection folder
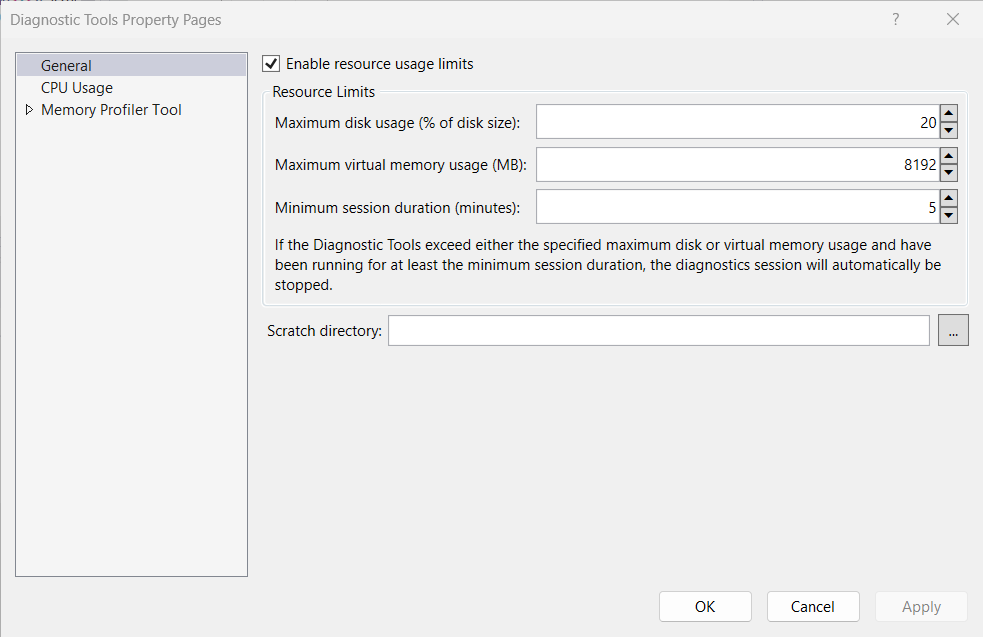
The Visual Studio profiler uses a collection scratch directory to store performance traces before they're saved or discarded. By default, the profiler uses your temp directory. However, you can specify a different scratch directory by first opening the Diagnostic Tools Window (Debug > Windows > Show Diagnostic Tools), and then choosing Select Tools > Settings > General > Scratch Directory.
Related content
Feedback
Binnenkort beschikbaar: In de loop van 2024 zullen we GitHub Issues geleidelijk uitfaseren als het feedbackmechanisme voor inhoud. Het wordt vervangen door een nieuw feedbacksysteem. Zie voor meer informatie: https://aka.ms/ContentUserFeedback.
Feedback verzenden en weergeven voor