Go from insights to quick action showcase
The Power BI playground's Go from insights to quick action demonstrates an app that creates meaningful customer campaigns based on real-time analytics. Users can slice and filter Power BI embedded report data to discover insights, then configure and start a customer discount or coupon campaign instantly from within the report.
This showcase demonstrates how an app uses the following commands:
- The extend menu command API to add a custom command and menu item to a report.
- Event handling to communicate between report events and application code.
- The exportData API to export the underlying data of a report visual.
Go from insights to quick action showcase experience
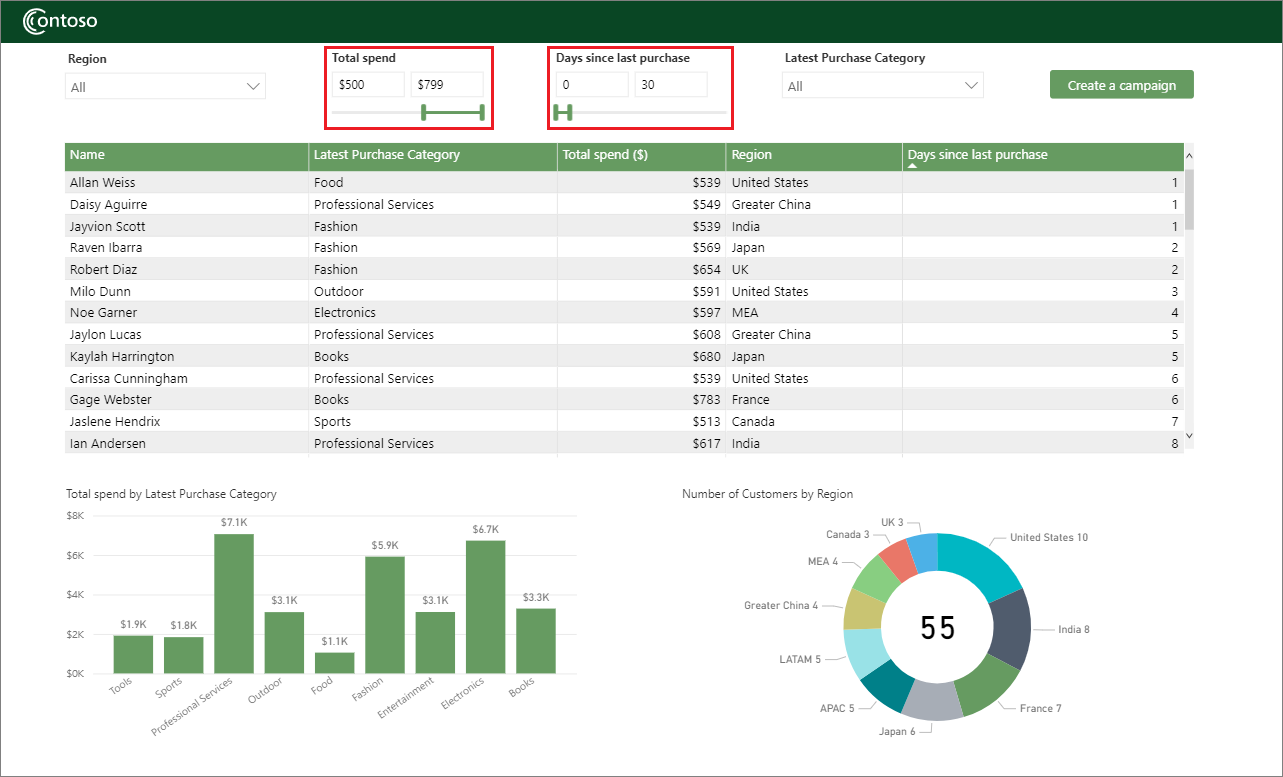
Contoso, a fictitious sales company, uses the Go from insights to quick action showcase to generate insights and kick off campaigns directly from within a Power BI embedded report. The embedded report presents customers' purchases by customer name and region, purchase category, days since last purchase, and amount spent.
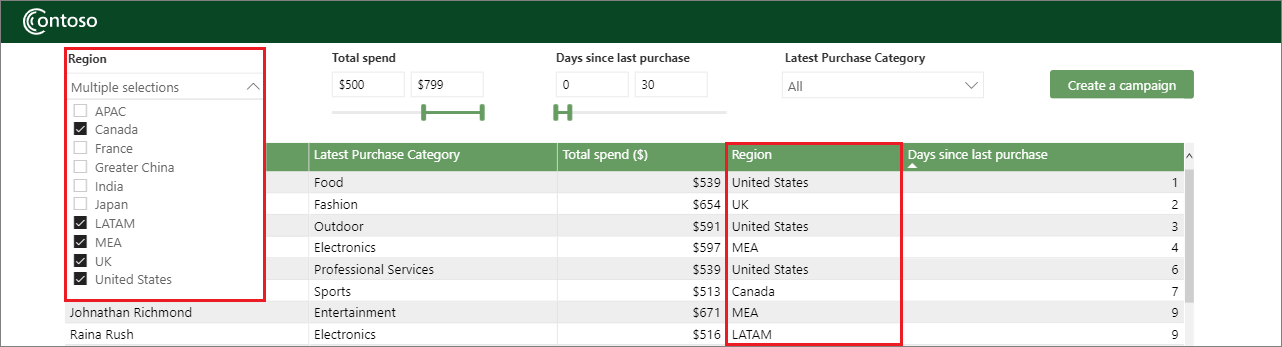
The report has table, column graph, and donut chart visualizations, and several slicing, filtering, and sorting mechanisms. For this report, Contoso is most interested in the past 30 days' higher-end purchases of $500-$799, so the report loads with those slicer ranges applied.
Generate insights
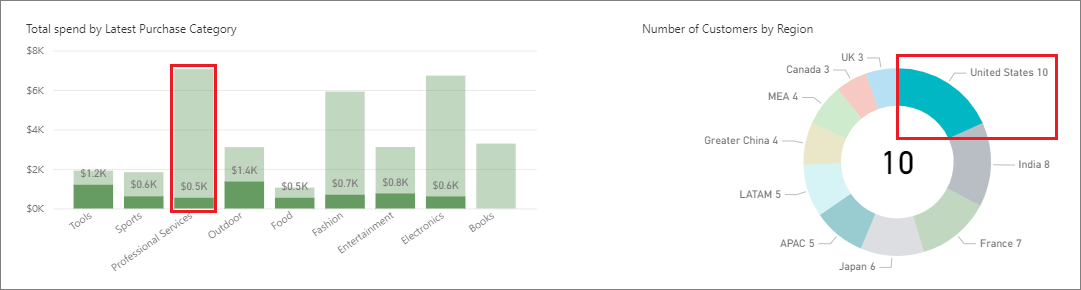
To gain insights about the sales results, report users can filter or slice the data further by selecting specific values and ranges in the drop-down lists, visualizations, and slicers. For example, a Sales Manager for Professional Services selects several different regions, and realizes that although the Professional Services category had the highest total spend overall, it had the lowest spends in the MEA, UK, and United States regions, and no purchases in LATAM or Canada.
Create a campaign
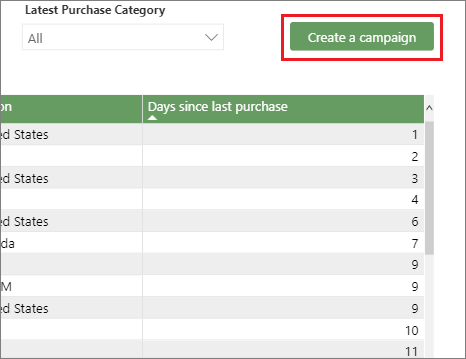
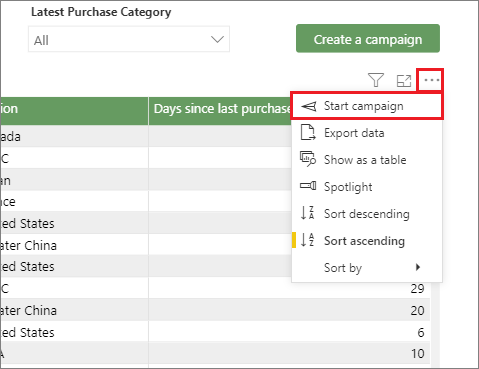
The Sales Manager decides to promote Professional Services sales to Canada, LATAM, MEA, UK, and United States customers. To kick off a campaign any time using the current customer list, the Sales Manager can either select the Create a campaign button, or select Start campaign from the customer table visual's More options (...) menu.
Create a targeted customer list
Report users can use the report drop-down lists, visualizations, and slicers to narrow down the customer list to targeted recipients. In this case, the Sales Manager selects Canada, LATAM, MEA, UK, and United States from the Region drop-down list, and the customer table now lists customers from only those regions. When the customer list is ready, the Sales Manager selects Create a campaign.
Create a discount campaign
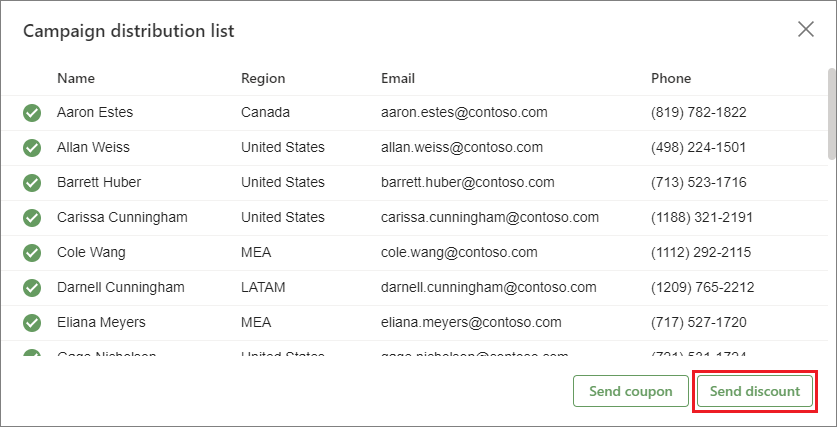
The Campaign distribution list popup opens, listing the targeted recipients' names and contact information, and offering the choice to Send discount or Send coupon. The Sales Manager selects Send discount.
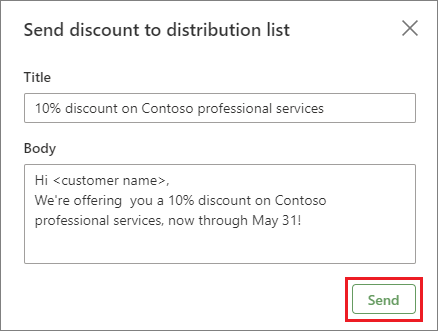
In the Send discount to distribution list dialog box, the Sales Manager writes a message offering the targeted customers a 10% discount on Contoso professional services, and then selects Send.
The app sends the discount offer emails to the distribution list, and displays a Sent notification.
The Sales Manager could also send a coupon to customers by selecting Send coupon on the distribution list screen.
Go from insights to quick action showcase code
The code for implementing the showcase is in the PowerBI-Embedded-Showcases GitHub repository.
The application HTML code builds the embedded report container and elements, dialog boxes, text fields, and buttons.
The report JavaScript code embeds the report and defines all the visualization interactions, data exports, and button handling functions.
Add the campaign command to the report
The report embedConfiguration uses the extend menu command API to add a campaign command to the report, which appears at the top of the More options menu of the table visual.
let config = {
...
    settings: {
        ...
        extensions: [
            {
                command: {
                    name: "campaign",
                    title: "Start campaign",
                    icon: base64Icon,
                    selector: {
                        $schema: "http://powerbi.com/product/schema#visualSelector",
                        visualName: tableVisualGuid
                    },
                    extend: {
                        visualOptionsMenu: {
                            title: "Start campaign",
                            menuLocation: models.MenuLocation.Top,
                        }
                    }
                }
            },
        ...
    }
}
Handle the Start campaign command
The following code handles the commandTriggered event for the campaign command. The code listens for the Start campaign menu item selection event, and sends the current filtered customer list data from the table visual.
// Adding onClick listener for the custom menu in the table visual in the report
reportShowcaseState.report.on("commandTriggered", async function (event) {
    if (event.detail.command === "campaign") {

        // Populate data according to the current filters on the table visual
        const result = await tableVisual.exportData(models.ExportDataType.Underlying);
        handleExportData(result);
        onStartCampaignClicked();
    }
});
Handle the Create a campaign button click
The following code handles the Create a campaign button click event. The code listens for the Create a campaign button selection event, and sends the current filtered customer list data from the table visual.
// Adding onClick listener for the button in the report
reportShowcaseState.report.on("buttonClicked", async function () {

    // Populate data according to the current filters on the table visual
    const result = await tableVisual.exportData(models.ExportDataType.Underlying);
    handleExportData(result);
    onStartCampaignClicked();
});