The wpa R package
Important
This article is for the legacy Workplace Analytics app and does not reflect functionality available on the updated Viva Insights platform. Access current documentation for Viva Insights advanced insights here: advanced insights documentation.
The wpa R package is an open-source repository of more than 100 functions that provide low-code pre-built analyses. Analysts can use this package to execute custom analyses that go beyond the insights that Templates and Viva Insights Query designer make available. These analyses can help leaders go deeper into the data that Viva Insights provides to solve more specific problems.
Note
R is an open-source statistical programming language and one of the most popular toolkits for data analysis and data science. For users of the R language, a "package" is a unit of sharable code that's organized into libraries.
Capabilities for analysts
This R package is intended for use by analysts and data scientists who are intermediate-to-advanced users of R or Python. By using the wpa R package, an analyst can:
Run prebuilt analysis and visualizations of Viva Insights data with the ability to make settings to use organizational data variables and maintain privacy thresholds.
Obtain outputs in multiple formats. Analysts can easily export these outputs into any format required, including clipboard (copy & paste), Excel, .csv, and – for plots – .png, .svg, and .pdf.
Validate data prior to analysis by running a data validation report, which does systematic checks on, for example, metrics, organizational attributes, and meeting subject lines. The data-validation functions check for patterns such as public holidays, non-knowledge workers, outliers, and missing values in the data to improve the quality and reliability of analysis.
Generate prebuilt interactive HTML reports, which includes reports on data validation, subject-line text mining, and key collaboration metrics.
Make use of advanced analytics functions, such as text mining, network analysis, and hierarchical clustering, all designed specifically for Viva Insights metrics.
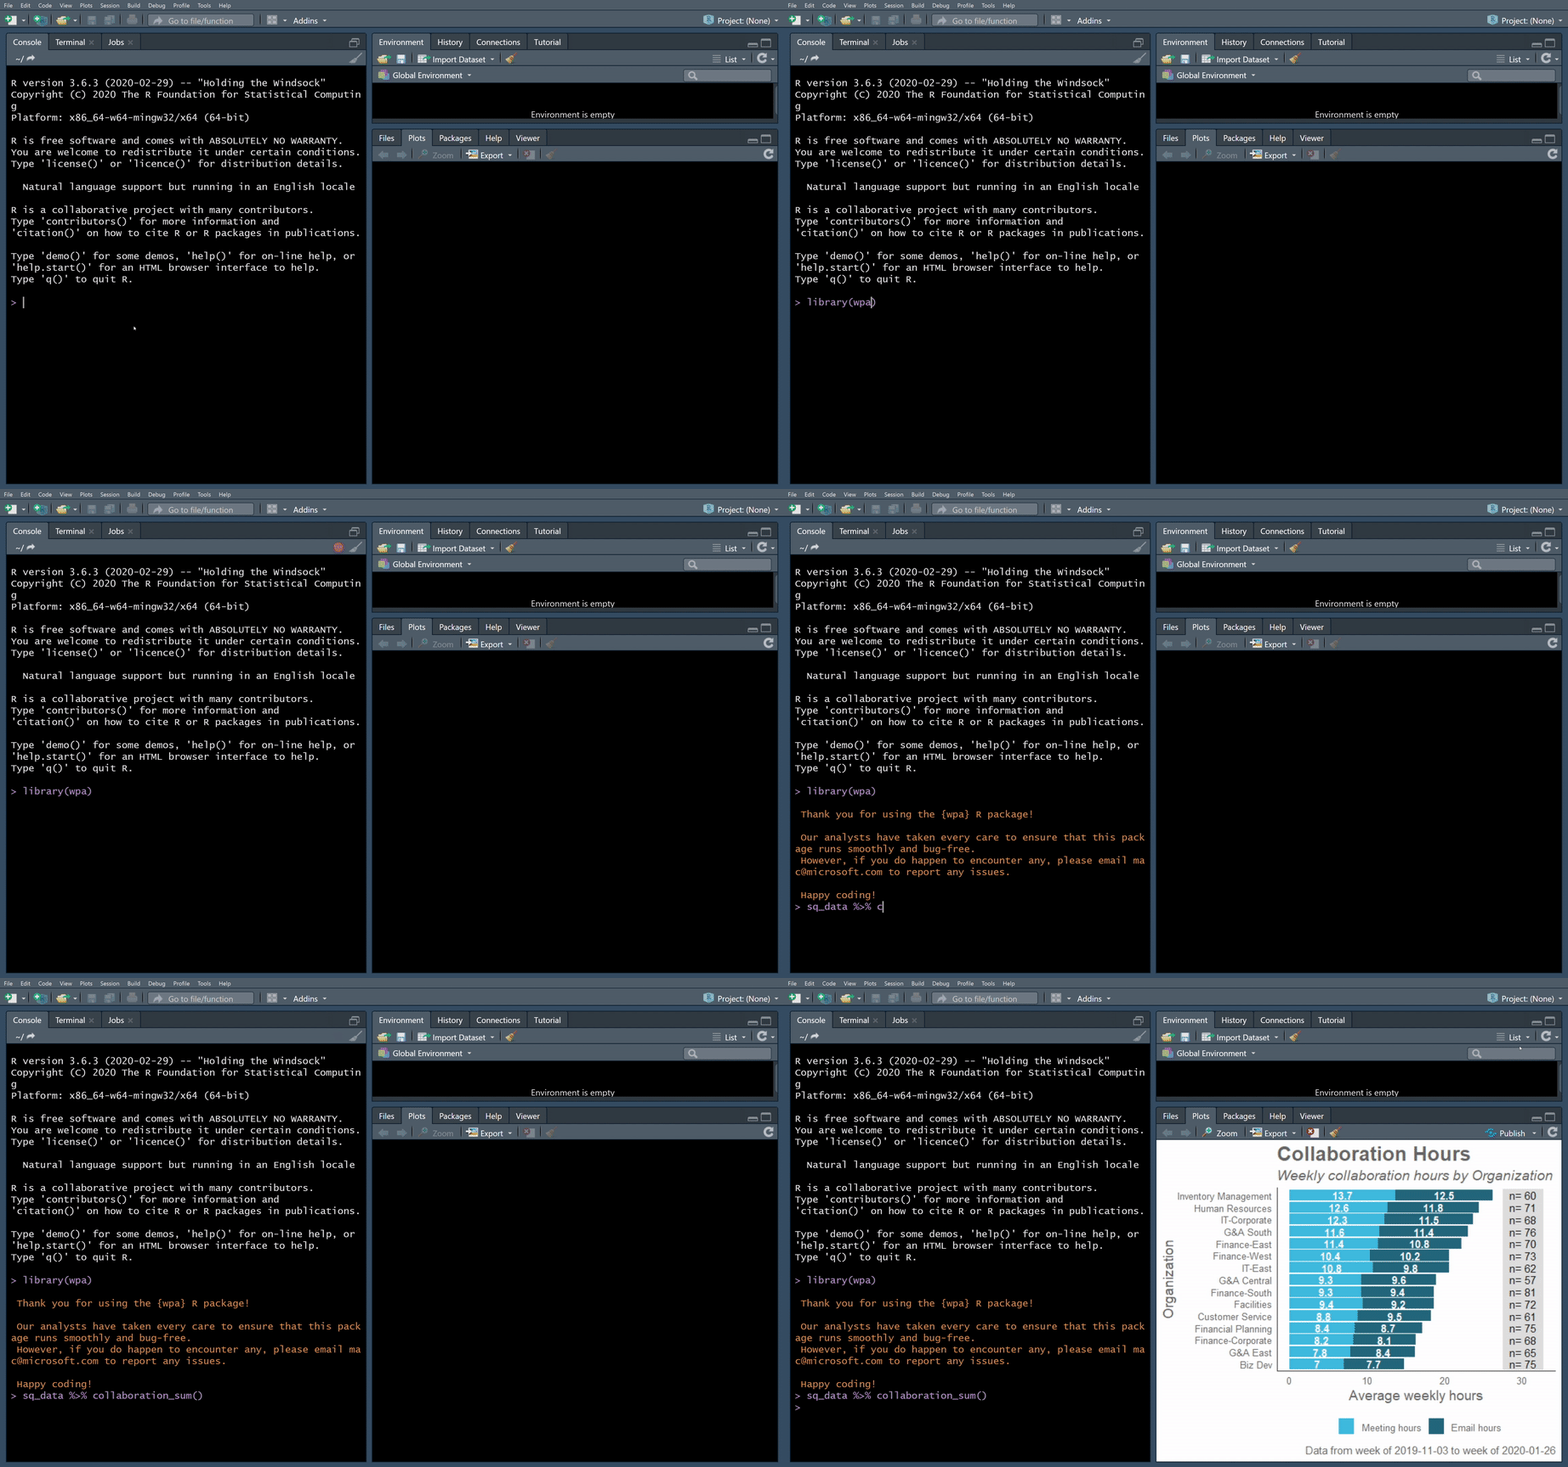
The following illustration shows the experience of creating a visualization of collaboration hours with the wpa R package:

Analyst resources
The wpa R package, its documentation, and other related resources are available on GitHub in the following locations:
- wpa R package source code
- wpa R package documentation, which includes a quick-start guide, code examples, and other information like the structure of the package.
- Submit an issue or a feature request
- Full list of functions