Create Data Activator alerts for a Real-Time Dashboard
You can create Data Activator alerts from many different data sources in Microsoft Fabric. This article explains how to create Data Activator alerts for a Real-Time Dashboard. For more information, see What is Data Activator?
Alert when conditions are met in a Real-Time Dashboard
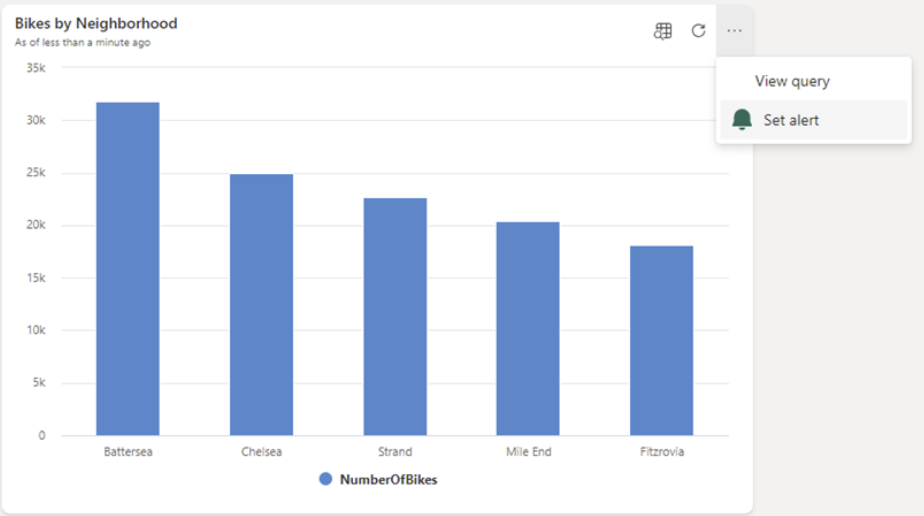
Use Data Activator to trigger notifications when conditions are met on data in a Real-Time Dashboard. For example, if you have a Real-Time Dashboard displaying availability of bicycles for hire in multiple locations, you can trigger an alert if there are too few bicycles available in any one location. Send those alert notifications either to yourself, or to others in your organization, using email or Microsoft Teams.
Prerequisites
- A workspace with a Microsoft Fabric-enabled capacity
- A Real-Time Dashboard with at least one tile displaying data
Create a Data Activator trigger using Set alert
- Open a Real-Time Dashboard.
- Toggle from viewing to editing mode in the toolbar.
- Choose a tile on the Real-Time Dashboard for Data Activator to monitor.
- Select the More menu (...) at the top-right of the tile, and choose Set Alert. You can also use the Set Alert button in the Real-Time Dashboard menu bar.
Define the Data Activator alert conditions
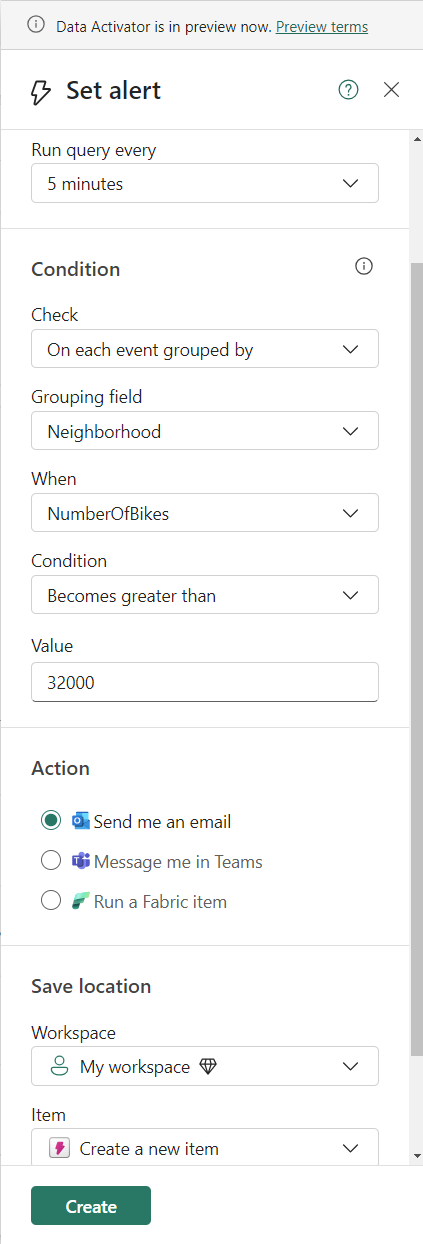
In the Set alert pane, define your rule conditions. Rule conditions include deciding which field to monitor and setting the threshold. Select whether to receive your notification in email or in Microsoft Teams. Set the location to save this Data Activator rule and select Create.
Optional: Edit your trigger in Data Activator
When your trigger is ready, you receive a notification with a link to your trigger. Select the link to edit your trigger in Data Activator. Editing your trigger is useful if you want to do one of the following refinements:
- Add other recipients to your alert.
- Define a more complex alert condition than is possible in the Set alert pane.
For information on how to edit triggerss in Data Activator, see Create triggers in design mode .
Limitations on charts with a time axis
If you have a chart with a time axis in Power BI or in a Real-Time Dashboard, then Data Activator reads the measure value exactly once for each point on the time axis. If the measured value for a given time point changes after Data Activator reads it, then Data Activator ignores the changed value.
Limitation example
The following example illustrates this limitation. In this example, a chart shows the number of items sold over time. Data Activator first reads the chart in the morning of January 3. At this time, the chart shows 10 items sold:
| Date | Number of items sold |
|---|---|
| 1 January | 20 |
| 2 January | 18 |
| 3 January | 10 |
Later in the day of January 3, more items are sold. The chart updates to reflect this change, and the number of items sold now reads 15:
| Date | Number of items sold |
|---|---|
| 1 January | 20 |
| 2 January | 18 |
| 3 January | 15 (changed from earlier in the day) |
Data Activator ignores the changed value, because it has already read a value of 10 earlier in the day.
How to work around this limitation
The most common reason that a measure value can change over time is that the most recent point on the time axis is subject to change. In the example, the number of sales increases throughout the day. The number of items sold on previous days never changes, because these dates are in the past. To avoid this limitation:
Exclude the current date/time from the chart, so that this value isn't sampled while it's still subject to change.
Add a relative time filter to your chart to exclude the current date or time from your chart. Data Activator sees the value only after it's final for the period of time being measured, and no longer subject to change.
Add a time filter where the time range ends at 'one bin before' the current time. So, the last bin sampled by Data Activator is already "closed" and doesn't change.
TableForReflex
| where YourTimeColumn between (ago(5h)..bin(now(), 1h))
| summarize count() by bin(YourTimeColumn, 1h)
| render timechart
Use a card or KPI visual to track the value for the current date since the limitation described here only applies to charts with a time axis. For example, create a KPI visual that displays "sales so far for today." Data Activator reads and triggers to changes in this value throughout the day.