Logging, metrics, and alerts in Azure
To understand how your Azure service is performing, you need to understand which logging, metrics, and alerts are available and how to use them.
Questions about your resources
Use the following table to understand what information you can learn about your Azure resources and why you should use logging, metrics, and alerts.
Type
Example questions
Azure hosting
Hosting services such as Azure App Service and Azure Functions provide several forms of feedback to answer questions such as:
- Was my application (or container) deployed successfully?
- Did my application (or container) start successfully?
- Is my application (or container) running successfully?
Azure service
Azure offers metrics for services, so you can get answers to questions such as:
- How busy is the service?
- What errors is the service producing?
- Is my service so busy that it can't keep up with demand?
- Have I reached the transaction quota for my pricing tier?
Azure SDK
The Azure SDKs provide access to Azure from many programming languages. The SDKs provide logging so that you can ask questions such as:
- What is the SDK itself doing?
- What is my code doing?
Your code or container
To understand how your own code or container is working, integrate Application Insights from Azure Monitor. You can use Application Insights to capture logs across services for a single application to ask questions such as:
- What exceptions is my code throwing?
- What events is my code triggering?
- How is my code interacting with dependencies?
Features of logging, metrics, and alerts
| Type | Availability | Description |
|---|---|---|
| Metrics | Provided without configuration | Start with metrics because every Azure service has some metrics to help you evaluate how it's performing. |
| Alerts | Configurable | Configure alerts to be notified when negative or quota-expiring behaviors happen. |
| Logging | Configurable | Some services, such as hosting services, have logging to help you understand how your code or container is behaving. You might need to configure logging before you can open log files. |
| Custom logging | Configurable via code | From your own code, you can log to Azure Monitor by using the Application Insights SDK for server and client applications. The code doesn't have to be hosted on Azure to log to Azure Monitor. |
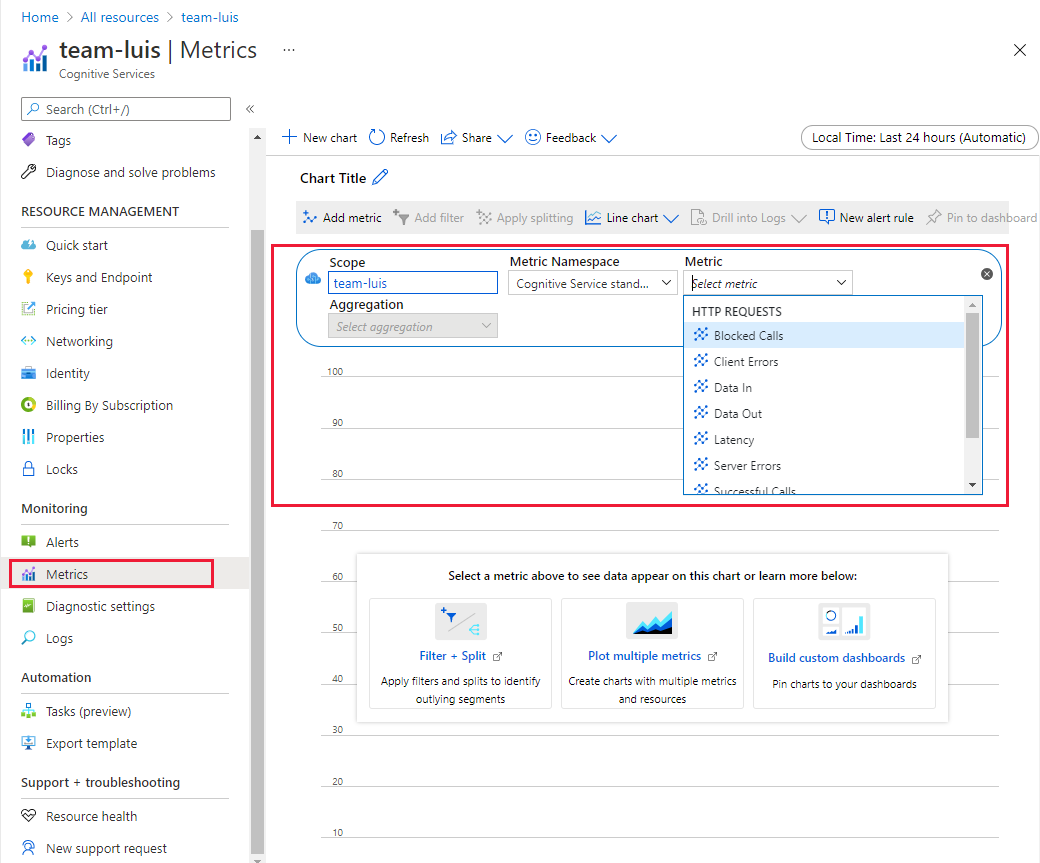
View metrics in the Azure portal
To view metrics for your resource on a scheduled basis, open the Azure portal and go to Monitoring > Metrics.
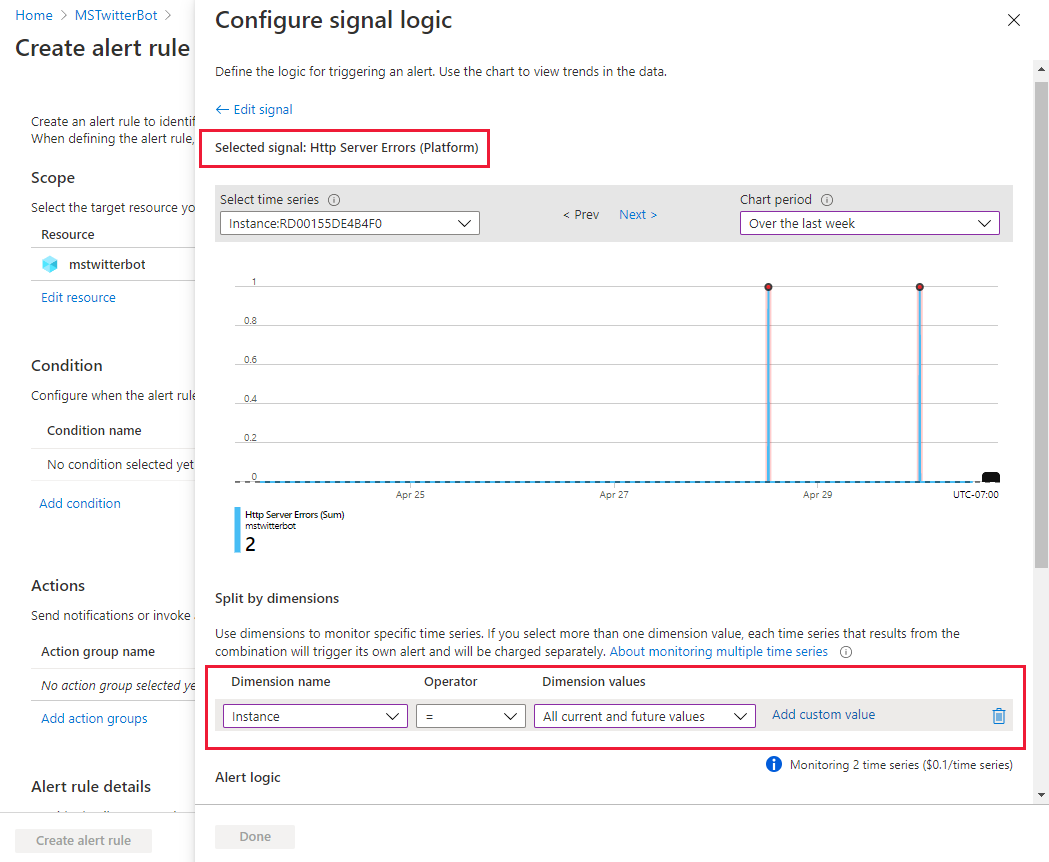
View alerts in the Azure portal
Set alerts for your resources in the Azure portal. Alerts can include specific metrics, communication streams (such as email), and frequency. Common alerts to set are total:
- Requests
- Response time
- HTTP server errors (in hosting environments)
View hosted service logs in the Azure portal
You can configure hosted applications and containers to log information about:
- Deployment
- Startup
- Runtime
Turn on these logs to understand how your hosted application behaves. These logs are probably the first place where you'll learn that your deployment failed or that your startup configuration is incorrectly configured or missing dependencies.
Log to stdout and stderr
Azure web apps and Azure functions automatically provide custom logging to stdout and stderr, if you use the correct logging functions:
- Web apps use
console.log('your message here'). - Function apps use
context.log('your message here').
Add custom logging
You can add richer custom logging by using Application Insights in Azure Monitor. Application Insights offers server (Node.js) and client (browser) scenarios:
- Add the Application Insights SDK to your source code.
- Log from Node.js by using an npm package.
- Log from your client code by using an npm package.
- Log from your Kubernetes cluster or Azure virtual machine.
Turn on application logging by using Application Insights
For application logging, Application Insights can provide:
- Standard logging in the Azure service and in your source code, depending on the initialization.
- Custom logging from your deployment pipeline and in your source code.
Turn on application logging for App Service
To turn on application host logging in the Azure portal:
- Go to Monitoring > App Service logs, and then turn on Application logging for the file system.
- Configure the Quota (MB) value. The default value is 35.
- Set the Retention Period (Days) value to a default, such as 3 or 7.
- Select Save to begin capturing host logs.
View application logs for App Service
When you turn on application logs, the logs are stored in the Logs folder of your web app host. View the logs from either the Azure portal or the Visual Studio Code extension for App Service.
Name formats for log files include:
- Deployment:
{DATE-TIME}_{RANDOM-CHARS}_{docker}.log - Startup and runtime:
{DATE-TIME}_{RANDOM-CHARS}_default_docker.log
Stream logs for App Service
For App Service, use the following table to learn more about how to stream logs.
| Method | Description |
|---|---|
| Azure CLI | Run az webapp log tail. |
| App Service extension in Visual Studio Code | Right-click the resource, and then select Start streaming logs. |
Turn on application logging for Azure Functions (plan)
See the earlier steps to turn on host logging for App Service.
Turn on application logging for Azure Functions (consumption)
With a consumption-based function app, if you use the logging that the context object in your source code provides, those logs appear under each function's Monitor section. The Azure portal also gives you the option to stream the logs as requests come in to the function.
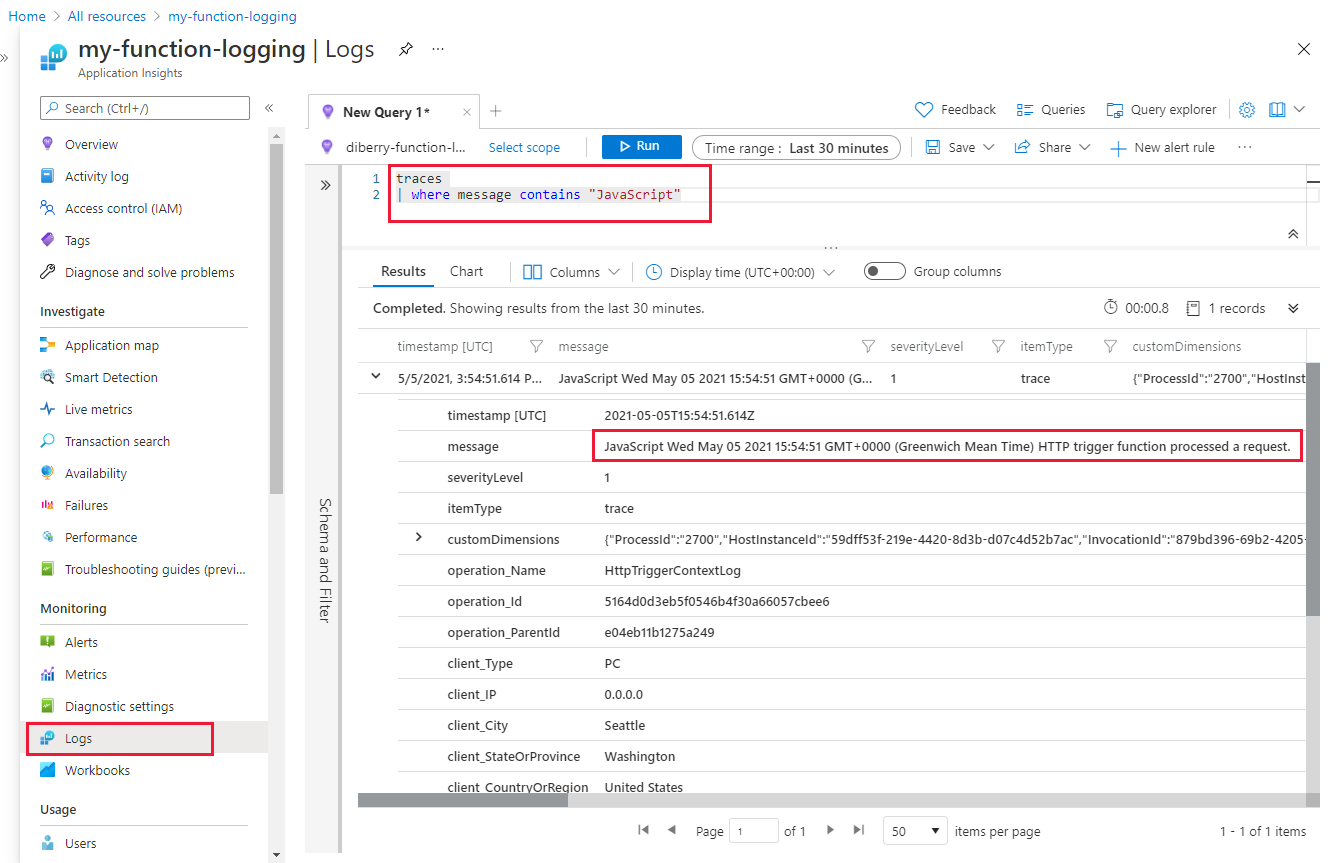
Query your Application Insights logs by using Kusto Query Language
When you use context.log in a function app or console.log in a web app, and you have Application Insights turned on, those custom logs are added to your Application Insights resource in the Trace table. If you prefix your custom log with a specific string, such as JavaScript, you can use Kusto Query Language to search the Trace table for any messages that contain that prefix when you want to reduce your log to just those custom entries.
traces
| where message contains "JavaScript"
Develop locally with Application Insights
If you're trying out Application Insights by running code locally, and that code uses one of the Application Insights npm packages, be sure to call the flush() method so the logging is sent to Application Insights immediately. When you view the logs, remember that it can still take a couple of minutes before your custom logs are available in Application Insights.
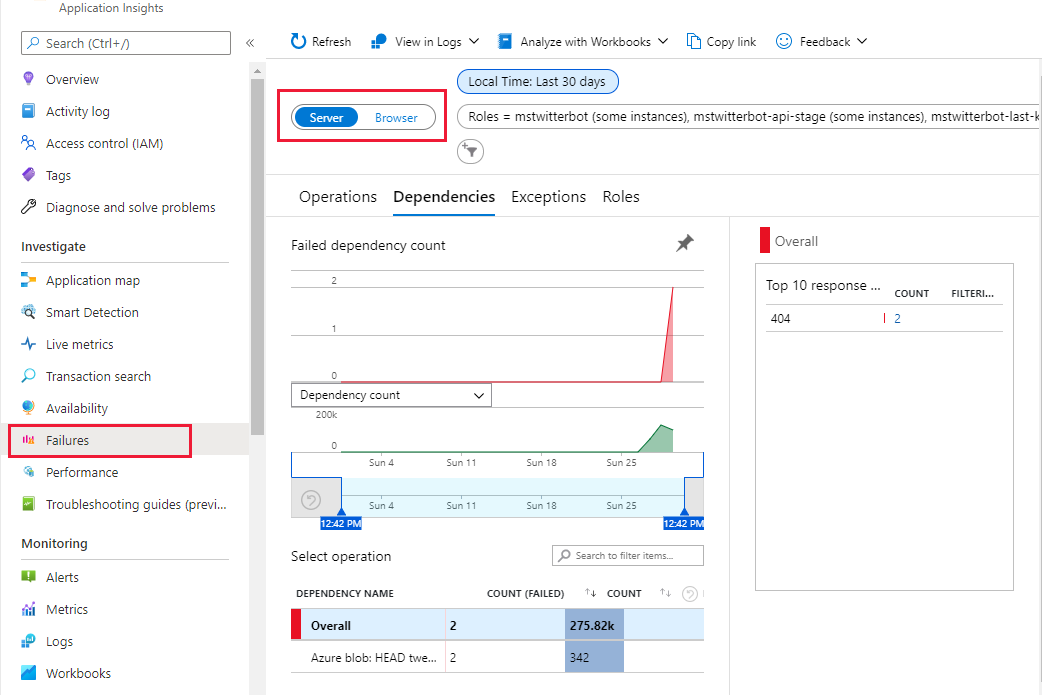
View app failure data in Application Insights
To view failures for resources that you monitor in Application Insights, use the Failures pane.