Tutorial: Learn to debug C# code using Visual Studio
This article introduces the features of the Visual Studio debugger in a step-by-step walkthrough. If you want a higher-level view of the debugger features, see First look at the debugger. When you debug your app, it usually means that you're running your application with the debugger attached. When you do this task, the debugger provides many ways to see what your code is doing while it runs. You can step through your code and look at the values stored in variables, you can set watches on variables to see when values change, you can examine the execution path of your code, see whether a branch of code is running, and so on. If this exercise is the first time that you've tried to debug code, you might want to read Debugging for absolute beginners before going through this article.
Although the demo app is C#, most of the features are applicable to C++, Visual Basic, F#, Python, JavaScript, and other languages supported by Visual Studio (F# doesn't support Edit-and-continue. F# and JavaScript don't support the Autos window). The screenshots are in C#.
In this tutorial, you will:
- Start the debugger and hit breakpoints.
- Learn commands to step through code in the debugger
- Inspect variables in data tips and debugger windows
- Examine the call stack
Prerequisites
You must have Visual Studio 2022 installed and the .NET desktop development workload.
You must have Visual Studio 2019 installed and the .NET Core cross-platform development workload.
If you haven't already installed Visual Studio, go to the Visual Studio downloads page to install it for free.
If you need to install the workload but already have Visual Studio, go to Tools > Get Tools and Features..., which opens the Visual Studio Installer. The Visual Studio Installer launches. Choose the .NET Core cross-platform development workload, then choose Modify.
If you already have Visual Studio but the .NET desktop development workload isn't installed, go to Tools > Get Tools and Features..., which launches the Visual Studio Installer. In the Visual Studio Installer, choose the .NET desktop development workload, then choose Modify.
Create a project
First, you create a .NET Core console application project. The project type comes with all the template files you need, before you've even added anything!
Open Visual Studio. If the start window isn't open, select File > Start Window.
On the start window, select Create a new project.
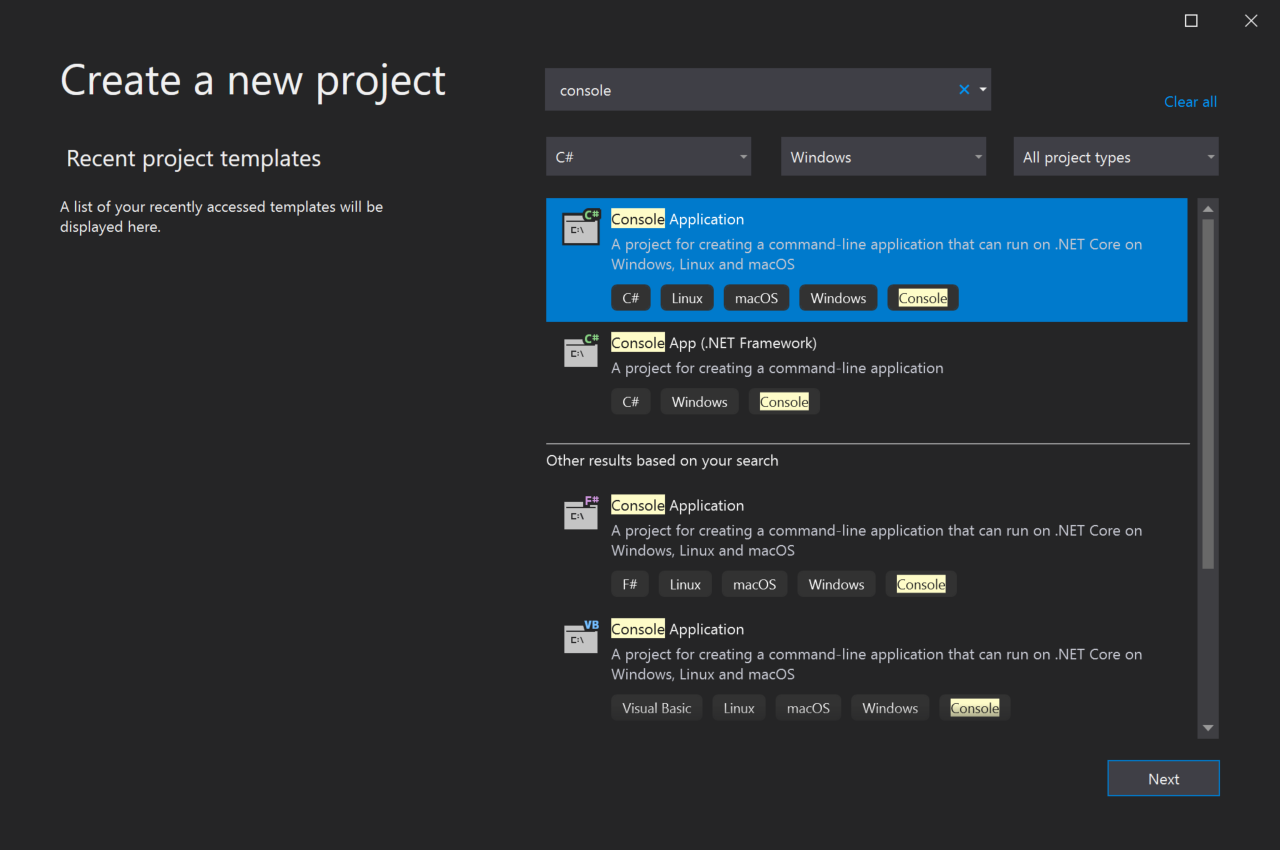
On the Create a new project window, enter console in the search box. Next, choose C# from the Language list, and then choose Windows from the Platform list.
After you apply the language and platform filters, choose the Console App template for .NET Core, and then select Next.
Note
If you do not see the Console App template, you can install it from the Create a new project window. In the Not finding what you're looking for? message, choose the Install more tools and features link. Then, in the Visual Studio Installer, choose the .NET Core cross-platform development workload.
In the Configure your new project window, enter GetStartedDebugging in the Project name box. Then, select Next.
Select the recommended target framework (.NET 8.0 or Long-term support), and then select Create.
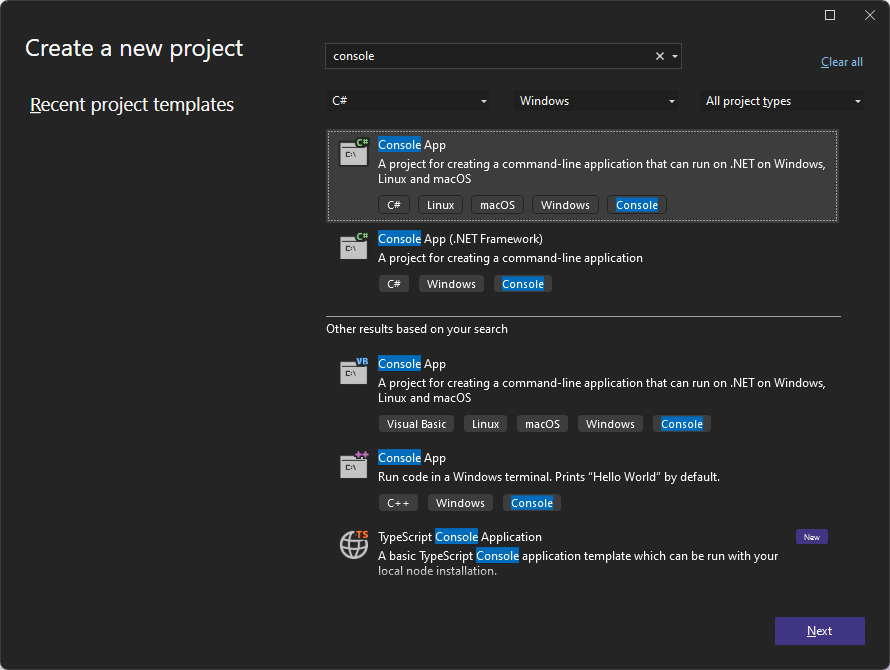
On the Create a new project window, enter console in the search box. Next, choose C# from the Language list, and then choose Windows from the Platform list.
After you apply the language and platform filters, choose the Console App template, and then select Next.
Note
If you don't see the Console App template, you can install it from the Create a new project window. In the Not finding what you're looking for? message, choose the Install more tools and features link. Then, in the Visual Studio Installer, choose the .NET desktop development workload.
In the Configure your new project window, enter GetStartedDebugging in the Project name box. Then, select Next.
In the Additional information window, ensure .NET 8.0 is selected in the Framework dropdown menu, and then select Create.
Visual Studio opens your new project.
Create the application
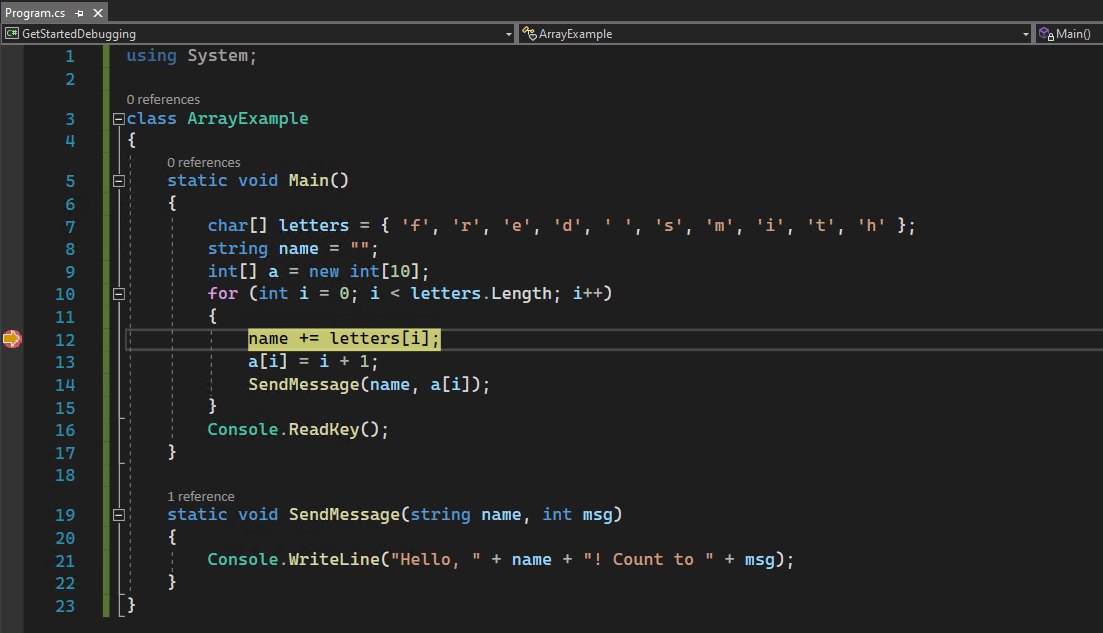
In Program.cs, replace all of the default code with the following code:
using System;

class ArrayExample
{
   static void Main()
   {
      char[] letters = { 'f', 'r', 'e', 'd', ' ', 's', 'm', 'i', 't', 'h'};
      string name = "";
      int[] a = new int[10];
      for (int i = 0; i < letters.Length; i++)
      {
         name += letters[i];
         a[i] = i + 1;
         SendMessage(name, a[i]);
      }
      Console.ReadKey();
   }

   static void SendMessage(string name, int msg)
   {
      Console.WriteLine("Hello, " + name + "! Count to " + msg);
   }
}
Start the debugger!
Press F5 (Debug > Start Debugging) or the Start Debugging button
 in the Debug Toolbar.
F5 starts the app with the debugger attached to the app process, but right now we haven't done anything special to examine the code. So the app just loads and you see this console output.
Hello, f! Count to 1
Hello, fr! Count to 2
Hello, fre! Count to 3
Hello, fred! Count to 4
Hello, fred ! Count to 5
Hello, fred s! Count to 6
Hello, fred sm! Count to 7
Hello, fred smi! Count to 8
Hello, fred smit! Count to 9
Hello, fred smith! Count to 10
In this tutorial, you take a closer look at this app using the debugger and get a look at the debugger features.
Stop the debugger by pressing the red stop button (Shift + F5).

In the console window, press a key to close the console window.
Mostly, we use keyboard shortcuts here, because it's a fast way to execute debugger commands. Equivalent commands, such as toolbar or menu commands, are also noted.
To start the debugger, select F5, or choose the Debug Target button in the Standard toolbar, or choose the Start Debugging button in the Debug toolbar, or choose Debug > Start Debugging from the menu bar.

F5 starts the app with the debugger attached to the app process. Since we haven't done anything special to examine the code, the app runs to completion and you see the console output.
Hello, f! Count to 1
Hello, fr! Count to 2
Hello, fre! Count to 3
Hello, fred! Count to 4
Hello, fred ! Count to 5
Hello, fred s! Count to 6
Hello, fred sm! Count to 7
Hello, fred smi! Count to 8
Hello, fred smit! Count to 9
Hello, fred smith! Count to 10
To stop the debugger, select Shift+F5, or choose the Stop Debugging button in the Debug toolbar, or choose Debug > Stop Debugging from the menu bar.
In the console window, select any key to close the console window.
Set a breakpoint and start the debugger
In the
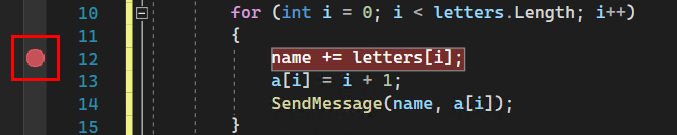
forloop of theMainfunction, set a breakpoint by clicking in the left margin on the following line of code:name += letters[i];A red circle
 appears where you set the breakpoint.
Breakpoints are one of the most basic and essential features of reliable debugging. A breakpoint indicates where Visual Studio should suspend your running code so you can take a look at the values of variables, or the behavior of memory, or whether or not a branch of code is getting run.
Press F5 or the Start Debugging button.
The app starts and the debugger runs to the line of code where you set the breakpoint.
The yellow arrow represents the statement on which the debugger paused, which also suspends app execution at the same point (this statement hasn't yet executed).
If the app isn't yet running, F5 starts the debugger and stops at the first breakpoint. Otherwise, F5 continues running the app to the next breakpoint.
Breakpoints are a useful feature when you know the line of code or the section of code that you want to examine in detail. For information on the different types of breakpoints you can set, such as conditional breakpoints, see Using breakpoints.
In the
forloop of theMainfunction, set a breakpoint by clicking in the left margin on the following line of code:name += letters[i];A red circle appears where you set the breakpoint.
Breakpoints are an essential feature of reliable debugging. You can set breakpoints where you want Visual Studio to pause your running code so you can look at the values of variables or the behavior of memory, or know whether or not a branch of code is getting run.
To start debugging, select F5, or choose the Debug Target button in the Standard toolbar, or choose the Start Debugging button in the Debug toolbar, or choose Debug > Start Debugging from the menu bar. The app starts and the debugger runs to the line of code where you set the breakpoint.
The yellow arrow points to the statement on which the debugger paused. App execution is paused at the same point, with the statement not yet executed.
When the app isn't running, F5 starts the debugger, which runs the app until it reaches the first breakpoint. If the app is paused at a breakpoint, then F5 will continue running the app until it reaches the next breakpoint.
Breakpoints are a useful feature when you know the line or section of code that you want to examine in detail. For more about the different types of breakpoints you can set, such as conditional breakpoints, see Using breakpoints.
Navigate code and inspect data by using data tips
Mostly, we use the keyboard shortcuts here, because it's a good way to get fast at executing your app in the debugger (equivalent commands such as menu commands are shown in parentheses).
While code execution is paused on the
name += letters[i]statement, hover over thelettersvariable and you see its default value, the value of the first element in the array,char[10].Features that allow you to inspect variables are one of the most useful features of the debugger, and there are different ways to do it. Often, when you try to debug an issue, you're attempting to find out whether variables are storing the values that you expect them to have at a particular time.
Expand the
lettersvariable to see its properties, which include all the elements that the variable contains.![Screenshot of the debugger paused at the 'name+= letters[I]' statement.](media/get-started-view-data-tip.png?view=vs-2022)
Next, hover over the
namevariable, and you see its current value, an empty string.Press F10 (or choose Debug > Step Over) twice to advance to the
SendMessagemethod call, and then press F10 one more time.F10 advances the debugger to the next statement without stepping into functions or methods in your app code (the code still executes). By pressing F10 on the
SendMessagemethod call, we skipped over the implementation code forSendMessage(which maybe we're not interested in right now).Press F10 (or Debug > Step Over) a few times to iterate several times through the
forloop, pausing again at the breakpoint, and hovering over thenamevariable each time to check its value.
The value of the variable changes with each iteration of the
forloop, showing values off, thenfr, thenfre, and so on. To advance the debugger through the loop faster in this scenario, you can press F5 (or choose Debug > Continue) instead, which advances you to the breakpoint instead of the next statement.Often, when debugging, you want a quick way to check property values on variables, to see whether they're storing the values that you expect them to store, and the data tips are a good way to do it.
While code execution remains paused in the
forloop in theMainmethod, press F11 (or choose Debug > Step Into) until you pause at theSendMessagemethod call.You should be at this line of code:
SendMessage(name, a[i]);Press F11 one more time to step into the
SendMessagemethod.The yellow pointer advances into the
SendMessagemethod.
F11 is the Step Into command and advances the app execution one statement at a time. F11 is a good way to examine the execution flow in the most detail. By default, the debugger skips over nonuser code (if you want more details, see Just My Code).
Let's say that you're done examining the
SendMessagemethod, and you want to get out of the method but stay in the debugger. You can do this using the Step Out command.Press Shift + F11 (or Debug > Step Out).
This command resumes app execution (and advances the debugger) until the current method or function returns.
You should be back in the
forloop in theMainmethod, paused at theSendMessagemethod call. For more information on different ways to move through your code, see Navigate code in the debugger.
While code execution is paused on the
name += letters[i]statement, hover over thelettersvariable to see a data tip showing the array size and element type,char[10].Note
One of the most useful features of the debugger is its ability to inspect a variable. Often, when you're trying to debug an issue, you're attempting to find out whether variables have values that you expect at a particular time. Viewing data tips is a good way to check that.
Expand the
lettersvariable to view all its array elements and their values.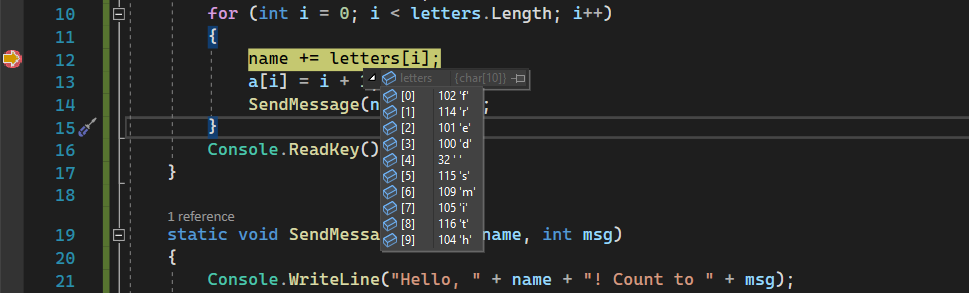
Hover over the
namevariable to see its current value, which is an empty string.To advance the debugger to the next statement, select F10, or choose the Step Over button in the Debug toolbar, or choose Debug > Step Over from the menu bar. Select F10 twice more to move past the
SendMessagemethod call.F10 advances the debugger without stepping into function or methods, although their code still executes. In this way, we skipped debugging the code in the
SendMessagemethod, which we're not interested in right now.To iterate through the
forloop a few times, select F10 repeatedly. During each loop iteration, pause at the breakpoint, and then hover over thenamevariable to check its value in the data tip.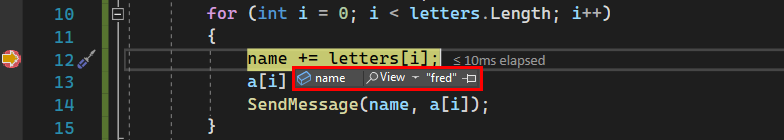
The value of the variable changes with each iteration of the
forloop, showing values off, thenfr, thenfre, and so on. To advance the debugger through the loop faster, select F5 instead, which advances to your breakpoint instead of the next statement.While code execution is paused in the
forloop of theMainmethod, select F11, or choose the Step Into button from the Debug toolbar, or choose Debug > Step Into from the menu bar, until you reach theSendMessagemethod call.The debugger should be paused at this line of code:
SendMessage(name, a[i]);To step into the
SendMessagemethod, select F11 again.The yellow pointer advances into the
SendMessagemethod.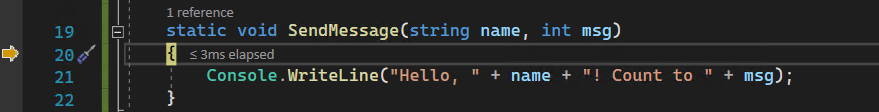
F11 helps you examine the execution flow of your code in more depth. To step into a method from a method call, select F11. By default, the debugger skips stepping into nonuser methods. To learn about debugging nonuser code, see Just My Code.
Once you've finished debugging the
SendMessagemethod, you're ready to return to theforloop of themainmethod.To leave the
SendMessagemethod, select Shift+F11, or choose the Step Out button in the Debug toolbar, or choose Debug > Step Out from the menu bar.Step Out resumes app execution and advances the debugger until the current method or function returns.
You see the yellow pointer back in the
forloop of theMainmethod, paused at theSendMessagemethod call. For more information on different ways to move through your code, see Navigate code in the debugger.
Navigate code using Run to Click
Select F5 to advance to the breakpoint again.
In the code editor, scroll down and hover over the
Console.WriteLinemethod in theSendMessagemethod until the green Run to Click button appears. The tooltip for the button shows "Run execution to here."
Note
The Run to Click button is new in Visual Studio 2017. (If you don't see the green arrow button, use F11 in this example instead to advance the debugger to the right place.)
Select the Run to Click button.
The debugger advances to the
Console.WriteLinemethod.Using this button is similar to setting a temporary breakpoint. Run to Click is handy for getting around quickly within a visible region of app code (you can select in any open file).
Select F5 to advance to the breakpoint again.
In the code editor, hover over the
Console.WriteLinemethod call in theSendMessagemethod until the Run to Click button appears. The tooltip for the button shows "Run execution to here."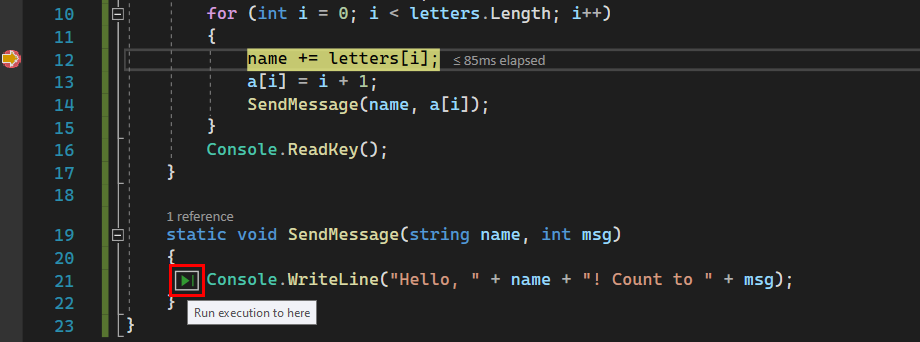
Choose the Run to Click button. Alternatively, with your cursor at the
Console.WriteLinestatement, select Ctrl+F10. Or, right-click theConsole.WriteLinemethod call, and choose Run to Cursor from the context menu.The debugger advances to the
Console.WriteLinemethod call.Using the Run to Click button is similar to setting a temporary breakpoint, and is handy for getting around quickly within a visible region of your app code in an open file.
Restart your app quickly
Select the Restart button  in the Debug Toolbar (Ctrl + Shift + F5).
When you press Restart, it saves time versus stopping the app and restarting the debugger. The debugger pauses at the first breakpoint that is hit by executing code.
The debugger stops again at the breakpoint you previously set inside the for loop.
To rerun your app from the beginning in the debugger, select Ctrl+Shift+F5, or choose the Restart button in the Debug toolbar, or choose Debug > Restart from the menu bar.
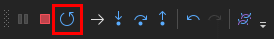
Restart stops the debugger and then restarts it, in one step. When the debugger restarts, it runs to the first breakpoint, which is the breakpoint you previously set inside the for loop, and then pause.
Inspect variables with the Autos and Locals windows
Look at the Autos window at the bottom of the code editor.
If it's closed, open it while paused in the debugger by choosing Debug > Windows > Autos.
In the Autos window, you see variables and their current value. The Autos window shows all variables used on the current line or the preceding line (Check documentation for language-specific behavior).
Next, look at the Locals window, in a tab next to the Autos window.
Expand the
lettersvariable to show the elements that it contains.
The Locals window shows you the variables that are in the current scope, that is, the current execution context.
The Autos and Locals windows show variable values while you're debugging. The windows are only available during a debug session. The Autos window shows variables used on the current line that the debugger is at and the preceding line. The Locals window shows variables defined in the local scope, which is usually the current function or method.
While the debugger is paused, view the Autos window at the bottom of the code editor.
If the Autos window is closed, select Ctrl+D, A, or choose Debug > Windows > Autos from the menu bar.
With the debugger still paused, view the Locals window, in a tab next to the Autos window.
If the Locals window is closed, select Ctrl+D, L, or choose Debug > Windows > Locals.
In the Locals window, expand the
lettersvariable to see its array elements and their values.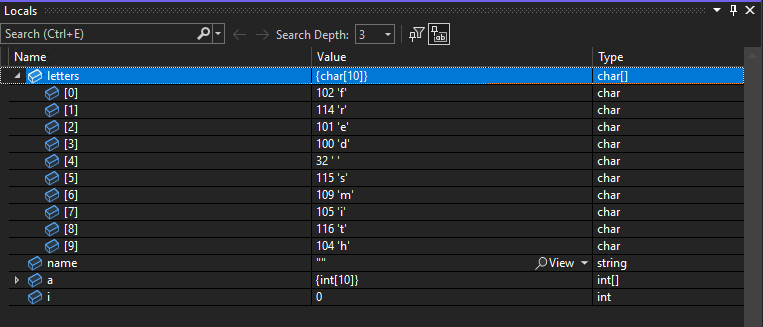
For more about the Autos and Locals windows, see Inspect variables in the Autos and Locals windows.
Set a watch
In the main code editor window, right-click the name variable and choose Add Watch.
The Watch window opens at the bottom of the code editor. You can use a Watch window to specify a variable (or an expression) that you want to keep an eye on.
Now, you have a watch set on the name variable, and you can see its value change as you move through the debugger. Unlike the other variable windows, the Watch window always shows the variables that you're watching (they're grayed out when out of scope).
You can specify a variable, or an expression, that you want to keep an eye on as you step through code—by adding it to the Watch window.
While the debugger is paused, right-click the
namevariable and choose Add Watch.The Watch window opens by default at the bottom of the code editor.
Now that you've set a watch on the
namevariable, step through your code to see the value of thenamevariable change with eachforloop iteration.Unlike the other variable windows, the Watch window always shows the variables that you're watching. Variables that are out of scope are displayed as unavailable.
For more information about the Watch window, see Watch variables with Watch windows.
Examine the call stack
While code execution is paused in the
forloop, select the Call Stack window, which is by default open in the lower right pane.If it's closed, open it while paused in the debugger by choosing Debug > Windows > Call Stack.
Select F11 a few times until you see the debugger pause in the
SendMessagemethod. Look at the Call Stack window.
The Call Stack window shows the order in which methods and functions are getting called. The top line shows the current function (the
SendMessagemethod in this app). The second line shows thatSendMessagewas called from theMainmethod, and so on.Note
The Call Stack window is similar to the Debug perspective in some IDEs like Eclipse.
The call stack is a good way to examine and understand the execution flow of an app.
You can double-click a line of code to look at that source code, which also changes the current scope under inspection by the debugger. This action doesn't advance the debugger.
You can also use right-click menus from the Call Stack window to do other things. For example, you can insert breakpoints into specified functions, advance the debugger using Run to Cursor, and go examine source code. For more information, see How to: Examine the Call Stack.
The Call Stack can help you understand the execution flow of your app, by showing the order in which methods and functions are getting called.
While the debugger is paused in the
forloop, view the Call Stack window, which opens by default in the lower right pane of the code editor.If the Call Stack window is closed, select Ctrl+D, C, or choose Debug > Windows > Call Stack from the menu bar.
In the Call Stack window, you see the yellow pointer at the current
Mainmethod.Select F11 a few times until you see the debugger pause in the
SendMessagemethod.The top line of the Call Stack window shows the current function, which is the
SendMessagemethod. The second line shows that theSendMessagemethod was called from theMainmethod.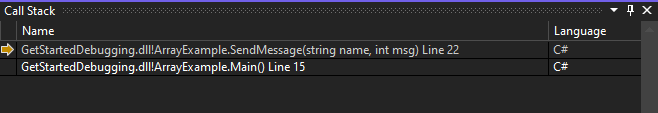
Note
The Call Stack window is similar to the Debug perspective in some IDEs, like Eclipse.
In the Call Stack window, you can double-click a line of code to go to that source code, which changes the current scope under inspection by the debugger. This action doesn't advance the debugger.
You can also use right-click menus from the Call Stack window to do other things. For example, you can insert breakpoints into specified functions, advance the debugger by using Run to Cursor, or go to source code.
For more about the Call Stack, see How to: Examine the Call Stack.
Change the execution flow
Press F11 twice to run the
Console.WriteLinemethod.With the debugger paused in the
SendMessagemethod call, use the mouse to grab the yellow arrow or execution pointer (in the left margin), and drag the pointer up one line to theConsole.WriteLinestatement.Press F11.
The debugger reruns the
Console.WriteLinemethod (you see this action in the console window output).By changing the execution flow, you can do things like test different code execution paths or rerun code without restarting the debugger.
Warning
Often you need to be careful with this feature, and you see a warning in the tooltip. You may see other warnings, too. Moving the pointer cannot revert your application to an earlier app state.
Press F5 to continue running the app.
Congratulations on completing this tutorial!
You can move the execution pointer to change the flow of your app while debugging.
With the debugger paused at the
SendMessagemethod call in theforloop, select F11 three times to step into theSendMessagemethod and to move past theConsole.WriteLinemethod after executing it.The debugger is now paused at the final closing brace of the
SendMessagemethod.Use the mouse to grab the yellow arrow or execution pointer (in the left margin), and then drag the pointer up one line.
The debugger is now back on the
Console.WriteLinestatement.Select F11.
The debugger reruns the
Console.WriteLinemethod, and you see a duplicate line in the console window output.Select F5 to continue running the app.
By changing the execution flow, you can do things like test different code execution paths or rerun code without restarting the debugger.
Warning
Use this feature with care. You'll see a warning in the tooltip of the execution pointer about the possibility of unintended consequences. You might see other warnings, too. Moving the execution pointer can't revert your application to an earlier state.
For more about the changing the execution flow, see Move the pointer to change the execution flow.
Congratulations on completing this tutorial!
Next steps
In this tutorial, you've learned how to start the debugger, step through code, and inspect variables. You might want to get a high-level look at debugger features along with links to more information.
Feedback
Kommer snart: Under hela 2024 kommer vi att fasa ut GitHub-problem som feedbackmekanism för innehåll och ersätta det med ett nytt feedbacksystem. Mer information finns i: https://aka.ms/ContentUserFeedback.
Skicka och visa feedback för