Direct connectivity issues in Power Automate for desktop
This article provides more information about how to resolve the direct connectivity issues in Microsoft Power Automate for desktop.
Applies to: Power Automate
Original KB number: 5016345
Symptoms
Consider the following scenarios when using direct machine connectivity (not the data gateway, which has been deprecated for desktop flows):
Scenario 1
Your previously registered machines appear offline when they're booted up and connected to the network.
Runs fail with either of these error messages:
ConnectionNotEstablished - None of the connected listeners accepted the connections within the allowed timeout. Check that your machine is online.
NoListenerConnected - The endpoint was not found. There are no listeners connected for the endpoint. Check that your machine is online.
Scenario 2
- Desktop flows run on a registered machine as long as a user session is running (attended runs) or even for some minutes after the last user has logged off (unattended runs).
- The connection to the machine is lost after some minutes (for example, 15 minutes).
- The connection is re-established once a user logs back on to the machine.
Cause
Direct to machine connectivity uses Azure WCF relays to allow the Microsoft cloud to connect to on-premises machines and schedule desktop flow runs. The Power Automate Windows service that runs on-premises opens a relay listener that connects to the Azure cloud by opening web sockets.
The most common cause of relay connectivity issues is the machine losing connection to the network. This can be caused by your machine not being powered on or losing network when no user is signed in to the machine for instance.
The Power Automate service runs under its own Windows account (NT Service\UIFlowService by default) which must have access to the network and be able to connect to *.servicebus.windows.net (for more information, see network requirements.)
If the machine and Power Automate service have reliable access to the network, the next likeliest source of issues is the on-premises network blocking or interfering with Azure relay connections.
A common culprit in both scenarios is a network proxy that restricts outbound traffic. In particular, authenticated proxies that use the credentials of the connected Windows user, given that the Power Automate service runs under its own dedicated account.
You can refer to Proxy setup if you determine that you need to override the default proxy settings used by the Power Automate service. You may also need to change the on-premises service account.
How to investigate
To help you investigate these issues, make sure to engage your network administrators who will have the knowledge required to understand what is happening.
Understand the topology of the network: what network devices does the traffic hop through before being handed off to the public internet: NAT, firewalls, proxies and so on. Get logs from these devices during impacted runs, and logs from the outermost network device attesting that the traffic to *.servicebus.windows.net is handed off to the public internet.
Get WCF logs from UI flow service. For more information, see the Enable WCF tracing section below.
Make sure your network configuration allows web socket traffic and long-running connections: a common pattern is proxies or other network devices killing connections after a set time.
What information to include when opening a support ticket
- Your network topology: what are the devices that traffic goes through. (see the step 2 in the section above)
- Logs from your network devices showing that the traffic is indeed handed off to the public internet. Include times of the issues and the time zones used by the logs.
- WCF traces from the impacted machines. (see the Enable WCF tracing section below)
- Desktop flow run IDs of impacted runs.
- Local logs from the impacted machine: they can be extracted using the Power Automate machine runtime app's troubleshooting pane.
Enable WCF tracing
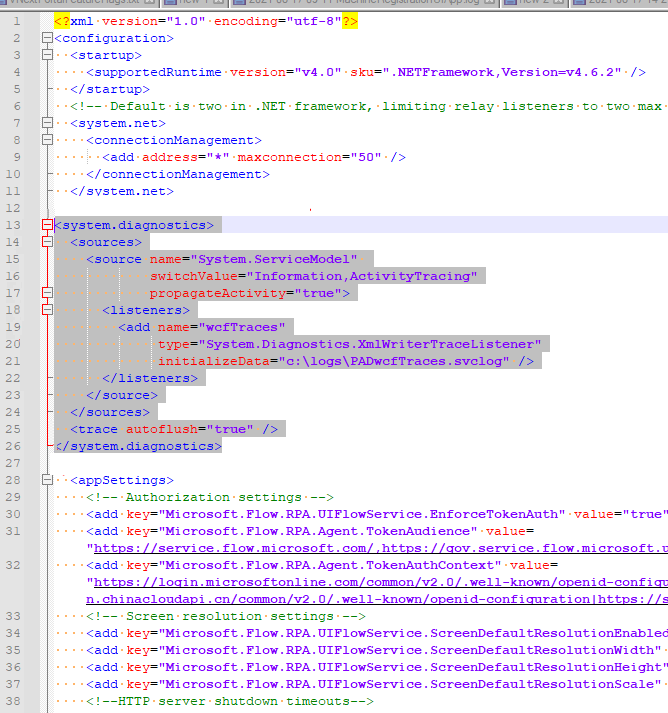
In the installation folder (typically C:\Program Files (x86)\Power Automate Desktop), edit the UIFlowService.exe.config file. This requires running your text editor as administrator.
Add this config section:
<system.diagnostics>
  <sources>
    <source name="System.ServiceModel"
            switchValue="Information,ActivityTracing"
            propagateActivity="true">
      <listeners>
        <add name="wcfTraces"
             type="System.Diagnostics.XmlWriterTraceListener"
             initializeData="c:\logs\PADwcfTraces.svclog" />
      </listeners>
    </source>
  </sources>
 <trace autoflush="true" />
</system.diagnostics>
- You can substitute the
c:\logs\PADwcfTraces.svclogvalue with any valid path you'd like but the folder (c:\logsin this example) must exist, otherwise it won't be created and logs won't be written. - The Power Automate service must have permission to write in the chosen folder, granting the 'Everyone' user full control over the folder works. You can get the service user's Sid by running
sc showsid UIFlowServicein a command line if you want to give permissions to only that user.
This config section needs to be added between </system.net> and <appSettings>, see the following screenshot:
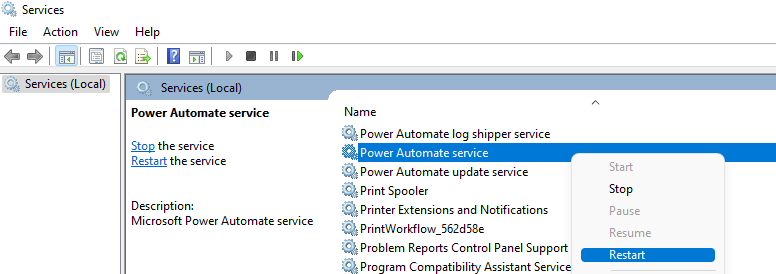
After saving the config file, restart the Power Automate service. This can be done in the Services tool. The tool can be found by typing services in the start menu, finding Power Automate Service, right-clicking it and choosing Restart. The following screenshot shows the step to restart the Power Automate service:
Traces will then be written to the file chosen in the config.
คำติชม
เร็วๆ นี้: ตลอดปี 2024 เราจะขจัดปัญหา GitHub เพื่อเป็นกลไกคำติชมสำหรับเนื้อหา และแทนที่ด้วยระบบคำติชมใหม่ สำหรับข้อมูลเพิ่มเติม ให้ดู: https://aka.ms/ContentUserFeedback
ส่งและดูข้อคิดเห็นสำหรับ