กิจกรรม
9 เม.ย. 15 - 10 เม.ย. 12
JDConf 2025 เขียนโค้ดอนาคตด้วย AI และเชื่อมต่อกับ Java peers และผู้เชี่ยวชาญที่ JDConf 2025
ลงทะเบียนทันทีเบราว์เซอร์นี้ไม่ได้รับการสนับสนุนอีกต่อไป
อัปเกรดเป็น Microsoft Edge เพื่อใช้ประโยชน์จากคุณลักษณะล่าสุด เช่น การอัปเดตความปลอดภัยและการสนับสนุนด้านเทคนิค
Using diagnostic settings in Microsoft Entra ID, you can integrate logs with Azure Monitor, stream logs to an event hub, or archive logs to a storage account. You can create multiple diagnostic settings to send activity logs to different destinations.
This article provides the steps to configure Microsoft Entra diagnostic settings for activity logs.
To configure diagnostic settings, you need:
This article provides the steps to access diagnostic settings for the Microsoft Entra logs. If you need to configure diagnostic settings for Azure Monitor or Azure resources outside of Microsoft Entra ID, see Diagnostic settings in Azure Monitor.
Sign in to the Microsoft Entra admin center as at least a Security Administrator.
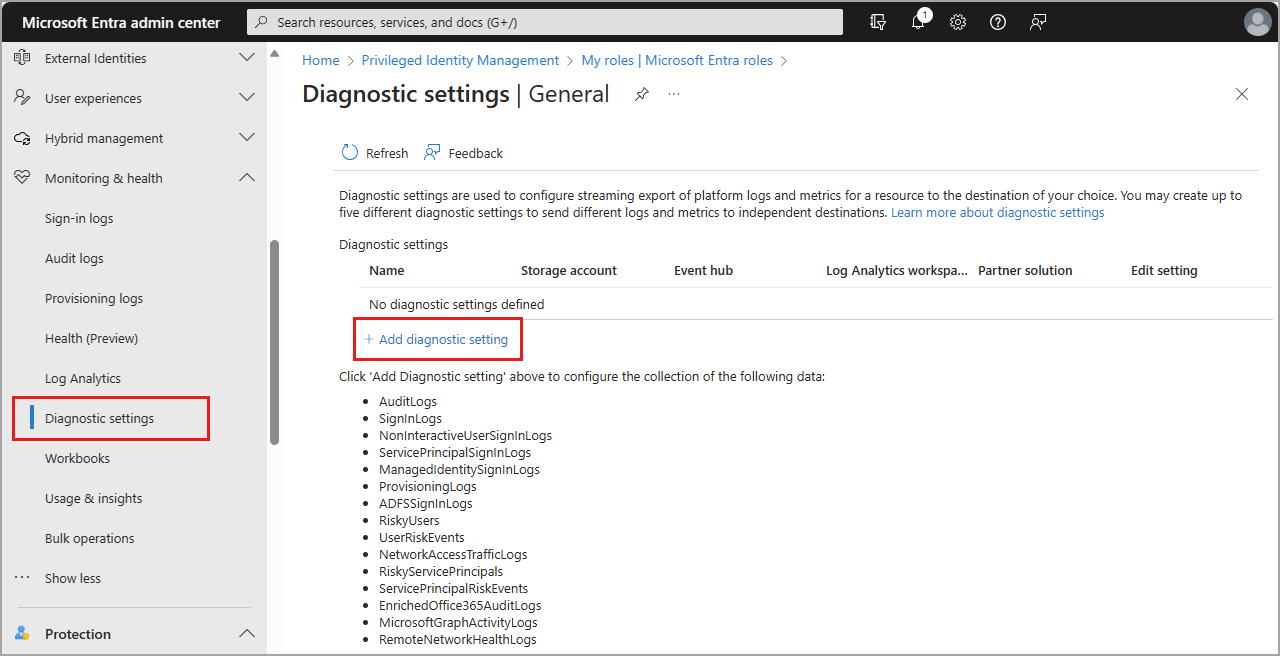
Browse to Identity > Monitoring & health > Diagnostic settings. The General settings appear by default.
Any existing diagnostic settings appear in the table. Select edit settings to change an existing setting, or select Add diagnostic setting to create a new setting.
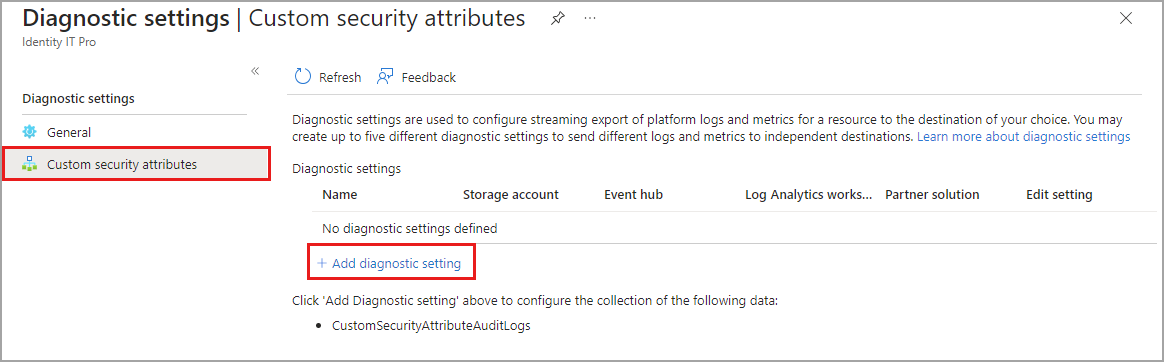
The custom security attributes logs are a subset of the standard audit logs. You must have the Attribute Log Administrator role active to configure diagnostic settings for the custom security attributes. For more information, see Custom security attributes overview.
To configure diagnostic settings for the custom security attribute audit logs, select Custom security attributes. The process to configure diagnostic settings is the same for both categories of logs.
เคล็ดลับ
Microsoft recommends that you keep your custom security attribute audit logs separate from your directory audit logs so that attribute assignments are not revealed inadvertently.
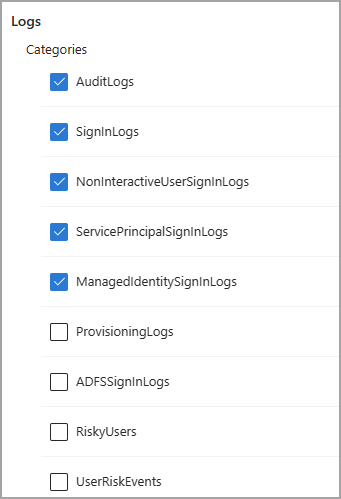
When you create or edit a diagnostic setting, you can choose which logs to include and where to send them.
You can select one, some, or all of the available logs. Some logs might be part of a preview feature. Even if you select a log category, you might not see any data until the feature is generally available. For a description of the available logs, see Log options for streaming to endpoints.
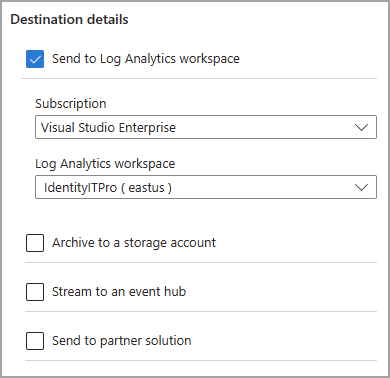
You can send logs to a Log Analytics workspace, stream logs to an event hub, or archive logs to a storage account. Through Azure Native ISV services, you can send logs to services through the Azure Marketplace. For more information, see Azure Native ISV services overview.
You must have a destination set up prior to configuring diagnostic settings.
When you select a destination, more fields appear. Select the appropriate subscription and destination from the fields that appear.
For details on configuring diagnostic settings for a specific destination, see the following articles:
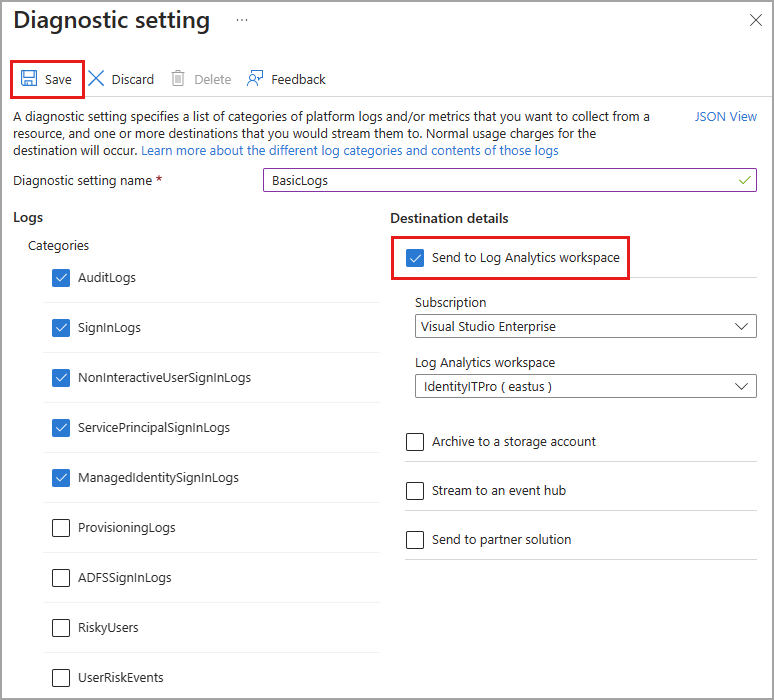
The basic steps for configuring diagnostics settings are as follows:
To create a new diagnostic setting, select Add diagnostic setting.
Provide a name.
Select the logs you want to include.
Select the destination.
Select the subscription and the destination from the dropdown menus that appear.
Select the Save button.
หมายเหตุ
It might take up to three days for the logs to start appearing in the destination.
กิจกรรม
9 เม.ย. 15 - 10 เม.ย. 12
JDConf 2025 เขียนโค้ดอนาคตด้วย AI และเชื่อมต่อกับ Java peers และผู้เชี่ยวชาญที่ JDConf 2025
ลงทะเบียนทันทีการฝึกอบรม
โมดูล
Monitor and maintain Microsoft Entra ID - Training
Audit and diagnostic logs within Microsoft Entra ID provide a rich view into how users are accessing your Azure solution. Learn to monitor, troubleshoot, and analyze sign-in data.
ใบรับรอง
รับรองโดย Microsoft: การเชื่อมโยงผู้ดูแลระบบข้อมูลประจําตัวและการเข้าถึง - Certifications
แสดงให้เห็นถึงคุณลักษณะของ Microsoft Entra ID เพื่อปรับโซลูชันข้อมูลประจําตัวให้ทันสมัย ใช้โซลูชันแบบไฮบริด และใช้การกํากับดูแลข้อมูลประจําตัว