Organizational data for Viva Insights
Important
This article is for the legacy Workplace Analytics app and does not reflect functionality available on the updated Viva Insights platform. Access current documentation for Viva Insights advanced insights here: advanced insights documentation.
Organizational data is information about your company that your admins provide to the advanced insights app with Microsoft Viva Insights. The admin either uploads your organizational (HR) data or Viva Insights can use the organizational data that's presented in Microsoft Entra ID.
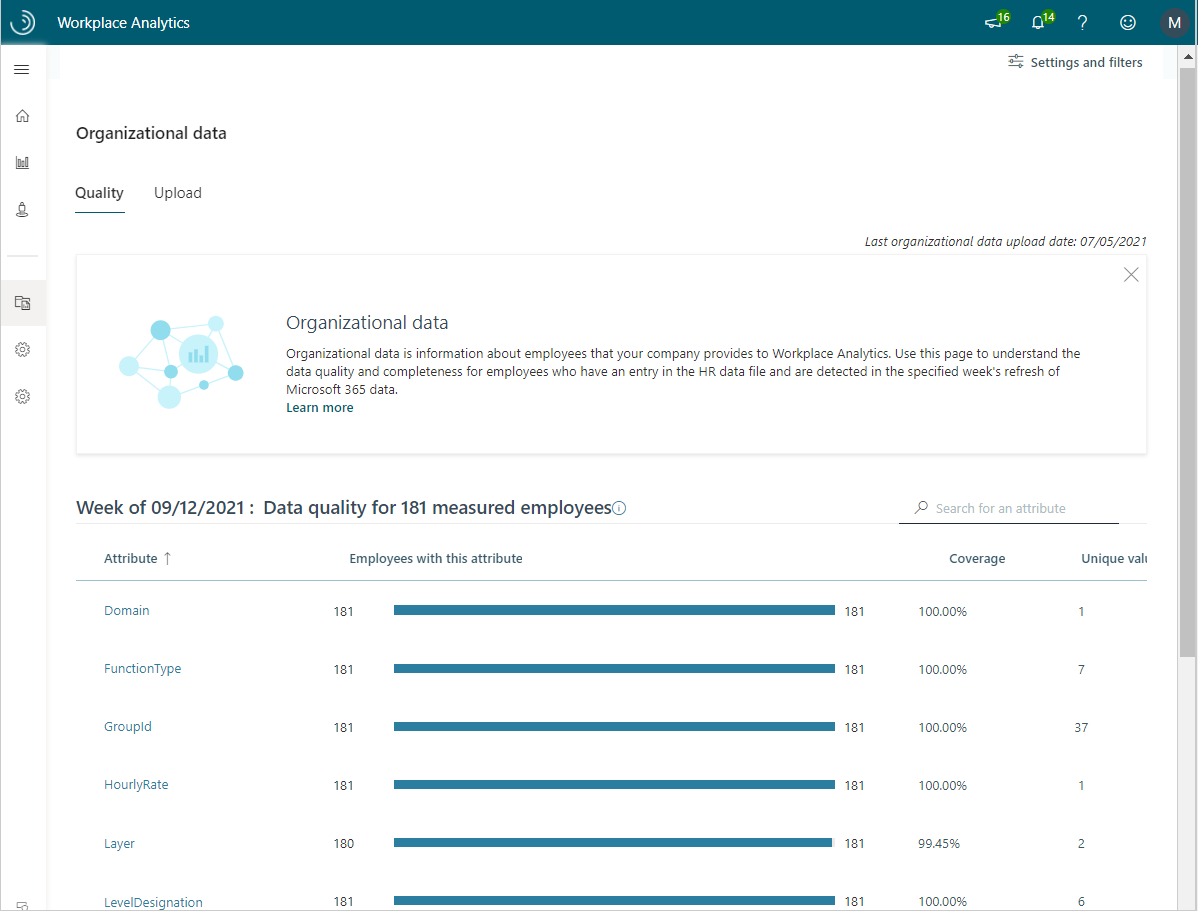
As either an admin or an analyst, you can use this page to understand the data quality and completeness of it in the specified week's refresh of Microsoft 365 data.
Organizational data includes the following:
- Page settings (Settings and filters) - Use the Page settings panel to the right of the page to change the Group by increments of time (day, week, or month) and which employees to include (all employees, internal collaborators, or measured employees) in the data shown. You can also use the Page setting Filters to filter the employee data shown on this page by a specific attribute, such as to only show employees in the sales or development groups.
- Attributes - These are all the attributes provided by your organization in the organizational or HR data upload file. When you create queries, you can filter and group employees in the organization by these attributes, so being familiar with them will give you insight into the types of queries to use for analysis.
- Employees with attribute - The number of measured employees and internal collaborators with a non-blank value for the attribute.
- Coverage - The percentage of measured employees who have a non-blank value for the specified attribute. If coverage levels are low, it'll be difficult to determine how people collaborate across different characteristics. Additionally, low coverage on required attributes may give skewed (under-reported) metric calculations for metrics that rely on those attributes.
- Unique values - The count of the unique attribute values included in the data. For example, if the Region attribute contains North, South, Central, East, West and Southwest, its unique values count is six.
Note
You can select a column name to sort the list by it in descending or ascending order. You can also type a keyword in the Search field to narrow the list to all attributes that contain that keyword.
Attribute details
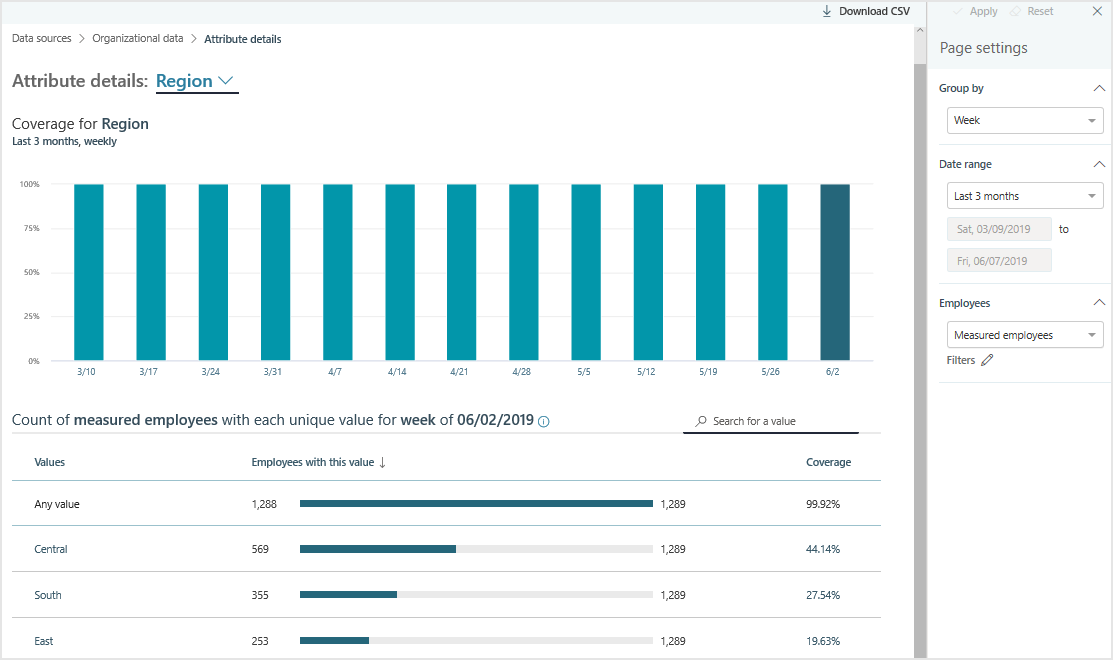
To view a list of the top 500 values for an attribute and other details about it, select the attribute's name in the list. For example, the following graphic shows the top values and details for Region.
Attribute details include the following:
- Page settings (Settings and filters) - Use the Page settings panel to the right of the page to change the Group by increments of time (day, week, or month), the date range, and what employees to include (all employees, internal collaborators, or measured employees) in the data shown. You can also use the Page setting Filters to filter the employee data shown on this page by a specific attribute, such as to only show employees in the sales or development groups.
- Coverage for - Shows a chart with the coverage of the selected attribute at different moments in time. This historical data gives insight into how the data for this attribute has changed over time and what date ranges will be useful for analysis. Select a bar in the chart to see the details for that date in the table.
- Values - Lists all values that exist for the selected attribute that were included in the uploaded organizational data for the selected date. When you create queries, you can filter and group accounts with a few of these attributes, so being familiar with these gives you insight into what types of queries will be useful for analysis.
- Employees with this value - Shows the number of people that have that attribute value in the data. For example, the following graphic shows the number of contacts that have a non-blank value for the selected attribute.
- Coverage - Shows the percentage of employees with that value.
Note
Next to Attribute details, you can select a different attribute to change the focus of the details to it. Also, only the first 500 values are shown in this page's table. If the selected attribute has more than 500 values, you can select Download CSV to view the complete list of attribute values and details for those with more than 500 values in the downloaded .csv file.
For more details about what data is needed for metric calculations, see: