Sự kiện
Giải vô địch thế giới Power BI DataViz
16 giờ 14 thg 2 - 16 giờ 31 thg 3
Với 4 cơ hội tham gia, bạn có thể giành được gói hội nghị và lọt vào Chung kết TRỰC TIẾP ở Las Vegas
Tìm hiểu thêmTrình duyệt này không còn được hỗ trợ nữa.
Hãy nâng cấp lên Microsoft Edge để tận dụng các tính năng mới nhất, bản cập nhật bảo mật và hỗ trợ kỹ thuật.
Model view shows all of the tables, columns, and relationships in your model. This view can be especially helpful when your model has complex relationships between many tables.
Select the Model view icon near the side of the window to see a view of the existing model. Hover your cursor over a relationship line to show the columns used.

In the image, the Connections table has a Seat ID column that’s related to the Unique Seats table, which also has a seatId column. The two tables have a Many to One (*:1) relationship. An arrow in the middle of the line shows the direction of the filter context flow. Double arrows would mean the cross-filter direction is set to Both.
You can double-click a relationship to open it in the Edit relationship dialog box. For more information about relationships, see Create and manage relationships in Power BI Desktop.
Current releases of Power BI Desktop have the updated Model view enabled.

The colors in the table card headers automatically match the colors you've selected in any report theme you're using. If the color is too close to white, Model view doesn't use it in the theme headers to avoid situations where it's difficult to differentiate tables in dual mode. In the previous image the card headers are white; if the report theme was using blue, the card headers in the Model view shown in the previous image would be blue instead of white.
If your model has fewer than 75 tables, Model view shows all of your tables. If your model has more than 75 tables, instead of showing all tables you see the following image:
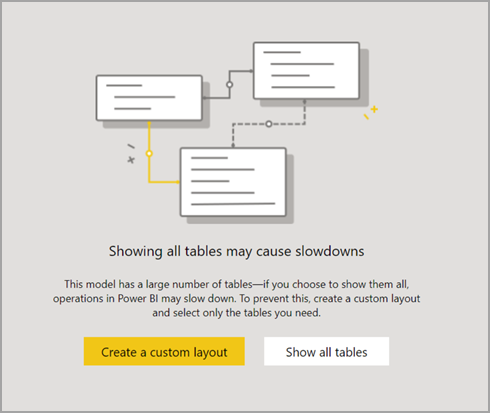
When your model has more than 75 tables, Power BI Desktop warns you that slowdowns might occur. Create a custom layout (select the Create a custom layout button) to reduce the significant CPU and memory used when Model view shows more than 75 tables.
There are all sorts of things you can do with Power BI Desktop. For more information on data sources, see the following resources:
Sự kiện
Giải vô địch thế giới Power BI DataViz
16 giờ 14 thg 2 - 16 giờ 31 thg 3
Với 4 cơ hội tham gia, bạn có thể giành được gói hội nghị và lọt vào Chung kết TRỰC TIẾP ở Las Vegas
Tìm hiểu thêmĐào tạo
Mô-đun
Model data in Power BI - Training
Connect Power BI to multiple data sources to create reports. Define the relationship between your data sources.
Chứng chỉ
Được Microsoft Chứng nhận: Liên kết Phân tích Dữ liệu Power BI - Certifications
Thể hiện các phương pháp và thực tiễn tốt nhất phù hợp với yêu cầu kỹ thuật và kinh doanh để lập mô hình, trực quan hóa và phân tích dữ liệu với Microsoft Power BI.
Tài liệu
Create and manage relationships in Power BI Desktop - Power BI
Learn how to create and manage relationships in Power BI Desktop using autodetect and manual methods.
Use Model view in Power BI Desktop - Power BI
Learn how to use Model view to see and work with complex semantic models in a visual format in Power BI Desktop.
Quick measure suggestions with Copilot - Power BI
Suggestions with Copilot to help the creation of DAX measures using natural language, making it easier and faster to generate DAX formulas.