你当前正在访问 Microsoft Azure Global Edition 技术文档网站。 如果需要访问由世纪互联运营的 Microsoft Azure 中国技术文档网站,请访问 https://docs.azure.cn。
启用对 Kubernetes 群集的监视
本文介绍如何使用以下 Azure Monitor 功能启用 Kubernetes 群集的完整监视:
- 用于指标收集的托管 Prometheus
- 用于日志收集的容器见解
- 用于可视化效果的托管 Grafana。
使用 Azure 门户,可以同时启用所有这些功能。 还可以使用 Azure CLI、Azure 资源管理器模板、Terraform 或 Azure Policy 单独启用它们。 本文介绍了上述每种方法。
重要
Kubernetes 群集会生成大量日志数据,如果你对收集的日志没有选择性,可能会导致高昂的成本。 在启用群集监视之前,请参阅以下文章,以确保环境针对成本进行了优化,并将日志收集限制为仅收集所需的数据:
- 使用数据收集规则在容器见解中配置数据收集和成本优化
有关启用监视后自定义日志收集的详细信息,包括使用预设的成本优化配置。 - 使用 Azure Monitor 监视 Kubernetes 的最佳做法
有关监视按 Azure 架构良好的框架的五个支柱组织的 Kubernetes 群集的最佳做法,包括成本优化。 - Azure Monitor 中的成本优化
有关配置 Azure Monitor 所有功能以优化成本并限制收集的数据量的最佳做法。
支持的群集
本文就以下类型的群集提供加入指南。 相关部分中介绍了每种类型过程中的任何差异。
先决条件
权限
托管 Prometheus 先决条件
- 群集必须使用托管标识身份验证。
- 必须在 AKS 群集和 Azure Monitor 工作区的订阅中注册以下资源提供程序:
- Microsoft.ContainerService
- Microsoft.Insights
- Microsoft.AlertsManagement
- Microsoft.Monitor
- 必须在 Grafana 工作区订阅的订阅中注册以下资源提供程序:
- Microsoft.Dashboard
已启用 Arc 的 Kubernetes 群集先决条件
- 已启用 Azure Arc 的 Kubernetes 群集扩展先决条件。
- 除了已启用 Azure Arc 的 Kubernetes 网络要求,还请验证防火墙要求。
- 如果以前为 AKS 安装了监视,请务必禁用监视后再继续,以免在扩展安装过程中出现问题。
- 如果以前在没有群集扩展的情况下使用脚本在群集上安装监视,请按照禁用对 Kubernetes 群集的监视的说明来删除此 Helm chart。
注意
托管 Prometheus 已启用 Arc 的 Kubernetes 扩展不支持以下配置:
- Red Hat Openshift 分发版
- Windows 节点
工作区
下表描述了支持托管 Prometheus 和容器见解所需的工作区。 可在加入过程中创建每个工作区,或者使用现有工作区。 请参阅设计 Log Analytics 工作区体系结构,获取有关要创建多少个工作区以及应在何处放置工作区的指导。
| 功能 | 工作区 | 说明 |
|---|---|---|
| 托管 Prometheus | Azure Monitor 工作区 | Contributor 权限足以允许加载项将数据发送到 Azure Monitor 工作区。 若要链接 Azure Monitor 工作区以查看 Azure 托管 Grafana 中的指标,则需要 Owner 级别权限。 这是必需的,因为执行加入步骤的用户需要在 Azure Monitor 工作区上授予 Azure 托管 Grafana 系统标识 Monitoring Reader 角色才能查询指标。 |
| 容器见解 | Log Analytics 工作区 | 可以将 AKS 群集附加到同一 Microsoft Entra 租户的不同 Azure 订阅中的 Log Analytics 工作区,但必须使用 Azure CLI 或 Azure 资源管理器模板。 目前不能使用 Azure 门户执行此配置。 如果要将现有的 AKS 群集连接到其他订阅中的 Log Analytics 工作区,则必须在具有 Log Analytics 工作区的订阅中注册 Microsoft.ContainerService 资源提供程序。 有关详细信息,请参阅注册资源提供程序。 有关用于默认工作区的受支持映射对的列表,请参阅容器见解支持的区域映射。 |
| 托管 Grafana | Azure 托管 Grafana 工作区 | 将 Grafana 工作区链接到 Azure Monitor 工作区,以使从群集收集的 Prometheus 指标可供 Grafana 仪表板使用。 |
启用 Prometheus 和 Grafana
使用以下方法之一可以从群集中抓取 Prometheus 指标,并启用 Managed Grafana 来可视化指标。 有关连接 Azure Monitor 工作区和 Azure 托管 Grafana 工作区的选项,请参阅链接 Grafana 工作区。
如果未在以下命令中指定现有的 Azure Monitor 工作区,则将使用资源组的默认工作区。 如果群集区域中尚不存在默认工作区,则将在资源组中创建一个名为 DefaultRG-<cluster_region> 的 DefaultAzureMonitorWorkspace-<mapped_region> 格式的名称。
先决条件
- 需要 Az CLI 2.49.0 或更高版本。
- 必须使用
az extension remove --name aks-preview命令从 AKS 群集中卸载 aks-preview 扩展。 - 必须使用
az extension add --name k8s-extension命令安装 k8s-extension 扩展。 - 需要 k8s-extension 版本 1.4.1 或更高版本。
AKS 群集
使用 -enable-azure-monitor-metrics 选项 az aks create 或 az aks update(具体取决于是要创建新群集还是要更新现有群集)来安装用于擦除 Prometheus 指标的指标加载项。
示例命令
### Use default Azure Monitor workspace
az aks create/update --enable-azure-monitor-metrics -n <cluster-name> -g <cluster-resource-group>

### Use existing Azure Monitor workspace
az aks create/update --enable-azure-monitor-metrics -n <cluster-name> -g <cluster-resource-group> --azure-monitor-workspace-resource-id <workspace-name-resource-id>

### Use an existing Azure Monitor workspace and link with an existing Grafana workspace
az aks create/update --enable-azure-monitor-metrics -n <cluster-name> -g <cluster-resource-group> --azure-monitor-workspace-resource-id <azure-monitor-workspace-name-resource-id> --grafana-resource-id  <grafana-workspace-name-resource-id>

### Use optional parameters
az aks create/update --enable-azure-monitor-metrics -n <cluster-name> -g <cluster-resource-group> --ksm-metric-labels-allow-list "namespaces=[k8s-label-1,k8s-label-n]" --ksm-metric-annotations-allow-list "pods=[k8s-annotation-1,k8s-annotation-n]"
已启用 Arc 的群集
### Use default Azure Monitor workspace
az k8s-extension create --name azuremonitor-metrics --cluster-name <cluster-name> --resource-group <resource-group> --cluster-type connectedClusters --extension-type Microsoft.AzureMonitor.Containers.Metrics

## Use existing Azure Monitor workspace
az k8s-extension create --name azuremonitor-metrics --cluster-name <cluster-name> --resource-group <resource-group> --cluster-type connectedClusters --extension-type Microsoft.AzureMonitor.Containers.Metrics --configuration-settings azure-monitor-workspace-resource-id=<workspace-name-resource-id>

### Use an existing Azure Monitor workspace and link with an existing Grafana workspace
az k8s-extension create --name azuremonitor-metrics --cluster-name <cluster-name> --resource-group <resource-group> --cluster-type connectedClusters --extension-type Microsoft.AzureMonitor.Containers.Metrics --configuration-settings azure-monitor-workspace-resource-id=<workspace-name-resource-id> grafana-resource-id=<grafana-workspace-name-resource-id>

### Use optional parameters
az k8s-extension create --name azuremonitor-metrics --cluster-name <cluster-name> --resource-group <resource-group> --cluster-type connectedClusters --extension-type Microsoft.AzureMonitor.Containers.Metrics --configuration-settings azure-monitor-workspace-resource-id=<workspace-name-resource-id> grafana-resource-id=<grafana-workspace-name-resource-id> AzureMonitorMetrics.KubeStateMetrics.MetricAnnotationsAllowList="pods=[k8s-annotation-1,k8s-annotation-n]" AzureMonitorMetrics.KubeStateMetrics.MetricLabelsAllowlist "namespaces=[k8s-label-1,k8s-label-n]"
任何命令都可以使用以下可选参数:
- AKS:
--ksm-metric-annotations-allow-list
Arc:--AzureMonitorMetrics.KubeStateMetrics.MetricAnnotationsAllowList
在资源的 kube_resource_annotations 指标中使用的 Kubernetes 注释键的逗号分隔列表。 例如,kube_pod_annotations 是 Pod 资源的注释指标。 默认情况下,此指标仅包含名称和命名空间标签。 若要包含更多注释,请提供资源名称(复数形式)和要允许使用的 Kubernetes 注释键的列表。 可为每个资源提供一个*以允许任何注释,但这会严重影响性能。 例如pods=[kubernetes.io/team,...],namespaces=[kubernetes.io/team],...。 - AKS:
--ksm-metric-labels-allow-list
Arc:--AzureMonitorMetrics.KubeStateMetrics.MetricLabelsAllowlist
在资源的 kube_resource_labels 指标中使用的更多 Kubernetes 标签键的逗号分隔列表。 例如,kube_pod_labels 是 Pod 资源的标签指标。 默认情况下,此指标仅包含名称和命名空间标签。 若要包含更多标签,请提供一个复数形式的资源名称列表以及想要允许这些资源使用的 Kubernetes 标签键。可为每个资源提供一个*以允许任何标签,但这会严重影响性能。 例如pods=[app],namespaces=[k8s-label-1,k8s-label-n,...],...。 - AKS:
--enable-windows-recording-rules允许启用 Windows 仪表板正常运行所需的记录规则组。
启用容器见解
按照下述方法之一在群集中启用容器见解。 完成此操作后,请参阅配置容器见解的代理数据收集来自定义配置,确保收集的数据量不超过所需的量。
使用下述命令之一来启用对 AKS 和已启用 Arc 的群集的监视。 如果未指定现有的 Log Analytics 工作区,将使用资源组的默认工作区。 如果群集区域中尚不存在默认工作区,会使用 DefaultWorkspace-<GUID>-<Region> 格式的名称创建一个工作区。
先决条件
- Azure CLI 版本 2.43.0 或更高版本
- 托管标识身份验证是 CLI 版本 2.49.0 或更高版本中的默认设置。
- Azure k8s-extension 版本 1.3.7 或更高版本
- 托管标识身份验证是 k8s-extension 版本 1.43.0 或更高版本中的默认设置。
- 使用 ARO (Azure Red Hat Openshift) 或 Windows 节点且已启用 Arc 的 Kubernetes 群集不支持托管标识身份验证。 使用旧式身份验证。
- 对于 CLI 2.54.0 或更高版本,会使用 ConfigMap 将日志记录架构将配置为 ContainerLogV2。
AKS 群集
### Use default Log Analytics workspace
az aks enable-addons -a monitoring -n <cluster-name> -g <cluster-resource-group-name>

### Use existing Log Analytics workspace
az aks enable-addons -a monitoring -n <cluster-name> -g <cluster-resource-group-name> --workspace-resource-id <workspace-resource-id>
示例
az aks enable-addons -a monitoring -n "my-cluster" -g "my-resource-group" --workspace-resource-id "/subscriptions/my-subscription/resourceGroups/my-resource-group/providers/Microsoft.OperationalInsights/workspaces/my-workspace"
已启用 Arc 的群集
### Use default Log Analytics workspace
az k8s-extension create --name azuremonitor-containers --cluster-name <cluster-name> --resource-group <resource-group> --cluster-type connectedClusters --extension-type Microsoft.AzureMonitor.Containers

### Use existing Log Analytics workspace
az k8s-extension create --name azuremonitor-containers --cluster-name <cluster-name> --resource-group <resource-group> --cluster-type connectedClusters --extension-type Microsoft.AzureMonitor.Containers --configuration-settings logAnalyticsWorkspaceResourceID=<workspace-resource-id>

### Use managed identity authentication (default as k8s-extension version 1.43.0)
az k8s-extension create --name azuremonitor-containers --cluster-name <cluster-name> --resource-group <resource-group> --cluster-type connectedClusters --extension-type Microsoft.AzureMonitor.Containers --configuration-settings amalogs.useAADAuth=true

### Use advanced configuration settings
az k8s-extension create --name azuremonitor-containers --cluster-name <cluster-name> --resource-group <resource-group> --cluster-type connectedClusters --extension-type Microsoft.AzureMonitor.Containers --configuration-settings  amalogs.resources.daemonset.limits.cpu=150m amalogs.resources.daemonset.limits.memory=600Mi amalogs.resources.deployment.limits.cpu=1 amalogs.resources.deployment.limits.memory=750Mi

### With custom mount path for container stdout & stderr logs
### Custom mount path not required for Azure Stack Edge version > 2318. Custom mount path must be /home/data/docker for Azure Stack Edge cluster with version <= 2318
az k8s-extension create --name azuremonitor-containers --cluster-name <cluster-name> --resource-group <resource-group> --cluster-type connectedClusters --extension-type Microsoft.AzureMonitor.Containers --configuration-settings amalogs.logsettings.custommountpath=<customMountPath>
请参阅 Helm 图表的资源请求和限制部分,了解可用的配置设置。
示例
az k8s-extension create --name azuremonitor-containers --cluster-name "my-cluster" --resource-group "my-resource-group" --cluster-type connectedClusters --extension-type Microsoft.AzureMonitor.Containers --configuration-settings logAnalyticsWorkspaceResourceID="/subscriptions/my-subscription/resourceGroups/my-resource-group/providers/Microsoft.OperationalInsights/workspaces/my-workspace"
具有前向代理的已启用 Arc 的群集
如果群集配置了正向代理,则代理设置会自动应用于扩展。 对于使用 AMPLS + 代理的群集,应忽略代理配置。 使用配置设置 amalogs.ignoreExtensionProxySettings=true 加入扩展。
az k8s-extension create --name azuremonitor-containers --cluster-name <cluster-name> --resource-group <resource-group> --cluster-type connectedClusters --extension-type Microsoft.AzureMonitor.Containers --configuration-settings amalogs.ignoreExtensionProxySettings=true
具有 ARO、OpenShift 或 Windows 节点的已启用 Arc 的群集
具有 ARO (Azure Red Hat Openshift) 或 Openshift 或 Windows 节点且已启用 Arc 的 Kubernetes 群集不支持托管标识身份验证。 通过指定 amalogs.useAADAuth=false 来使用旧式身份验证,如以下示例所示。
az k8s-extension create --name azuremonitor-containers --cluster-name <cluster-name> --resource-group <resource-group> --cluster-type connectedClusters --extension-type Microsoft.AzureMonitor.Containers --configuration-settings amalogs.useAADAuth=false
删除扩展实例
以下命令仅删除扩展实例,但不删除 Log Analytics 工作区。 Log Analytics 资源中的数据保持不变。
az k8s-extension delete --name azuremonitor-containers --cluster-type connectedClusters --cluster-name <cluster-name> --resource-group <resource-group>
使用 Azure 门户启用完整监视
使用 Azure 门户,可以同时启用托管 Prometheus 和容器见解。
注意
如果要在不启用容器见解的情况下启用托管 Prometheus,可在 Azure Monitor 工作区中启用它,如下所述。
新的 AKS 群集(Prometheus 和容器见解)
在 Azure 门户中创建新的 AKS 群集时,可以从“集成”选项卡启用 Prometheus、容器见解和 Grafana。在 Azure Monitor 部分中,如果想指定要使用的工作区,请选择“默认配置”或“自定义配置”。 创建群集后,可以执行其他配置。

现有群集(Prometheus 和容器见解)
此选项为现有 AKS 群集启用容器见解以及可选的 Prometheus 和 Grafana。
从群集菜单中选择“见解”,或者从“监视”菜单中“未受监视的群集”选项卡选择“容器”,然后单击群集旁边的“启用”。
- 如果未为群集启用容器见解,则会看到一个用于标识已启用功能的屏幕。 单击“配置监视”。
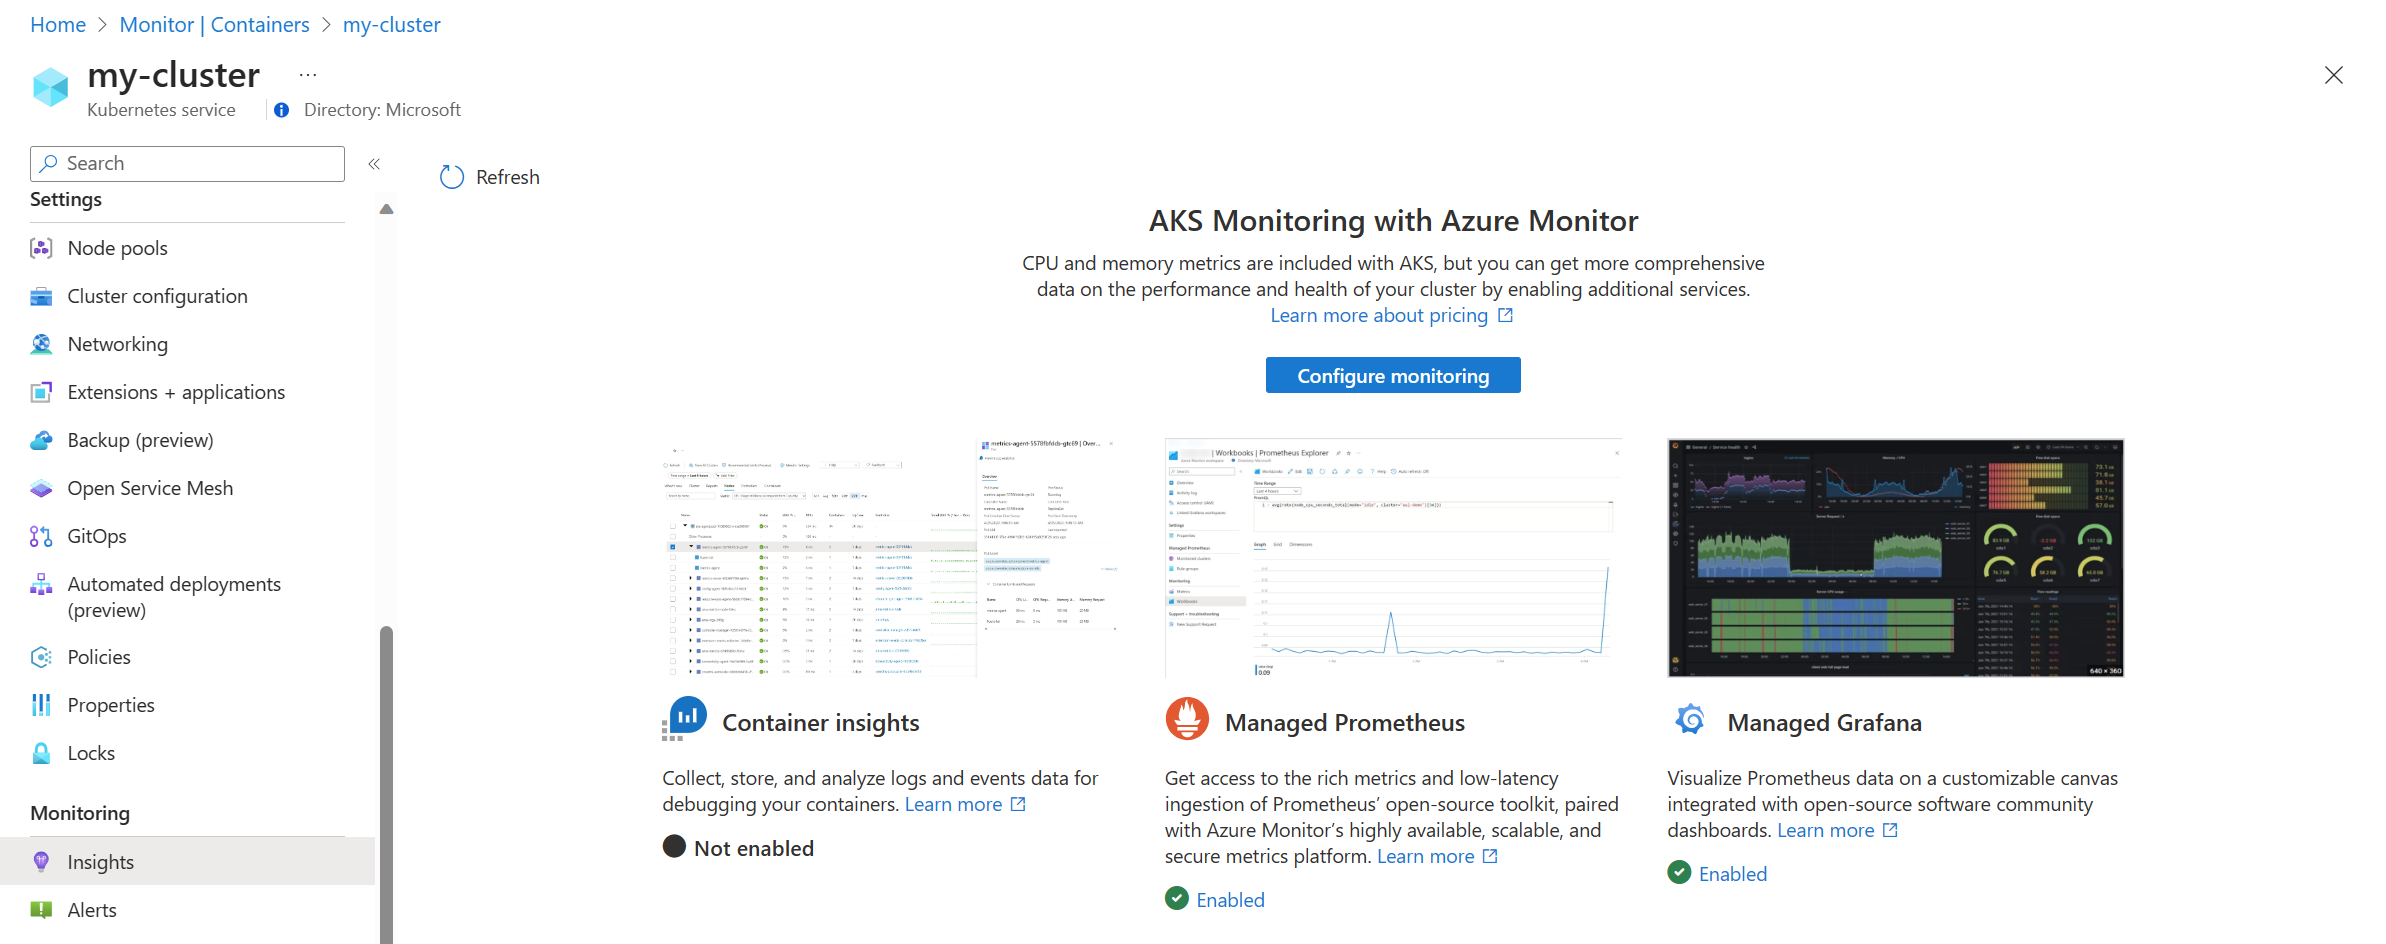
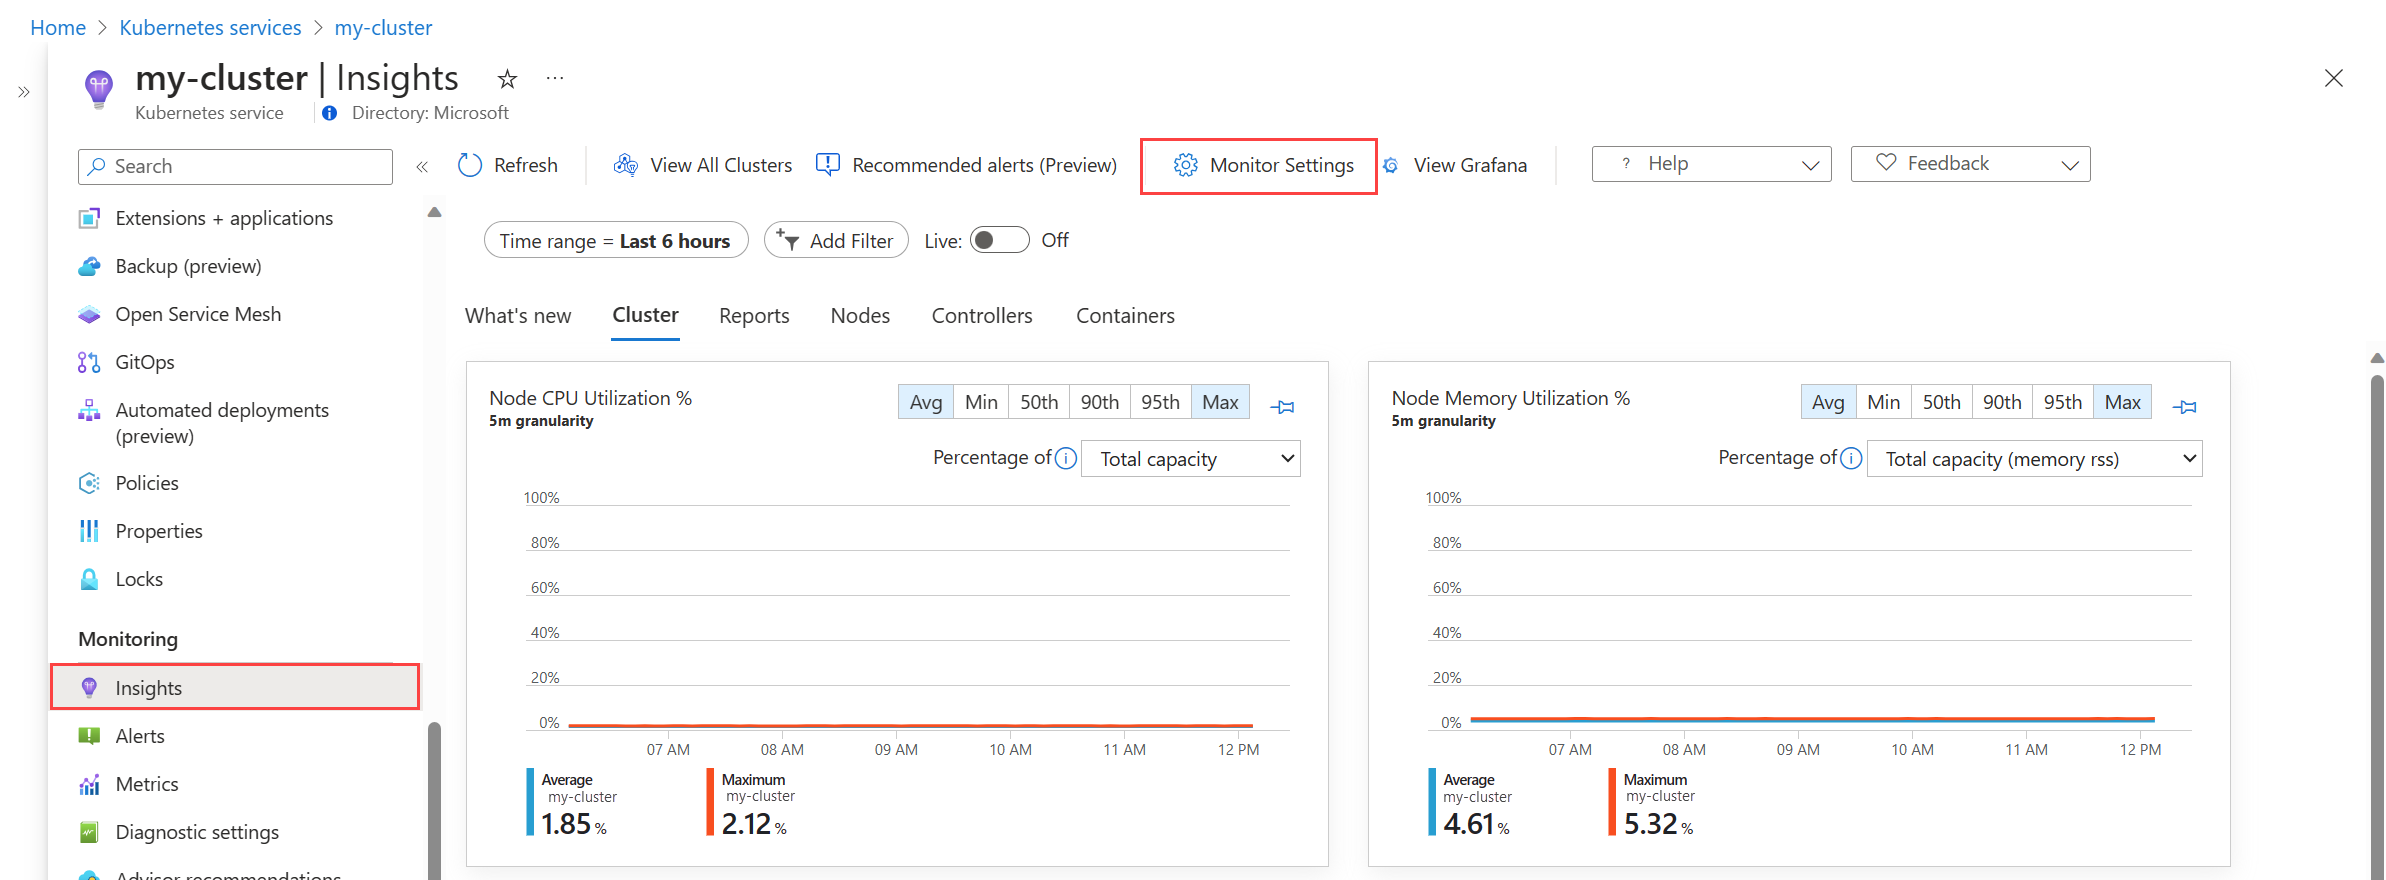
- 如果群集上已启用容器见解,请选择“监视设置”按钮修改配置。
此时会启用“容器见解”。 选中“启用 Prometheus 指标”和“启用 Grafana”复选框,前提是你还想为群集启用这些项。 如果有现有的 Azure Monitor 工作区和 Grafana 工作区,则系统会为你选择它们。
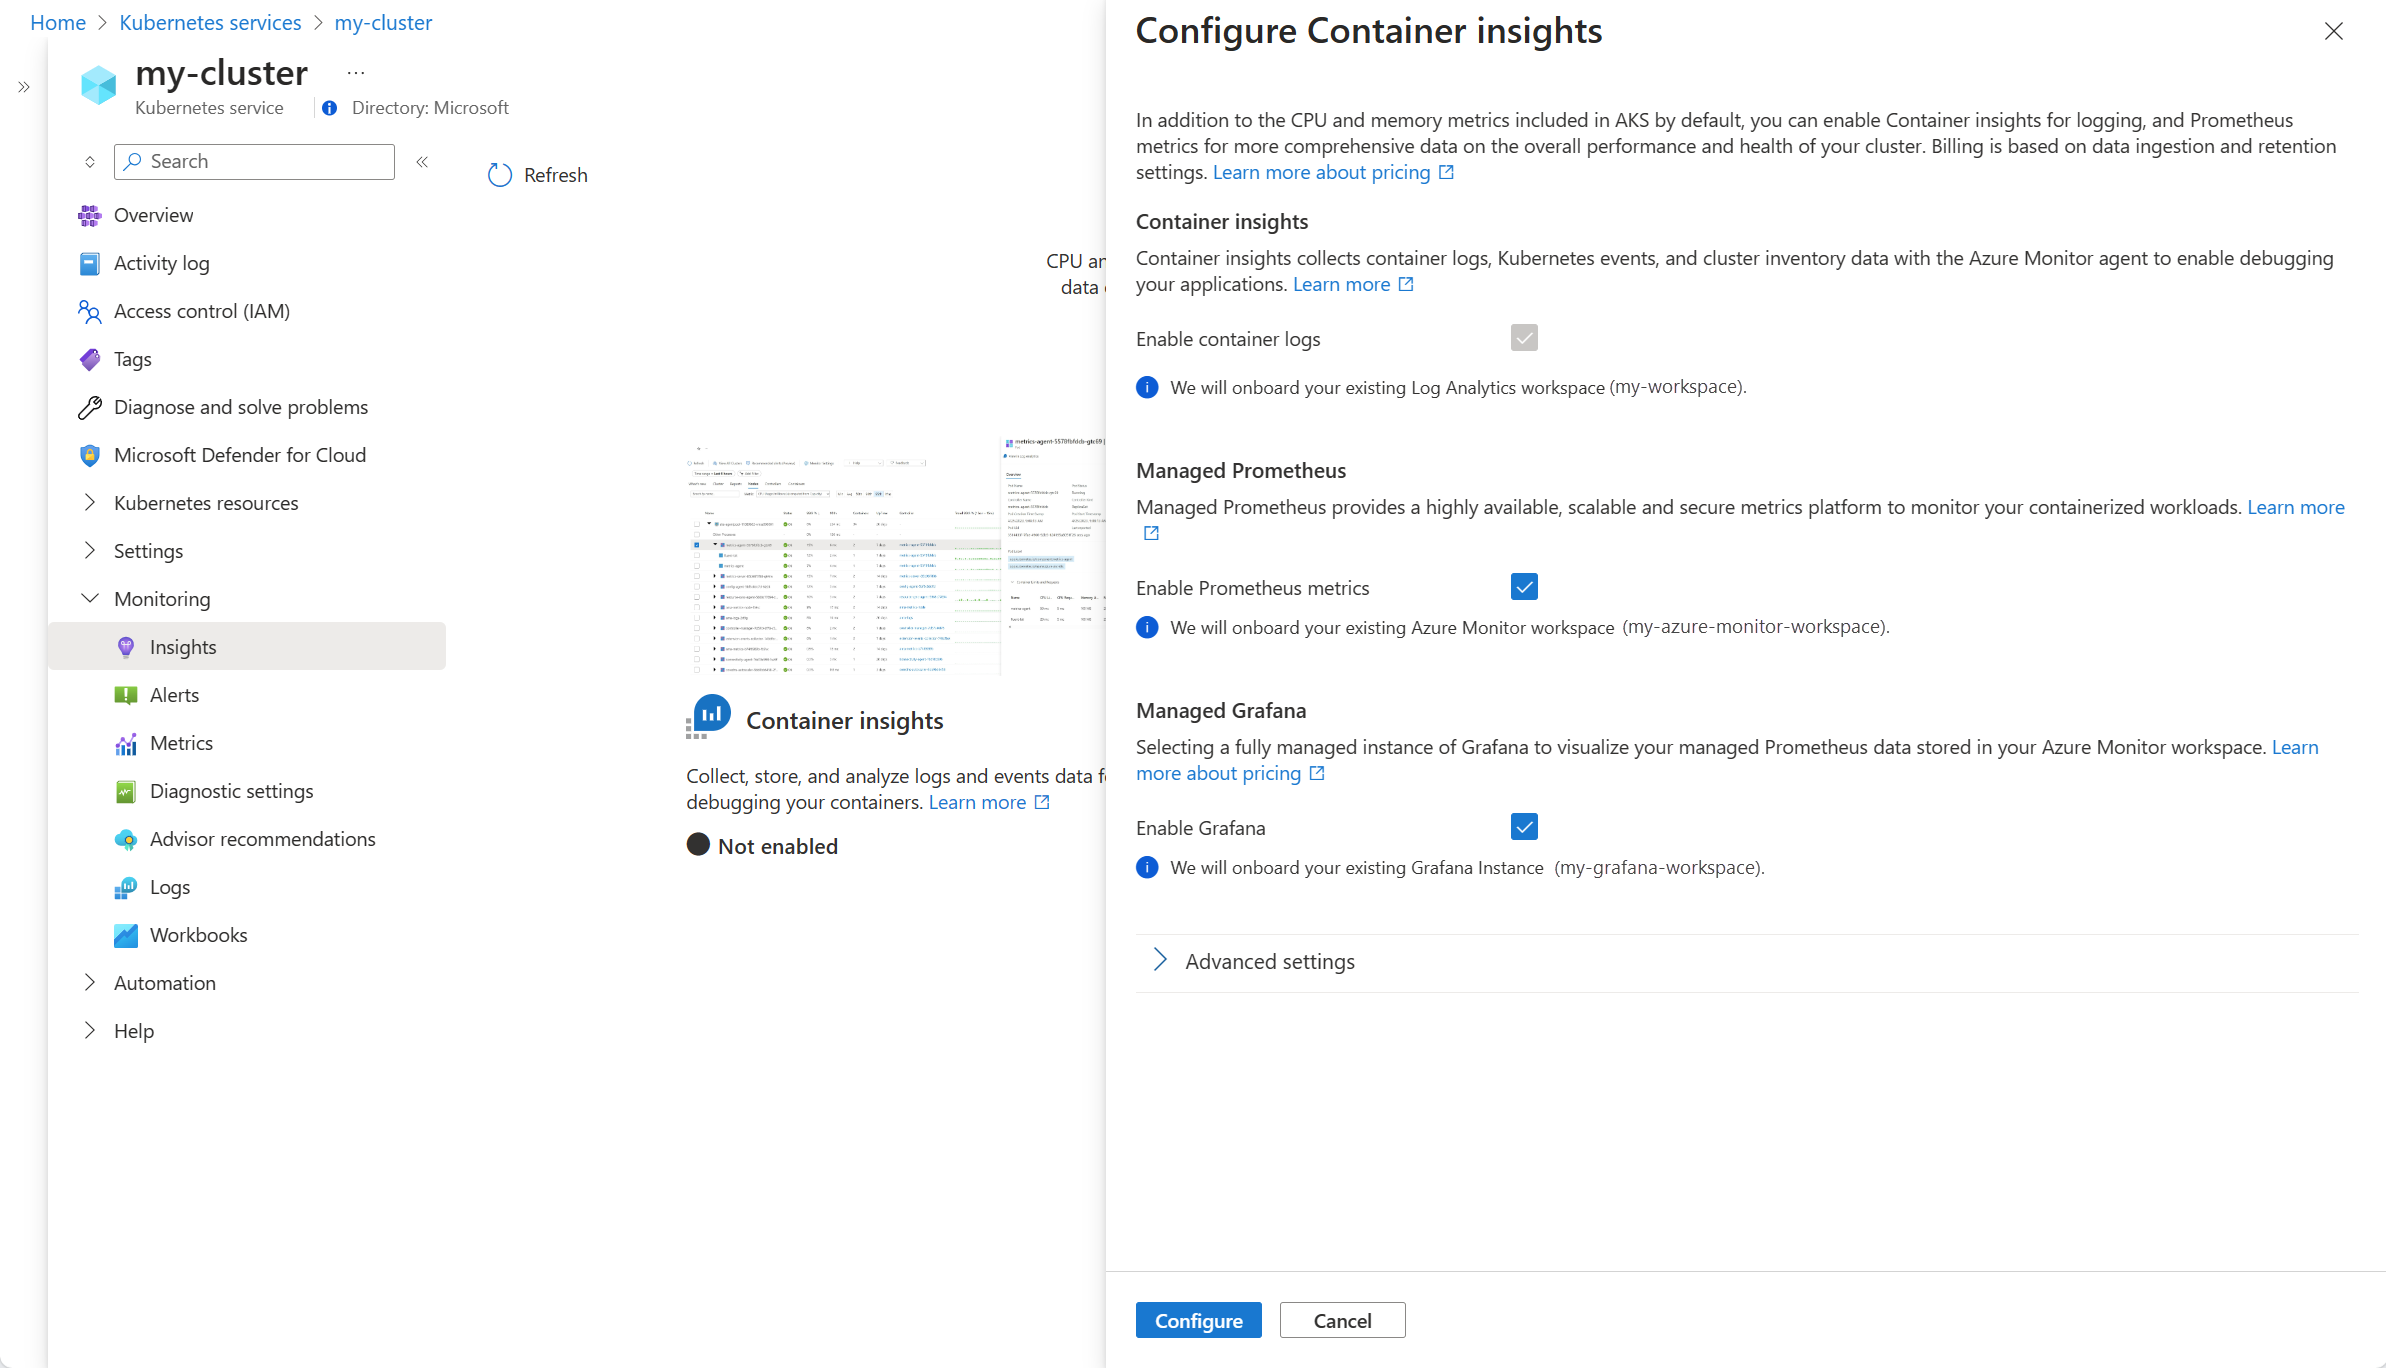
单击“高级设置”以选择备用工作区或创建新工作区。 使用“成本预设”设置可以修改默认集合详细信息以降低监视成本。 有关详细信息,请参阅在容器见解中启用成本优化设置。
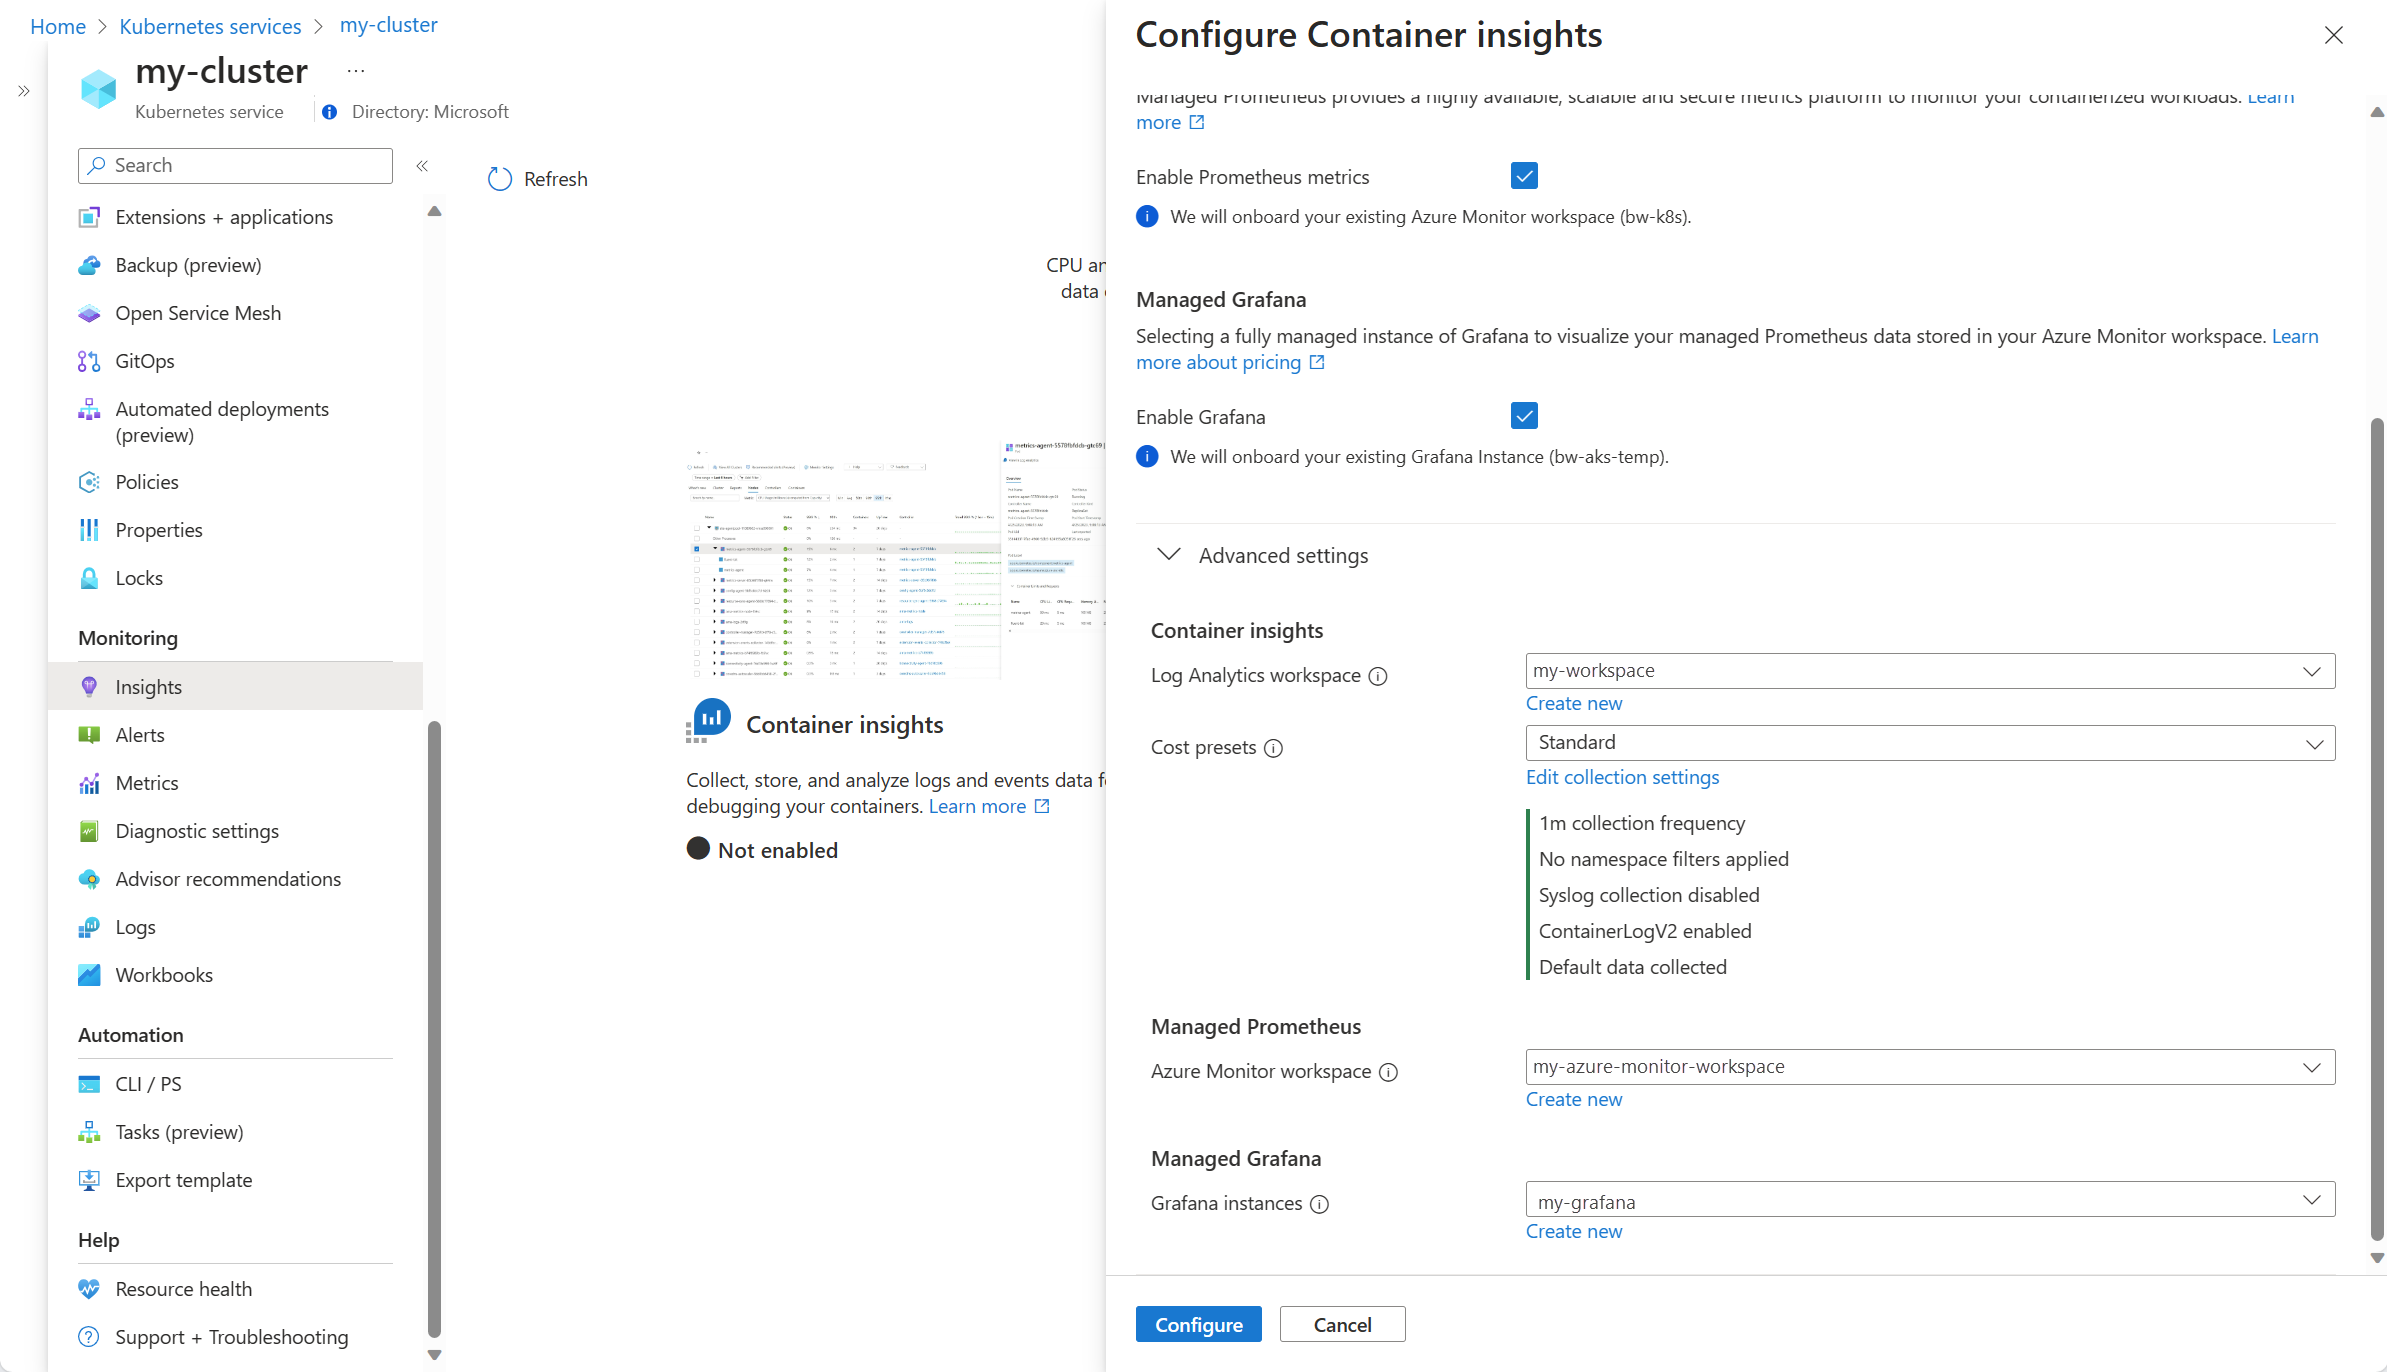
单击“配置”以保存配置。


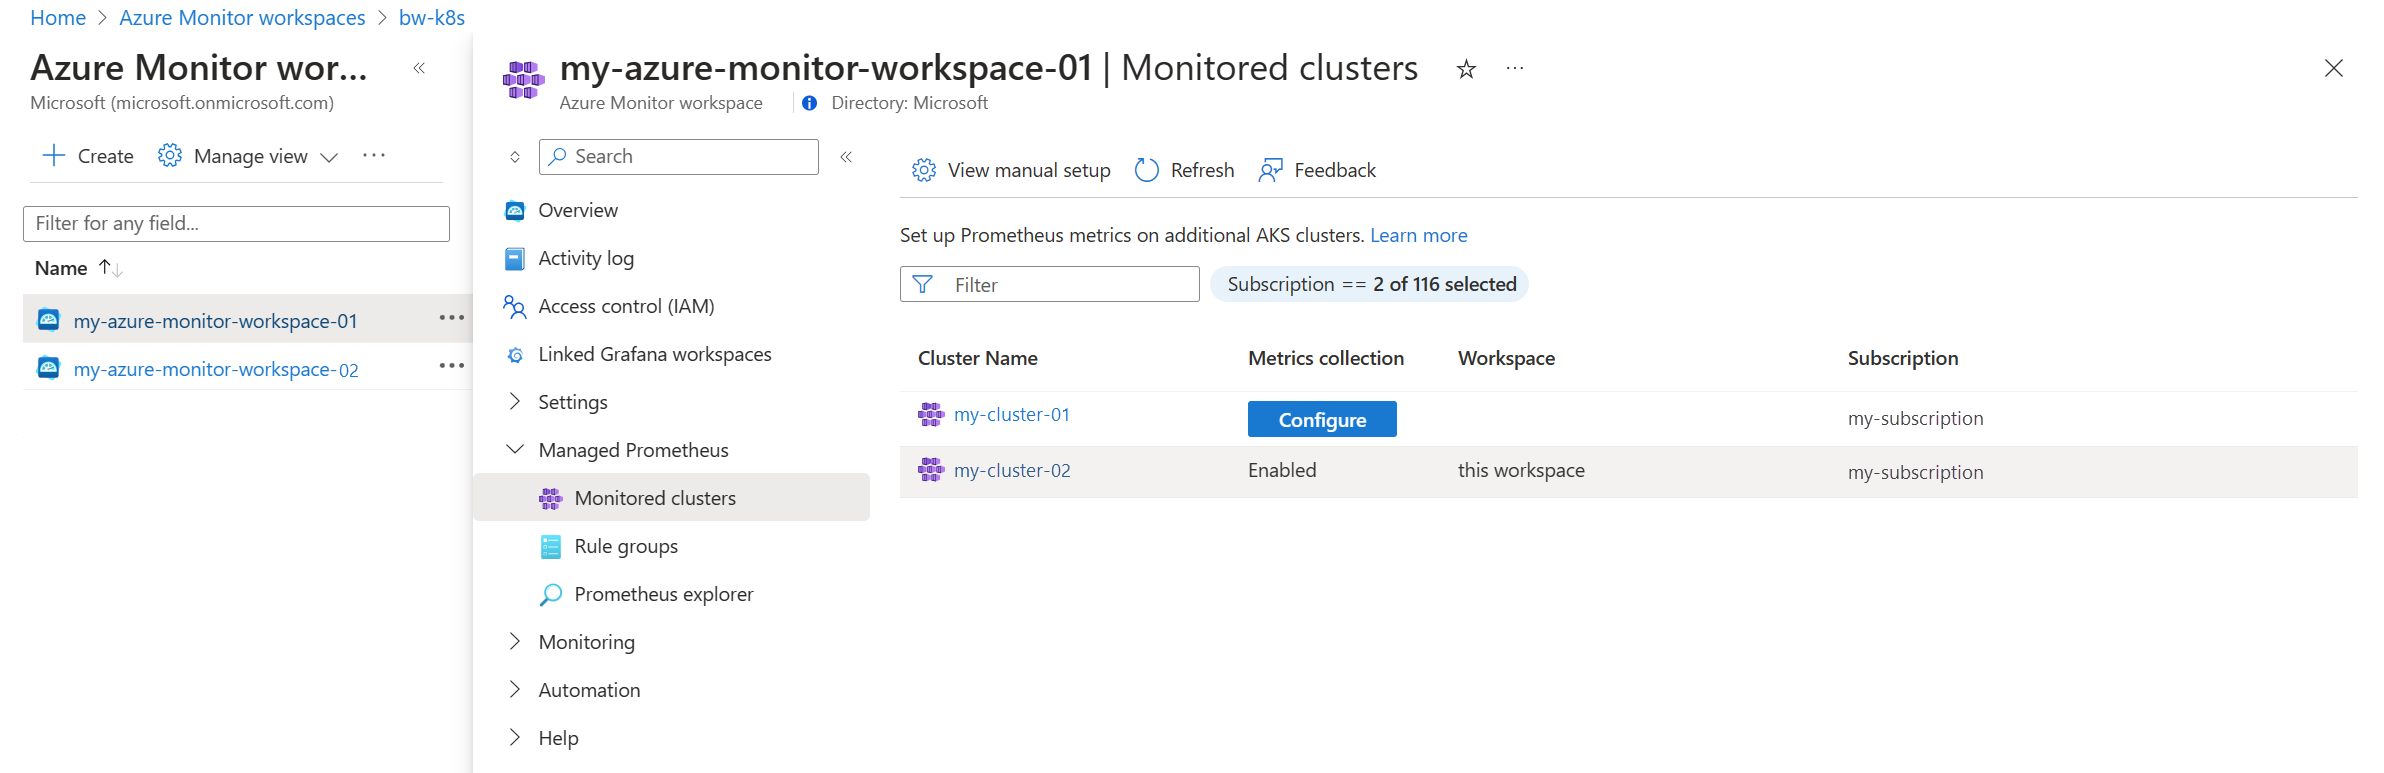
现有群集(仅限 Prometheus)
此选项在群集上启用 Prometheus 指标,但不启用容器见解。
在 Azure 门户中打开“Azure Monitor 工作区”菜单,然后选择工作区。
在“托管 Prometheus”部分选择“受监视的群集”以显示 AKS 群集列表。
选择要启用的群集旁的“配置”。

现有群集(添加 Prometheus)
- 从“监视”菜单中“监视的群集”选项卡中选择“容器”,然后单击“托管 Prometheus”列中群集旁边的“配置”。
启用 Windows 指标收集(预览)
注意
windows-exporter-daemonset.yaml 中不存在 CPU/内存限制,因此可能会过度预配 Windows 节点
有关更多详细信息,请参阅资源预留
在部署工作负载时,请对容器设置资源内存和 CPU 限制。 这也会从 NodeAllocatable 中减去,并帮助群集范围的计划程序确定在哪些节点上放置哪些 Pod。 无限制地计划 Pod 可能会过度预配 Windows 节点,并且在极端情况下可能会导致节点运行不正常。
自版本为 6.4.0-main-02-22-2023-3ee44b9e 的托管 Prometheus 加载项容器 (prometheus_collector) 起,为 AKS 群集启用 Windows 指标收集。 加入 Azure Monitor 指标加载项将使 Windows DaemonSet Pod 开始在节点池上运行。 支持 Windows Server 2019 和 Windows Server 2022。 按照以下步骤使 Pod 能够从 Windows 节点池收集指标。
在 AKS 节点上手动安装 Windows 导出程序以访问 Windows 指标。 启用以下收集器:
[defaults]containermemoryprocesscpu_info
有关更多收集器,请参阅适用于 Windows 指标的 Prometheus 导出器。
部署 windows-exporter-daemonset YAML 文件:
kubectl apply -f windows-exporter-daemonset.yaml将 ama-metrics-settings-configmap 应用到群集。 将
windowsexporter和windowskubeproxy布尔值设置为true。 有关详细信息,请参阅指标加载项设置 configmap。启用开箱即用仪表板所需的记录规则:
验证部署
使用 kubectl 命令行工具验证是否已正确部署代理。
托管 Prometheus
验证是否已在 Linux 节点池上正确部署 DaemonSet
kubectl get ds ama-metrics-node --namespace=kube-system
Pod 数应等于群集上的 Linux 节点数。 输出应与下面的示例类似:
User@aksuser:~$ kubectl get ds ama-metrics-node --namespace=kube-system
NAME               DESIRED   CURRENT   READY   UP-TO-DATE   AVAILABLE   NODE SELECTOR   AGE
ama-metrics-node   1         1         1       1            1           <none>          10h
验证是否已正确部署 Windows 节点
kubectl get ds ama-metrics-win-node --namespace=kube-system
Pod 数应等于群集上的 Windows 节点数。 输出应与下面的示例类似:
User@aksuser:~$ kubectl get ds ama-metrics-node --namespace=kube-system
NAME                   DESIRED   CURRENT   READY   UP-TO-DATE   AVAILABLE   NODE SELECTOR   AGE
ama-metrics-win-node   3         3         3       3            3           <none>          10h
验证是否为 Prometheus 部署了两个 ReplicaSet
kubectl get rs --namespace=kube-system
输出应与下面的示例类似:
User@aksuser:~$kubectl get rs --namespace=kube-system
NAME                            DESIRED   CURRENT   READY   AGE
ama-metrics-5c974985b8          1         1         1       11h
ama-metrics-ksm-5fcf8dffcd      1         1         1       11h
容器见解
验证是否已在 Linux 节点池上正确部署 DaemonSet
kubectl get ds ama-logs --namespace=kube-system
Pod 数应等于群集上的 Linux 节点数。 输出应与下面的示例类似:
User@aksuser:~$ kubectl get ds ama-logs --namespace=kube-system
NAME       DESIRED   CURRENT   READY     UP-TO-DATE   AVAILABLE   NODE SELECTOR   AGE
ama-logs   2         2         2         2            2           <none>          1d
验证是否已正确部署 Windows 节点
kubectl get ds ama-logs-windows --namespace=kube-system
Pod 数应等于群集上的 Windows 节点数。 输出应与下面的示例类似:
User@aksuser:~$ kubectl get ds ama-logs-windows --namespace=kube-system
NAME                   DESIRED   CURRENT   READY     UP-TO-DATE   AVAILABLE   NODE SELECTOR     AGE
ama-logs-windows           2         2         2         2            2       <none>            1d
验证容器见解解决方案的部署
kubectl get deployment ama-logs-rs --namespace=kube-system
输出应与下面的示例类似:
User@aksuser:~$ kubectl get deployment ama-logs-rs --namespace=kube-system
NAME          READY   UP-TO-DATE   AVAILABLE   AGE
ama-logs-rs   1/1     1            1           24d
使用 CLI 查看配置
使用 aks show 命令查看是否已启用解决方案,并查看 Log Analytics 工作区资源 ID 以及有关群集的摘要信息。
az aks show -g <resourceGroupofAKSCluster> -n <nameofAksCluster>
该命令将会返回有关解决方案的 JSON 格式信息。 addonProfiles 部分应包括有关 omsagent 的信息,如下例所示:
"addonProfiles": {
    "omsagent": {
        "config": {
            "logAnalyticsWorkspaceResourceID": "/subscriptions/00000000-0000-0000-0000-000000000000/resourcegroups/my-resource-group/providers/microsoft.operationalinsights/workspaces/my-workspace",
            "useAADAuth": "true"
        },
        "enabled": true,
        "identity": null
    },
}
预配的资源
启用监视时,会在你的订阅中创建以下资源:
| 资源名称 | 资源类型 | 资源组 | 区域/位置 | 说明 |
|---|---|---|---|---|
MSCI-<aksclusterregion>-<clustername> |
数据收集规则 | 与群集相同 | 与 Log Analytics 工作区相同 | 此数据收集规则适用于 Azure Monitor 代理的日志收集,该代理使用 Log Analytics 工作区作为目标,并关联到 AKS 群集资源。 |
MSPROM-<aksclusterregion>-<clustername> |
数据收集规则 | 与群集相同 | 与 Azure Monitor 工作区相同 | 此数据收集规则适用于指标加载项的 Prometheus 指标收集,该加载项将所选的 Azure Monitor 工作区作为目标,并且还关联到 AKS 群集资源 |
MSPROM-<aksclusterregion>-<clustername> |
数据收集终结点 | 与群集相同 | 与 Azure Monitor 工作区相同 | 上述数据收集规则使用此数据收集终结点从指标加载项引入 Prometheus 指标 |
新建 Azure Monitor 工作区时,会创建以下附加资源作为工作区的一部分
| 资源名称 | 资源类型 | 资源组 | 区域/位置 | 说明 |
|---|---|---|---|---|
<azuremonitor-workspace-name> |
数据收集规则 | MA_<azuremonitor-workspace-name>_<azuremonitor-workspace-region>_managed | 与 Azure Monitor 工作区相同 | 使用 OSS Prometheus 服务器远程写入 Azure Monitor 工作区时创建的 DCR。 |
<azuremonitor-workspace-name> |
数据收集终结点 | MA_<azuremonitor-workspace-name>_<azuremonitor-workspace-region>_managed | 与 Azure Monitor 工作区相同 | 使用 OSS Prometheus 服务器远程写入 Azure Monitor 工作区时创建的 DCE。 |
Windows 群集与 Linux 群集之间的差异
监视 Windows Server 群集与监视 Linux 群集相比,主要差异包括:
- Windows 没有内存 RSS 指标。 因此它不适用于 Windows 节点和容器。 可使用工作集指标。
- 磁盘存储容量信息不适用于 Windows 节点。
- 仅监视 Pod 环境,不监视 Docker 环境。
- 使用预览版时,最多支持 30 个 Windows Server 容器。 此限制不适用于 Linux 容器。
注意
容器见解对 Windows Server 2022 操作系统的支持目前为公共预览版。
容器化 Linux 代理 (replicaset pod) 向群集内 Kubelet 安全端口 (10250) 上的所有 Windows 节点进行 API 调用,以收集与节点和容器性能相关的指标。 应在群集的虚拟网络中针对入站和出站打开 Kubelet 安全端口 (:10250),以便正常收集 Windows 节点和容器性能相关指标。
如果你有一个包含 Windows 节点的 Kubernetes 群集,请查看并配置网络安全组和网络策略,确保在群集的虚拟网络中针对入站和出站打开 Kubelet 安全端口 (:10250)。