在 Azure Stack Edge Pro GPU 裝置上啟用 Azure 監視器
適用于:  Azure Stack Edge Pro - GPU Azure Stack Edge Pro 2 Azure Stack Edge Pro R Azure Stack Edge Mini R
監視 Azure Stack Edge Pro GPU 裝置上的容器非常重要,特別是當您執行多個計算應用程式時。 Azure 監視器可讓您從裝置上執行的 Kubernetes 叢集收集容器記錄和記憶體和處理器計量。
本文說明在裝置上啟用 Azure 監視器,並在 Log Analytics 工作區中收集容器記錄所需的步驟。 Azure Stack Edge Pro GPU 裝置目前不支援 Azure 監視器計量存放區。
注意
如果在裝置上的 Kubernetes 叢集上啟用 Azure Arc,請遵循已啟用 Azure Arc 的 Kubernetes 叢集 的 Azure 監視器 Container Insights 中的 步驟來設定容器監視。
必要條件
開始之前,您將需要:
- Azure Stack Edge Pro 裝置。 請確定裝置已依照教學課程:啟動您的裝置 中的 步驟啟動。
- 您已完成 根據 教學課程:在裝置上的 Azure Stack Edge Pro 裝置 上設定計算步驟。 您的裝置應該有相關聯的IoT 中樞資源、IoT 裝置和 IoT Edge 裝置。
建立 Log Analytics 工作區
請採取下列步驟來建立 Log Analytics 工作區。 記錄分析工作區是一個邏輯儲存單位,其中會收集及儲存記錄資料。
在Azure 入口網站中,選取 [+ 建立資源 ],然後搜尋 Log Analytics 工作區 ,然後選取 [ 建立 ]。
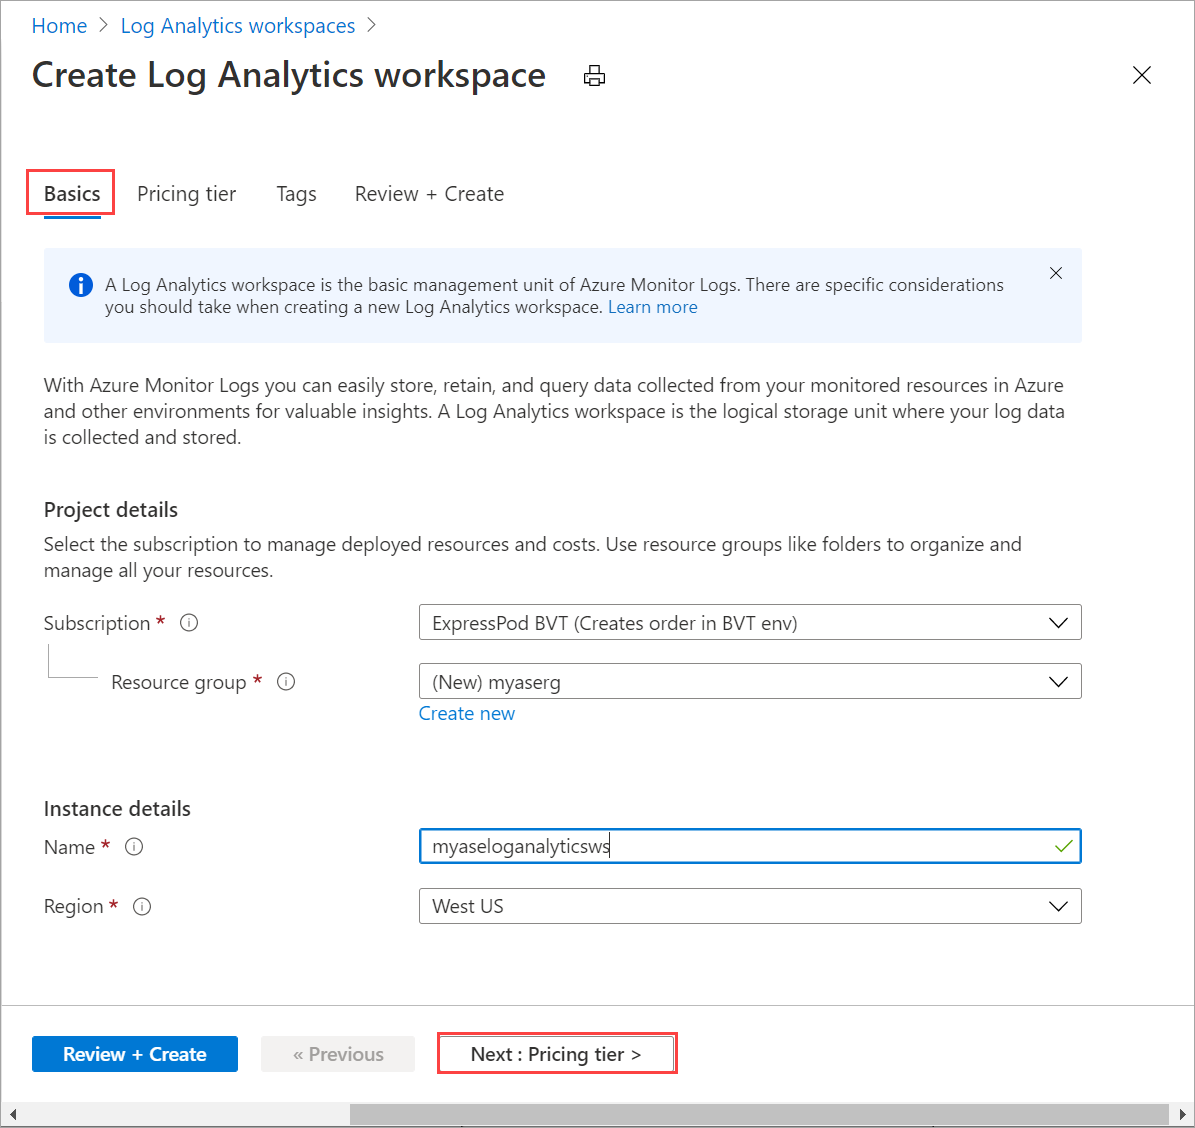
在 [ 建立 Log Analytics] 工作區 中,設定下列設定。 接受餘數做為預設值。
在 [ 基本] 索引 標籤上,提供工作區的訂用帳戶、資源組名和區域。
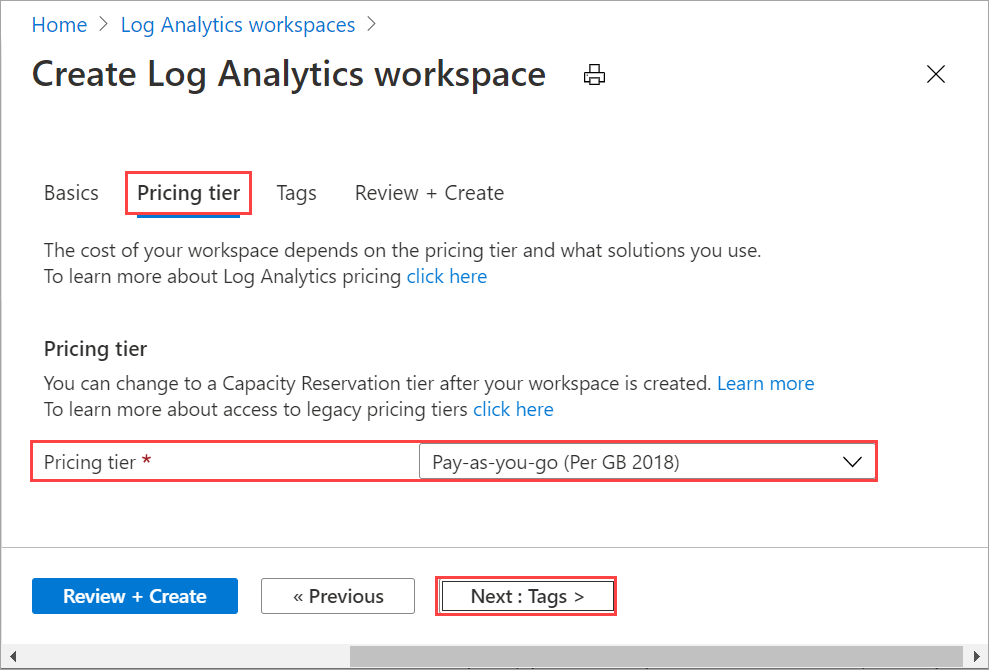
在 [ 定價層 ] 索引標籤上,接受預設 的隨用隨付方案 。
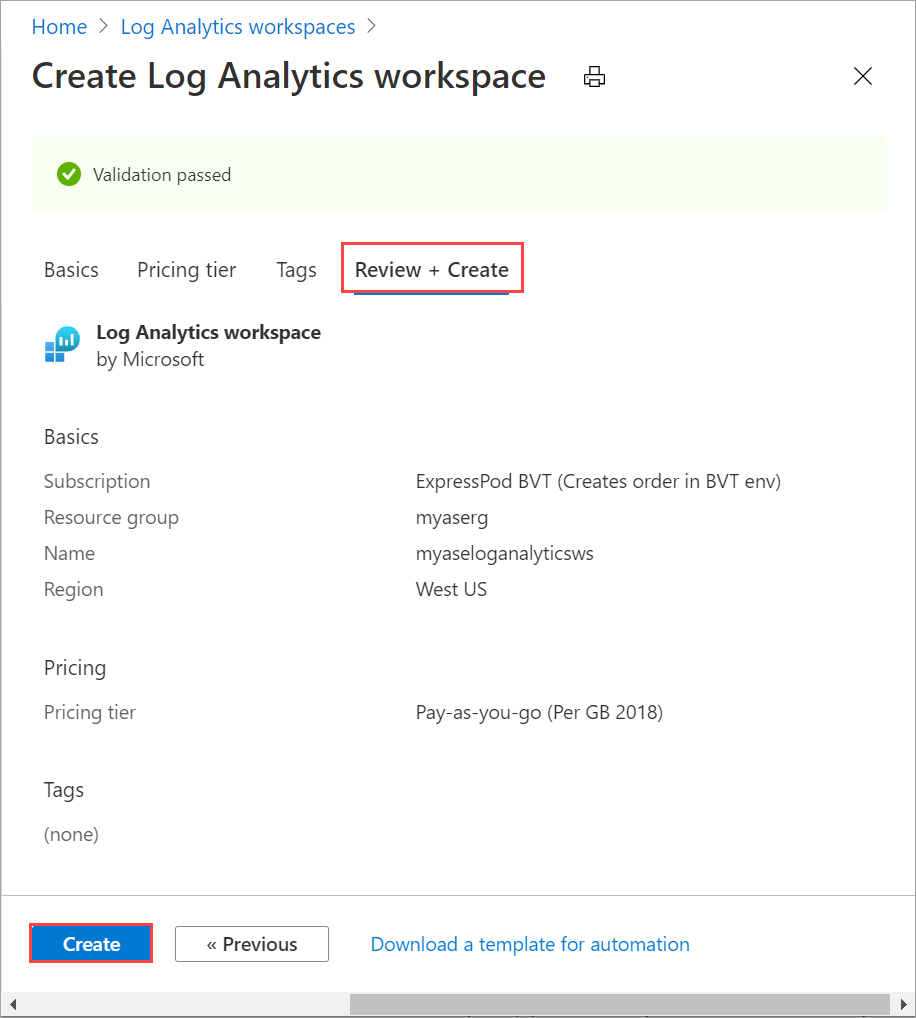
在 [ 檢閱 + 建立 ] 索引標籤上,檢閱工作區的資訊,然後選取 [ 建立 ]。
如需詳細資訊,請參閱透過 Azure 入口網站 建立 Log Analytics 工作區中 的詳細步驟。
啟用容器深入解析
請採取下列步驟,在您的工作區上啟用 Container Insights。
請遵循新增 Azure 監視器容器解決方案 中的 詳細步驟。 使用下列範本檔案
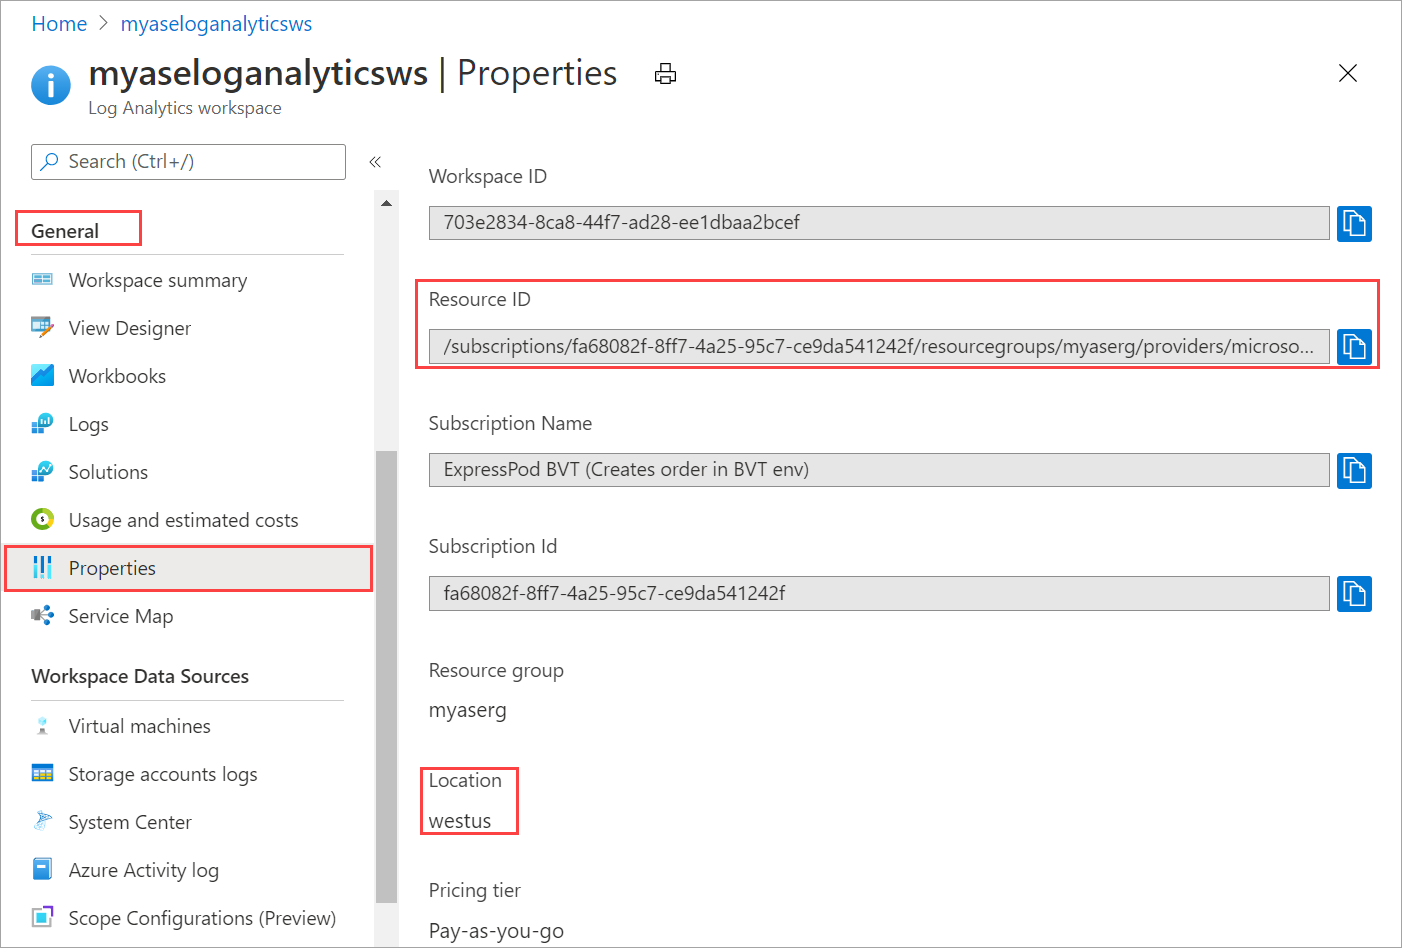
containerSolution.json:{ "$schema": "https://schema.management.azure.com/schemas/2015-01-01/deploymentTemplate.json#", "contentVersion": "1.0.0.0", "parameters": { "workspaceResourceId": { "type": "string", "metadata": { "description": "Azure Monitor Log Analytics Workspace Resource ID" } }, "workspaceRegion": { "type": "string", "metadata": { "description": "Azure Monitor Log Analytics Workspace region" } } }, "resources": [ { "type": "Microsoft.Resources/deployments", "name": "[Concat('ContainerInsights', '-', uniqueString(parameters('workspaceResourceId')))]", "apiVersion": "2017-05-10", "subscriptionId": "[split(parameters('workspaceResourceId'),'/')[2]]", "resourceGroup": "[split(parameters('workspaceResourceId'),'/')[4]]", "properties": { "mode": "Incremental", "template": { "$schema": "https://schema.management.azure.com/schemas/2015-01-01/deploymentTemplate.json#", "contentVersion": "1.0.0.0", "parameters": {}, "variables": {}, "resources": [ { "apiVersion": "2015-11-01-preview", "type": "Microsoft.OperationsManagement/solutions", "location": "[parameters('workspaceRegion')]", "name": "[Concat('ContainerInsights', '(', split(parameters('workspaceResourceId'),'/')[8], ')')]", "properties": { "workspaceResourceId": "[parameters('workspaceResourceId')]" }, "plan": { "name": "[Concat('ContainerInsights', '(', split(parameters('workspaceResourceId'),'/')[8], ')')]", "product": "[Concat('OMSGallery/', 'ContainerInsights')]", "promotionCode": "", "publisher": "Microsoft" } } ] }, "parameters": {} } } ] }取得資源識別碼和位置。 移至
Your Log Analytics workspace > General > Properties。 複製下列資訊:- 資源識別碼 ,這是 Azure Log Analytics 工作區的完整 Azure 資源識別碼。
- 位置 ,這是 Azure 區域。
使用下列參數檔案
containerSolutionParams.json。 將 取代為資源識別碼,並將workspaceRegion取代workspaceResourceId為先前步驟中複製的位置。{ "$schema": "https://schema.management.azure.com/schemas/2015-01-01/deploymentParameters.json#", "contentVersion": "1.0.0.0", "parameters": { "workspaceResourceId": { "value": "/subscriptions/fa68082f-8ff7-4a25-95c7-ce9da541242f/resourcegroups/myaserg/providers/microsoft.operationalinsights/workspaces/myaseloganalyticsws" }, "workspaceRegion": { "value": "westus" } } }以下是已啟用 Container Insights 之 Log Analytics 工作區的範例輸出:
Requesting a Cloud Shell.Succeeded.
Connecting terminal...
MOTD: Switch to Bash from PowerShell: bash
VERBOSE: Authenticating to Azure ...
VERBOSE: Building your Azure drive ...

PS /home/myaccount> az account set -s fa68082f-8ff7-4a25-95c7-ce9da541242f
PS /home/myaccount> ls
clouddrive  containerSolution.json
PS /home/myaccount> ls
clouddrive  containerSolution.json  containerSolutionParams.json
PS /home/myaccount> az deployment group create --resource-group myaserg --name Testdeployment1 --template-file containerSolution.json --parameters containerSolutionParams.json
{- Finished ..
    "id": "/subscriptions/fa68082f-8ff7-4a25-95c7-ce9da541242f/resourceGroups/myaserg/providers/Microsoft.Resources/deployments/Testdeployment1",
    "location": null,
    "name": "Testdeployment1",
    "properties": {
    "correlationId": "3a9045fe-2de0-428c-b17b-057508a8c575",
    "debugSetting": null,
    "dependencies": [],
    "duration": "PT11.1588316S",
    "error": null,
    "mode": "Incremental",
    "onErrorDeployment": null,
    "outputResources": [
        {
        "id": "/subscriptions/fa68082f-8ff7-4a25-95c7-ce9da541242f/resourceGroups/myaserg/providers/Microsoft.OperationsManagement/solutions/ContainerInsights(myaseloganalyticsws)",
        "resourceGroup": "myaserg"
        }
    ],
    "outputs": null,
    "parameters": {
        "workspaceRegion": {
        "type": "String",
        "value": "westus"
        },
        "workspaceResourceId": {
        "type": "String",
        "value": "/subscriptions/fa68082f-8ff7-4a25-95c7-ce9da541242f/resourcegroups/myaserg/providers/microsoft.operationalinsights/workspaces/myaseloganalyticsws"
        }
    },
    "parametersLink": null,
    "providers": [
        {
        "id": null,
        "namespace": "Microsoft.Resources",
        "registrationPolicy": null,
        "registrationState": null,
        "resourceTypes": [
            {
            "aliases": null,
            "apiProfiles": null,
            "apiVersions": null,
            "capabilities": null,
            "defaultApiVersion": null,
            "locations": [
                null
            ],
            "properties": null,
            "resourceType": "deployments"
            }
        ]
        }
    ],
    "provisioningState": "Succeeded",
    "templateHash": "10500027184662969395",
    "templateLink": null,
    "timestamp": "2020-11-06T22:09:56.908983+00:00",
    "validatedResources": null
    },
    "resourceGroup": "myaserg",
    "tags": null,
    "type": "Microsoft.Resources/deployments"
}
PS /home/myaccount>
在裝置上設定 Azure 監視器
移至新建立的 Log Analytics 資源,並複製 工作區識別碼 和 主要金鑰(工作區金鑰 )。
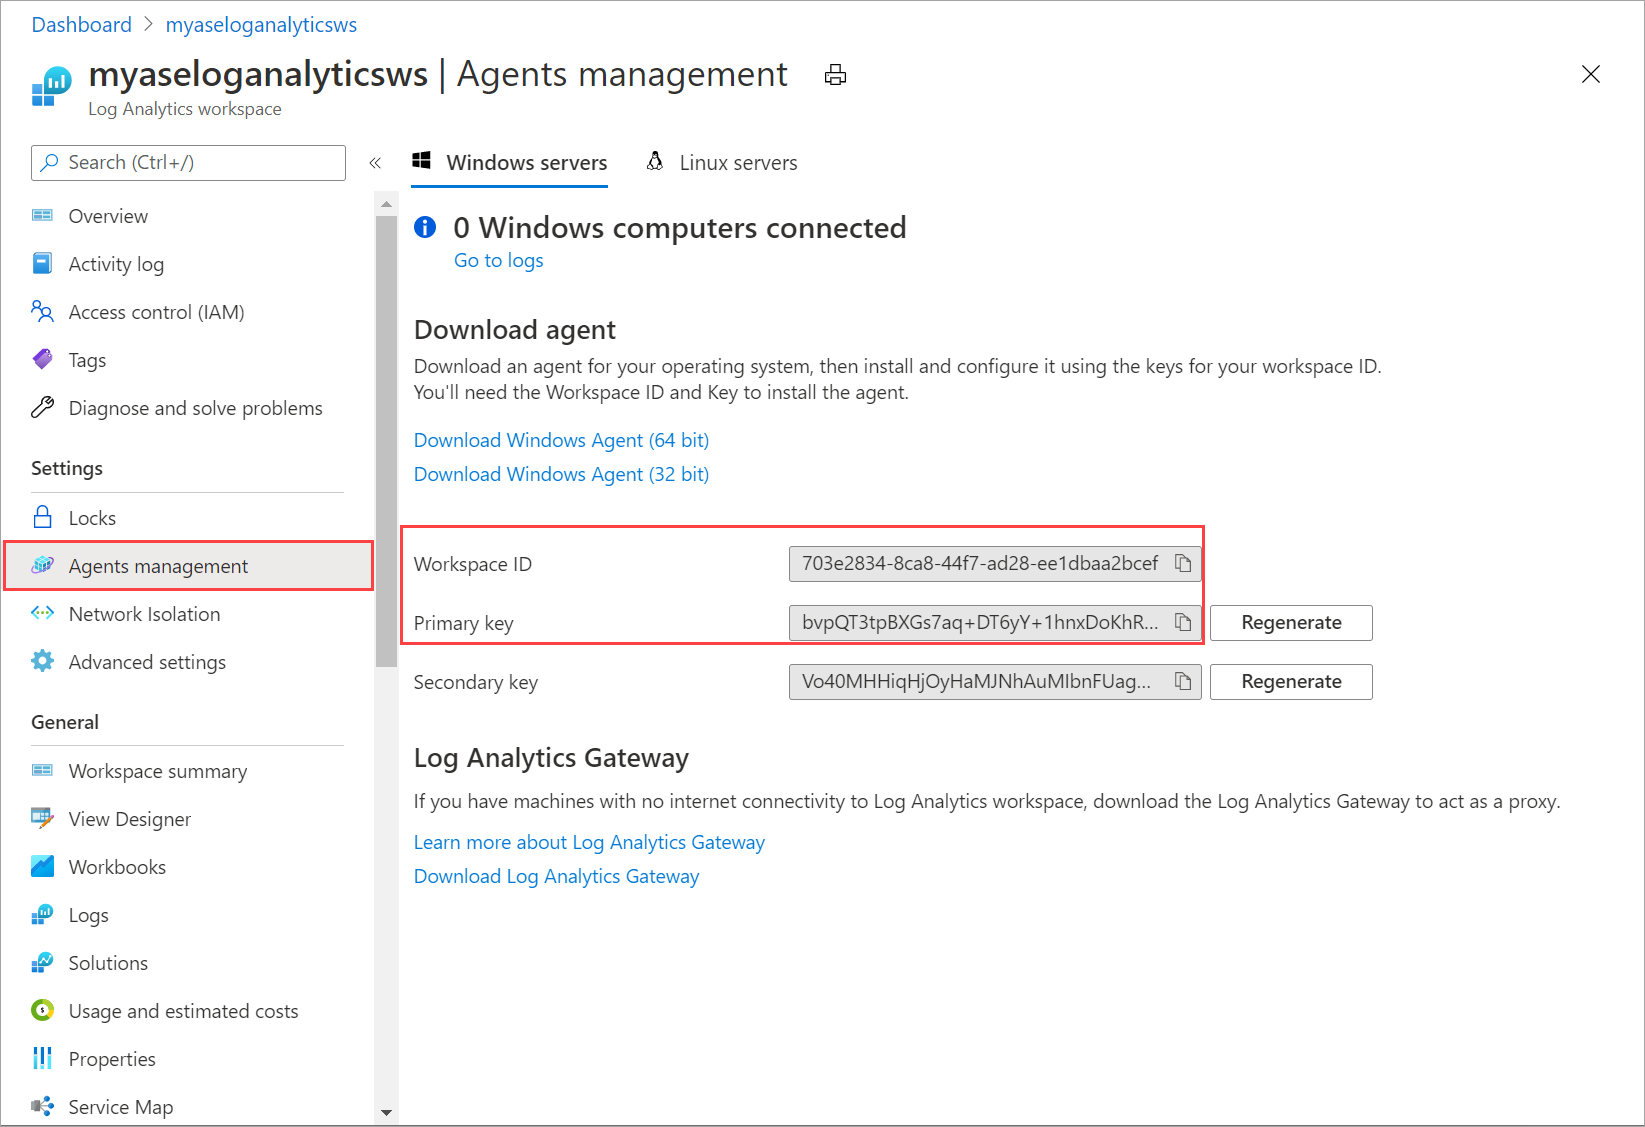
將此資訊儲存為稍後步驟中所使用的資訊。
連線裝置的 PowerShell 介面。
搭配下列 Cmdlet 使用 Log Analytics 工作區識別碼和工作區金鑰:
Set-HcsKubernetesAzureMonitorConfiguration -WorkspaceId <> -WorkspaceKey <>注意
根據預設,此 Cmdlet 會設定 Azure 公用雲端。 若要設定政府雲端或非公用雲端,請使用 參數
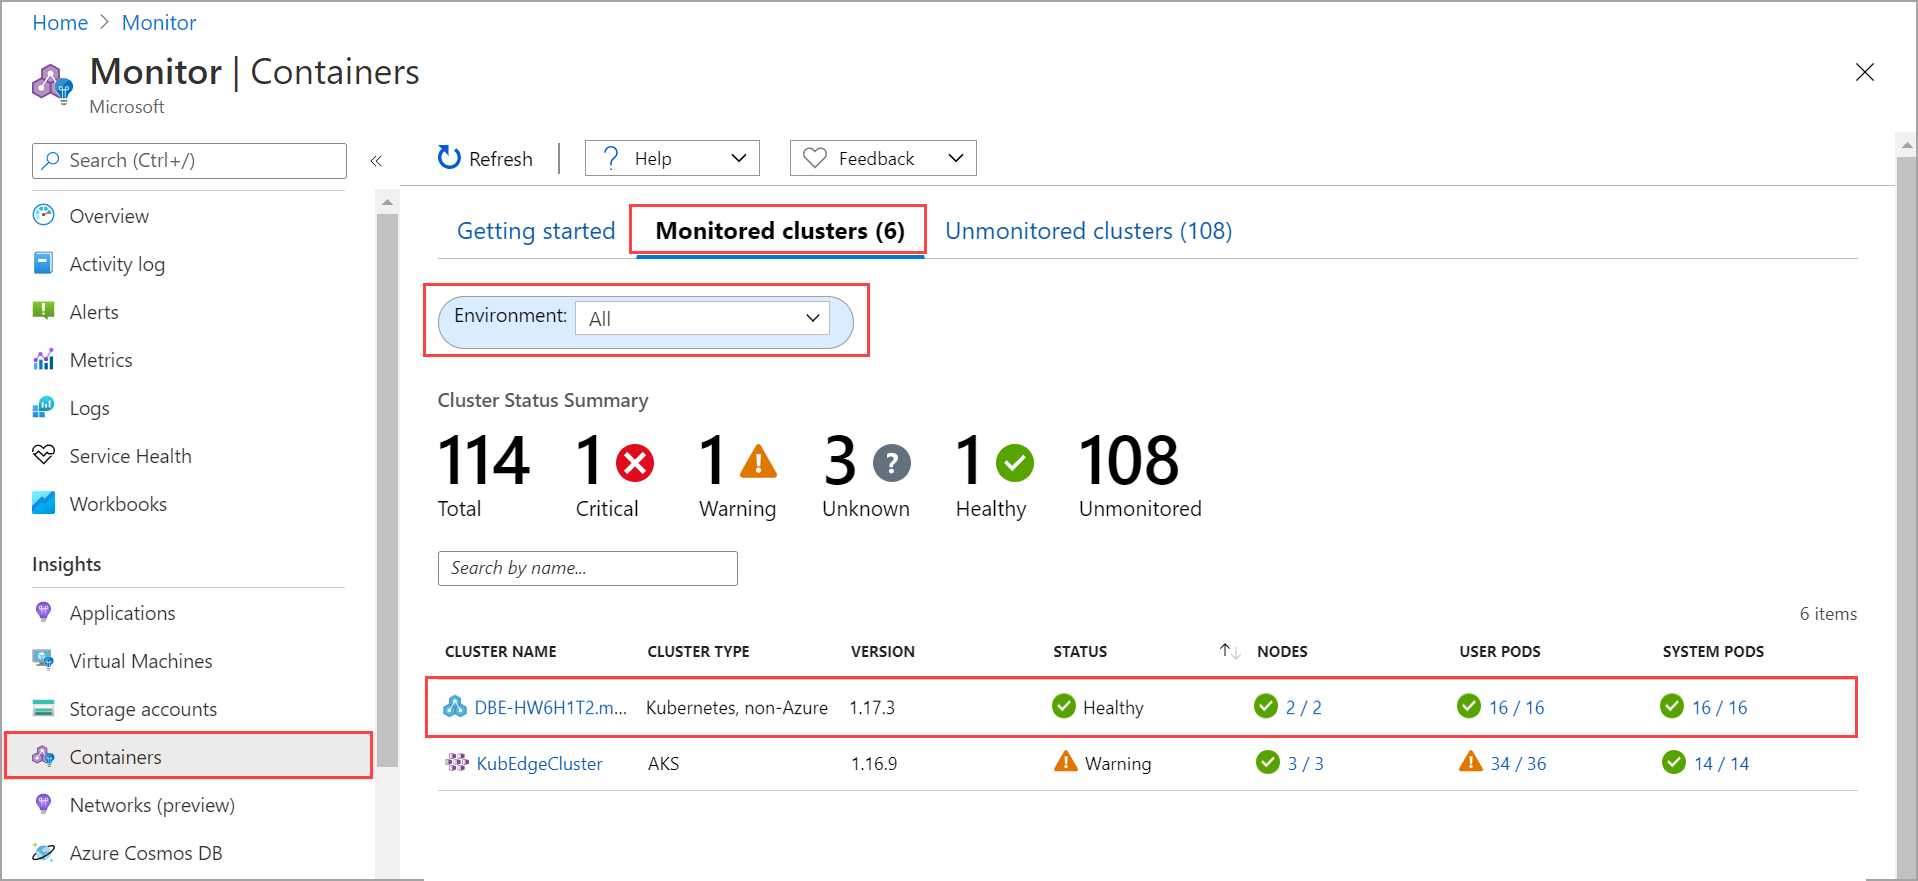
AzureCloudDomainName。啟用 Azure 監視器之後,您應該會在 Log Analytics 工作區中看到記錄。 若要檢視部署在裝置上的 Kubernetes 叢集狀態,請移至 Azure 監視器 > 深入解析 > 容器 。 針對 [環境] 選項,選取 [ 全部 ]。
下一步
- 瞭解如何 透過 Kubernetes 儀表板 監視 Kubernetes 工作負載。
- 瞭解如何 管理裝置事件警示通知 。