在本教學課程中,您將了解如何使用 Jupyter Notebook 為 Azure HDInsight 建置 Apache Spark 機器學習應用程式。
MLlib 是 Spark 的可調整機器學習程式庫,由常見的學習演算法和公用程式所組成 (包括分類、迴歸、群集、共同作業篩選和維度縮減。同時也是基礎最佳化的基礎)。
在本教學課程中,您會了解如何:
- 開發 Apache Spark 機器學習應用程式
必要條件
HDInsight 上的 Apache Spark 叢集。 請參閱建立 Apache Spark 叢集。
熟悉如何搭配使用 Jupyter Notebook 和 HDInsight 上的 Spark。 如需詳細資訊,請參閱使用 HDInsight 上的 Apache Spark 載入資料及執行查詢。
了解資料集
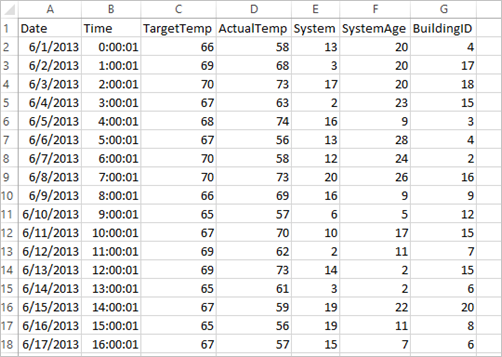
應用程式會使用所有叢集預設提供的範例 HVAC.csv 資料。 檔案位於 \HdiSamples\HdiSamples\SensorSampleData\hvac。 這項資料會顯示某些已安裝 HVAC 系統之建築物的目標溫度和實際溫度。 [System] 資料行代表系統識別碼,而 [SystemAge] 資料行代表 HVAC 系統安裝在建築物中的年數。 在指定系統識別碼和系統年期的情況下,您可以預測建築物的溫度會比目標溫度高或低。
使用 Spark MLlib 開發 Spark 機器學習應用程式
此應用程式會使用 Spark ML 管線來執行文件分類。 ML 管線提供一組以 DataFrames 為基礎的相同高階 API。 DataFrame 可協助使用者建立及調整實用的機器學習服務管線。 在管線中,您要將文件分割成單字、將單字轉換成數值特性向量,最後再使用特性向量和標籤建立預測模型。 執行下列步驟以建立應用程式。
使用 PySpark 核心建立 Jupyter Notebook。 如需指示,請參閱建立 Jupyter Notebook 檔案。
匯入此案例所需的類型。 將下列程式碼片段貼到空白儲存格中,然後按 SHIFT + ENTER。
from pyspark.ml import Pipeline
from pyspark.ml.classification import LogisticRegression
from pyspark.ml.feature import HashingTF, Tokenizer
from pyspark.sql import Row

import os
import sys
from pyspark.sql.types import *

from pyspark.mllib.classification import LogisticRegressionWithLBFGS
from pyspark.mllib.regression import LabeledPoint
from numpy import array
載入資料 (hvac.csv)、剖析資料,以及利用它來為模型定型。
# Define a type called LabelDocument
LabeledDocument = Row("BuildingID", "SystemInfo", "label")

# Define a function that parses the raw CSV file and returns an object of type LabeledDocument
def parseDocument(line):
    values = [str(x) for x in line.split(',')]
    if (values[3] > values[2]):
        hot = 1.0
    else:
        hot = 0.0

    textValue = str(values[4]) + " " + str(values[5])

    return LabeledDocument((values[6]), textValue, hot)

# Load the raw HVAC.csv file, parse it using the function
data = sc.textFile("/HdiSamples/HdiSamples/SensorSampleData/hvac/HVAC.csv")

documents = data.filter(lambda s: "Date" not in s).map(parseDocument)
training = documents.toDF()
在程式碼片段中,您必須定義函式來比較實際溫度與目標溫度。 如果實際溫度較高,代表建築物是熱的,我們以 1.0值來表示這個狀態。 否則,大樓會是冷的,並以 0.0 值來表示。
設定由三個階段組成的 Spark 機器學習管線:
tokenizer、hashingTF和lr。tokenizer = Tokenizer(inputCol="SystemInfo", outputCol="words") hashingTF = HashingTF(inputCol=tokenizer.getOutputCol(), outputCol="features") lr = LogisticRegression(maxIter=10, regParam=0.01) pipeline = Pipeline(stages=[tokenizer, hashingTF, lr])如需有關管線及其運作方式的詳細資訊,請參閱 Apache Spark 機器學習管線 \(英文\)。
讓管線符合訓練文件。
model = pipeline.fit(training)驗證訓練文件以根據應用程式的進度設立檢查點。
training.show()輸出如下:
+----------+----------+-----+
|BuildingID|SystemInfo|label|
+----------+----------+-----+
|         4|     13 20|  0.0|
|        17|      3 20|  0.0|
|        18|     17 20|  1.0|
|        15|      2 23|  0.0|
|         3|      16 9|  1.0|
|         4|     13 28|  0.0|
|         2|     12 24|  0.0|
|        16|     20 26|  1.0|
|         9|      16 9|  1.0|
|        12|       6 5|  0.0|
|        15|     10 17|  1.0|
|         7|      2 11|  0.0|
|        15|      14 2|  1.0|
|         6|       3 2|  0.0|
|        20|     19 22|  0.0|
|         8|     19 11|  0.0|
|         6|      15 7|  0.0|
|        13|      12 5|  0.0|
|         4|      8 22|  0.0|
|         7|      17 5|  0.0|
+----------+----------+-----+
比較輸出和原始 CSV 檔案。 例如,CSV 檔案中第一個資料列的資料為:
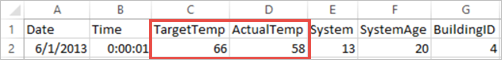
請注意,實際溫度比目標溫度低的情況代表建築物處於低溫狀態。 第一個資料列的 [標籤] 值為 [0.0],這代表建築物溫度不高。
準備要做為定型模型之執行依據的資料集。 若要這麼做,您可以傳遞系統識別碼和系統年齡 (在定型輸出中以 SystemInfo 表示)。 此模型會預測具有該系統識別碼和系統年齡的建築物溫度會變得較高 (以 1.0 表示) 或較低 (以0.0 表示)。
# SystemInfo here is a combination of system ID followed by system age
Document = Row("id", "SystemInfo")
test = sc.parallelize([("1L", "20 25"),
                ("2L", "4 15"),
                ("3L", "16 9"),
                ("4L", "9 22"),
                ("5L", "17 10"),
                ("6L", "7 22")]) \
    .map(lambda x: Document(*x)).toDF()
最後,根據測試資料進行預測。
# Make predictions on test documents and print columns of interest
prediction = model.transform(test)
selected = prediction.select("SystemInfo", "prediction", "probability")
for row in selected.collect():
    print (row)
輸出如下:
Row(SystemInfo=u'20 25', prediction=1.0, probability=DenseVector([0.4999, 0.5001]))
Row(SystemInfo=u'4 15', prediction=0.0, probability=DenseVector([0.5016, 0.4984]))
Row(SystemInfo=u'16 9', prediction=1.0, probability=DenseVector([0.4785, 0.5215]))
Row(SystemInfo=u'9 22', prediction=1.0, probability=DenseVector([0.4549, 0.5451]))
Row(SystemInfo=u'17 10', prediction=1.0, probability=DenseVector([0.4925, 0.5075]))
Row(SystemInfo=u'7 22', prediction=0.0, probability=DenseVector([0.5015, 0.4985]))
觀察預測中的第一個資料列。 對於識別碼為 20 且系統年齡為 25 年的 HVAC 系統而言,建築物溫度較高 (prediction=1.0)。 DenseVector (0.49999) 的第一個值對應到預測 0.0,而第二個值 (0.5001) 對應到預測 1.0。 在輸出中,即使第二個值只是稍微高一點,模型仍舊顯示 prediction=1.0。
關閉 Notebook 來釋放資源。 若要這麼做,請從 Notebook 的 [檔案] 功能表中,選取 [關閉並終止]。 此動作會關機並且關閉 Notebook。
使用適用於 Spark 機器學習的 Anaconda scikit-learn 程式庫
HDInsight 中的 Apache Spark 叢集包含 Anaconda 程式庫。 其中也包含適用於機器學習的 scikit-learn 程式庫。 此程式庫另包含用來直接從 Jupyter Notebook 建置範例應用程式的各種資料集。 如需使用 sscikit-learn 程式庫的詳細資訊,請參閱 https://scikit-learn.org/stable/auto_examples/index.html。
清除資源
如果您不打算繼續使用此應用程式,請使用下列步驟刪除您所建立的叢集:
登入 Azure 入口網站。
在頂端的 [搜尋] 方塊中,輸入 HDInsight。
在 [服務] 底下,選取 [HDInsight 叢集]。
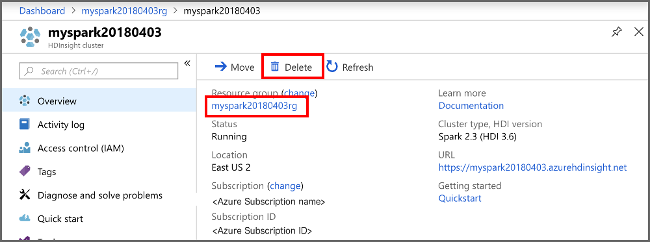
從出現的 HDInsight 叢集清單中,在您為本教學課程建立的叢集旁選取 [...]。
選取 [刪除]。 選取 [是]。
下一步
在本教學課程中,您已了解如何使用 Jupyter Notebook 為 Azure HDInsight 建置 Apache Spark 機器學習應用程式。 繼續進行下一個教學課程,以了解如何將 IntelliJ IDEA 用於 Spark 作業。