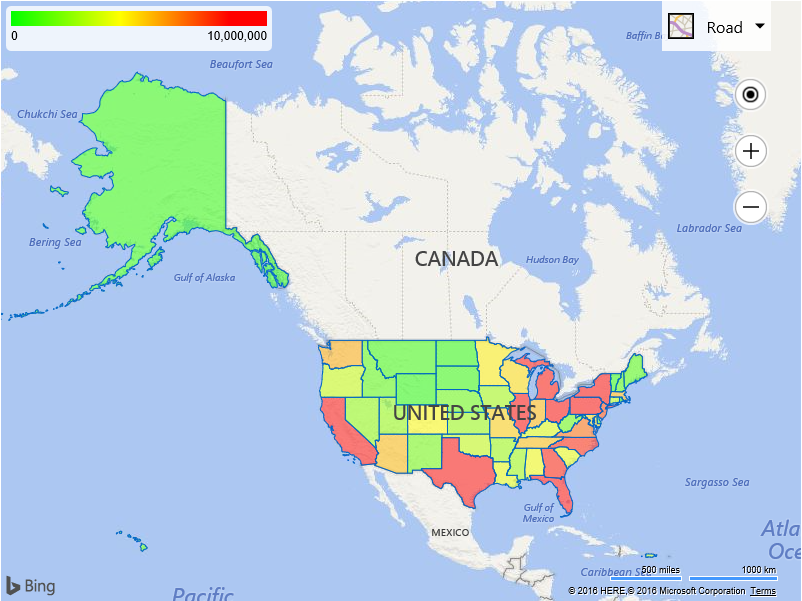
Choropleth Map Example
Note
Bing Maps Web Control SDK retirement
Bing Maps Web Control SDK is deprecated and will be retired. Free (Basic) account customers can continue to use Bing Maps Web Control SDK until June 30th, 2025. Enterprise account customers can continue to use Bing Maps Web Control SDK until June 30th, 2028. To avoid service disruptions, all implementations using Bing Maps Web Control SDK will need to be updated to use Azure Maps Web SDK by the retirement date that applies to your Bing Maps for Enterprise account type. For detailed migration guidance, see Migrate from Bing Maps Web Control SDK and Migrate Bing Maps Enterprise applications to Azure Maps with GitHub Copilot.
Azure Maps is Microsoft's next-generation maps and geospatial services for developers. Azure Maps has many of the same features as Bing Maps for Enterprise, and more. To get started with Azure Maps, create a free Azure subscription and an Azure Maps account. For more information about azure Maps, see Azure Maps Documentation. For migration guidance, see Bing Maps Migration Overview.
This code example retrieves US state boundaries from a Spatial Data Source that contains US census data. These boundaries are color coded based on the population metric.
<!DOCTYPE html>
<html>
<head>
    <title></title>
    <meta charset="utf-8" />
	<script type='text/javascript'>
    var sdsDataSourceUrl = 'https://spatial.virtualearth.net/REST/v1/data/755aa60032b24cb1bfb54e8a6d59c229/USCensus2010_States/States';

    var map,
        maxPopulation = 10000000,
        heatGradientData;

    function GetMap() {
        map = new Microsoft.Maps.Map('#myMap', {
            credentials: 'Your Bing Maps Key',
            center: new Microsoft.Maps.Location(53.32, -110.29),
            zoom: 3
        });

        //Create a legend.
        createLegend(maxPopulation);

        //Load the Bing Spatial Data Services module.
        Microsoft.Maps.loadModule('Microsoft.Maps.SpatialDataService', function () {

            var worldBounds = Microsoft.Maps.LocationRect.fromEdges(90, -180, -90, 180);

            //Get all states by doing an intersection test against a bounding box of the world and have up to 52 results returned.
            var queryOptions = {
                queryUrl: sdsDataSourceUrl,
                spatialFilter: {
                    spatialFilterType: 'intersects',
                    intersects: worldBounds
                },
                top: 52
            };

            Microsoft.Maps.SpatialDataService.QueryAPIManager.search(queryOptions, map, function (data) {
                //Loop through results and set the fill color of the polygons based on the population property.
                for (var i = 0; i < data.length; i++) {
                    data[i].setOptions({
                        fillColor: getLegendColor(data[i].metadata.Population, maxPopulation)
                    });

                    //Add a click event to each polygon and display metadata.
                    Microsoft.Maps.Events.addHandler(data[i], 'click', function (e) {
                        alert(e.target.metadata.Name + '\r\nPopulation: ' + e.target.metadata.Population);
                    });
                }

                //Add results to the map.
                map.entities.push(data);
            });
        });
    }

    function createLegend(maxValue) {
        var canvas = document.getElementById('legendCanvas');
        var ctx = canvas.getContext('2d');

        //Create a linear gradient for the legend.
        var colorGradient = {
            "0.00": 'rgba(0,255,0,255)',    // Green
            "0.50": 'rgba(255,255,0,255)',  // Yellow
            "1.00": 'rgba(255,0,0,255)'     // Red
        };

        var grd = ctx.createLinearGradient(0, 0, 256, 0);
        for (var c in colorGradient) {
            grd.addColorStop(c, colorGradient[c]);
        }
        ctx.fillStyle = grd;
        ctx.fillRect(0, 0, canvas.width, canvas.height);

        //Store the pixel information from the legend.
        heatGradientData = ctx.getImageData(0, 0, canvas.width, 1);
    }

    function getLegendColor(value, maxValue) {
        value = (value > maxValue) ? maxValue : value;

        //Calculate the pixel data index from the ratio of value/maxValue.
        var idx = Math.round((value / maxValue) * 256) * 4 - 4;

        if (idx < 0) {
            idx = 0;
        }

        //Create an RGBA color from the pixel data at the calculated index.
        return 'rgba('+ heatGradientData.data[idx]+ ',' +
            heatGradientData.data[idx + 1] + ',' +
            heatGradientData.data[idx + 2] + ',' + '0.5)';
    }
    </script>
    <style>
        .mapContainer {
            position:relative;
            width:800px;
            height:600px;
        }

        #map {
            position:relative;
            width:800px;
            height:600px;
        }

        .legend {
            position:absolute;
            top:5px;
            left:5px;
            width:256px;
            height:35px;
            font-family:Arial;
            font-size:12px;
            background-color:rgba(255, 255, 255, 0.8);
            border-radius:5px;
            padding:5px;
        }

        #legendCanvas {
            width:256px;
            height:15px;
        }

        .legend-max {
            float:right;
        }
    </style>
    <script type='text/javascript' src='http://www.bing.com/api/maps/mapcontrol?callback=GetMap' async defer></script>
</head>
<body>
    <div class="mapContainer">
        <div id="myMap"></div>

        <div class="legend">
            <canvas id="legendCanvas"></canvas>
            <span class="legend-min">0</span>
            <span class="legend-max">10,000,000</span>
        </div>
    </div>
</body>
</html>
Running this code will display a map of the USA with color coded US states based on population. A legend for the colors is overlaid on top the map as well. If you click on any of the states, a notification will appear which specifies which state was clicked and its population.