What is Advanced Network Observability?
Advanced Network Observability is a debut feature of the Advanced Container Networking Services suite. It equips you with next-level monitoring and diagnostics tools, providing unparalleled visibility into your containerized workloads. These tools empower you to pinpoint and troubleshoot network issues with ease, ensuring optimal performance for your applications.
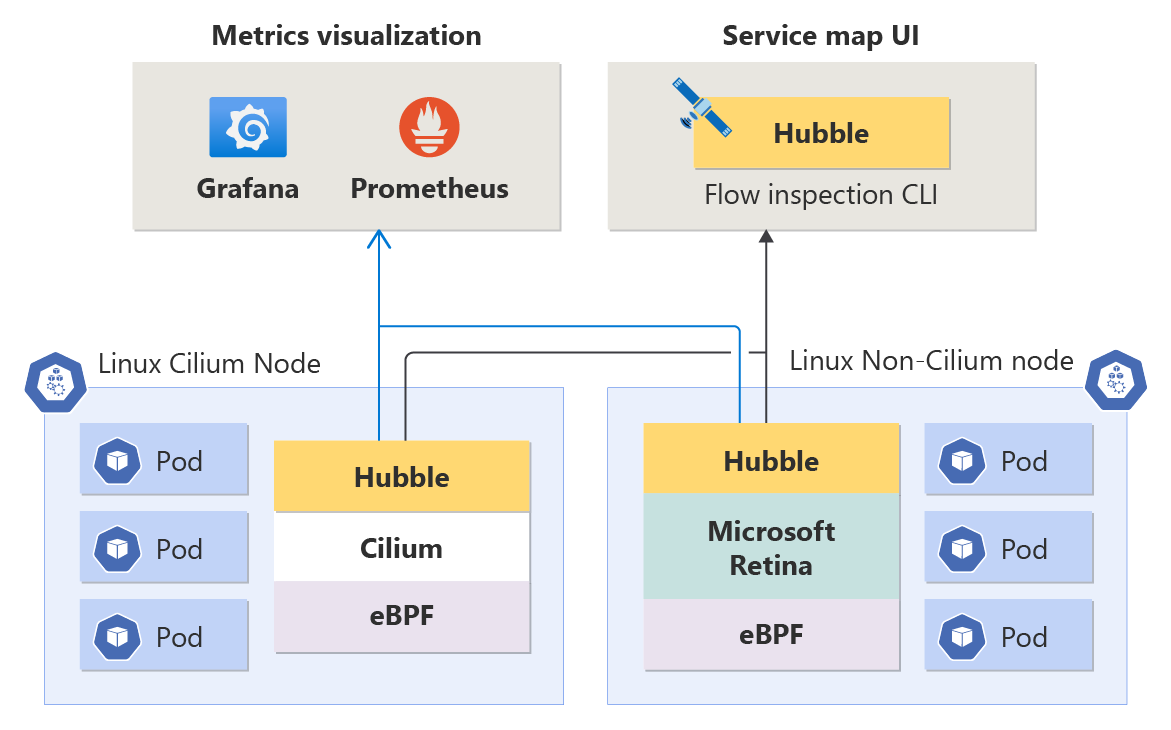
Advanced Network Observability is compatible with all Linux workloads seamlessly integrating with Hubble regardless of whether the underlying data plane is Cilium or non-Cilium (both are supported) ensuring flexibility for your container networking needs.
Note
For Cilium data plane scenarios, Advanced Network Observability is available beginning with Kubernetes version 1.29. For non-Cilium data plane scenarios, Advanced Network Observability is supported on all Linux distributions including Azure Linux beginning with version 2.0.
Features of Advanced Network Observability
Advanced Network Observability offers the following capabilities to monitor network-related issues in your cluster:
Node-Level Metrics: Understanding the health of your container network at the node-level is crucial for maintaining optimal application performance. These metrics provide insights into traffic volume, dropped packets, number of connections, etc. by node. The metrics are stored in Prometheus format and, as such, you can view them in Grafana.
Hubble Metrics (DNS and Pod-Level Metrics): These Prometheus metrics include source and destination pod information allowing you to pinpoint network-related issues at a granular level. Metrics cover traffic volume, dropped packets, TCP resets, L4/L7 packet flows, etc. There are also DNS metrics (currently only for Non-Cilium data planes), covering DNS errors and DNS requests missing responses.
Hubble Flow Logs: Flow logs provide deep visibility into your cluster's network activity. All communications to and from pods are logged allowing you to investigate connectivity issues over time. Flow logs help answer questions such as: did the server receive the client's request? What is the round-trip latency between the client's request and server's response?
Hubble CLI: The Hubble Command-Line Interface (CLI) can retrieve flow logs across the entire cluster with customizable filtering and formatting.
Hubble UI: Hubble UI is a user-friendly browser-based interface for exploring cluster network activity. It creates a service-connection graph based on flow logs, and displays flow logs for the selected namespace. Users are responsible for provisioning and managing the infrastructure required to run Hubble UI.
Key Benefits of Advanced Network Observability
CNI-Agnostic: Supported on all Azure CNI variants including kubenet.
Cilium and Non-Cilium: Provides a uniform, seamless experience across both Cilium and non-Cilium data planes.
eBPF-Based Network Observability: Leverages eBPF (extended Berkeley Packet Filter) for performance and scalability to identify potential bottlenecks and congestion issues before they impact application performance. Gain insights into key network health indicators, including traffic volume, dropped packets, and connection information.
Deep Visibility into Network Activity: Understand how your applications are communicating with each other through detailed network flow logs.
Simplified Metrics Storage and Visualization Options: Choose between:
- Azure Managed Prometheus and Grafana: Azure manages the infrastructure and maintenance, allowing users to focus on configuring metrics and visualizing metrics.
- Bring Your Own (BYO) Prometheus and Grafana: Users deploy and configure their own instances and manage the underlying infrastructure.
Metrics
Node-Level Metrics
The following metrics are aggregated per node. All metrics include labels:
clusterinstance(Node name)
For non-Cilium data plane scenarios, Advanced Network Observability provides metrics for both Linux and Windows operating systems. The table below outlines the different metrics generated.
| Metric Name | Description | Extra Labels | Linux | Windows |
|---|---|---|---|---|
| networkobservability_forward_count | Total forwarded packet count | direction |
✅ | ✅ |
| networkobservability_forward_bytes | Total forwarded byte count | direction |
✅ | ✅ |
| networkobservability_drop_count | Total dropped packet count | direction, reason |
✅ | ✅ |
| networkobservability_drop_bytes | Total dropped byte count | direction, reason |
✅ | ✅ |
| networkobservability_tcp_state | TCP currently active socket count by TCP state. | state |
✅ | ✅ |
| networkobservability_tcp_connection_remote | TCP currently active socket count by remote IP/port. | address (IP), port |
✅ | ❌ |
| networkobservability_tcp_connection_stats | TCP connection statistics. (ex: Delayed ACKs, TCPKeepAlive, TCPSackFailures) | statistic |
✅ | ✅ |
| networkobservability_tcp_flag_counters | TCP packets count by flag. | flag |
❌ | ✅ |
| networkobservability_ip_connection_stats | IP connection statistics. | statistic |
✅ | ❌ |
| networkobservability_udp_connection_stats | UDP connection statistics. | statistic |
✅ | ❌ |
| networkobservability_udp_active_sockets | UDP currently active socket count | ✅ | ❌ | |
| networkobservability_interface_stats | Interface statistics. | InterfaceName, statistic |
✅ | ✅ |
Pod-Level Metrics (Hubble Metrics)
The following metrics are aggregated per pod (node information is preserved). All metrics include labels:
clusterinstance(Node name)sourceordestination
For outgoing traffic, there will be a source label with source pod namespace/name.
For incoming traffic, there will be a destination label with destination pod namespace/name.
| Metric Name | Description | Extra Labels | Linux | Windows |
|---|---|---|---|---|
| hubble_dns_queries_total | Total DNS requests by query | source or destination, query, qtypes (query type) |
✅ | ❌ |
| hubble_dns_responses_total | Total DNS responses by query/response | source or destination, query, qtypes (query type), rcode (return code), ips_returned (number of IPs) |
✅ | ❌ |
| hubble_drop_total | Total dropped packet count | source or destination, protocol, reason |
✅ | ❌ |
| hubble_tcp_flags_total | Total TCP packets count by flag. | source or destination, flag |
✅ | ❌ |
| hubble_flows_processed_total | Total network flows processed (L4/L7 traffic) | source or destination, protocol, verdict, type, subtype |
✅ | ❌ |
Limitations
- Pod-level metrics are available only on Linux.
- Cilium data plane is supported starting with Kubernetes version 1.29.
- Metric labels may have subtle differences between Cilium and non-Cilium clusters.
- Cilium data plane does not currently support DNS metrics.
Scale
Azure managed Prometheus and Grafana impose service-specific scale limitations. For more information, see Scrape Prometheus metrics at scale in Azure Monitor
Next steps
For more information about Advanced Container Networking Services for Azure Kubernetes Service (AKS), see What is Advanced Container Networking Services for Azure Kubernetes Service (AKS)?.
To create an AKS cluster with Advanced Network Observability and Azure managed Prometheus and Grafana, see Setup Advanced Network Observability for Azure Kubernetes Service (AKS) Azure managed Prometheus and Grafana.
To create an AKS cluster with Advanced Network Observability and BYO Prometheus and Grafana, see Setup Advanced Network Observability for Azure Kubernetes Service (AKS) BYO Prometheus and Grafana.

Azure Kubernetes Service
Feedback
Coming soon: Throughout 2024 we will be phasing out GitHub Issues as the feedback mechanism for content and replacing it with a new feedback system. For more information see: https://aka.ms/ContentUserFeedback.
Submit and view feedback for