Tutorial: vcperf and Windows Performance Analyzer
The C++ Build Insights tools are available in Visual Studio 2019 and later. To see the documentation for this version, set the Visual Studio Version selector control for this article to Visual Studio 2019 or later. It's found at the top of the table of contents on this page.
In this tutorial, you'll learn how to use vcperf.exe to collect a trace of your C++ build. You'll also learn how to view this trace in Windows Performance Analyzer.
Step 1: Install and configure Windows Performance Analyzer
WPA is a trace viewer available in the Windows Assessment and Deployment Kit (ADK). It's a separate utility that's not part of the components you can install with the Visual Studio installer.
A version of WPA that supports C++ Build Insights is only available in versions of the Windows ADK numbered 10.1.19041.0 or later.
To download and install WPA
NOTE: Windows 8 or above is required for installing the Windows Performance Analyzer.
Browse to the Windows ADK download page.
Download and install the latest version of the Windows ADK.
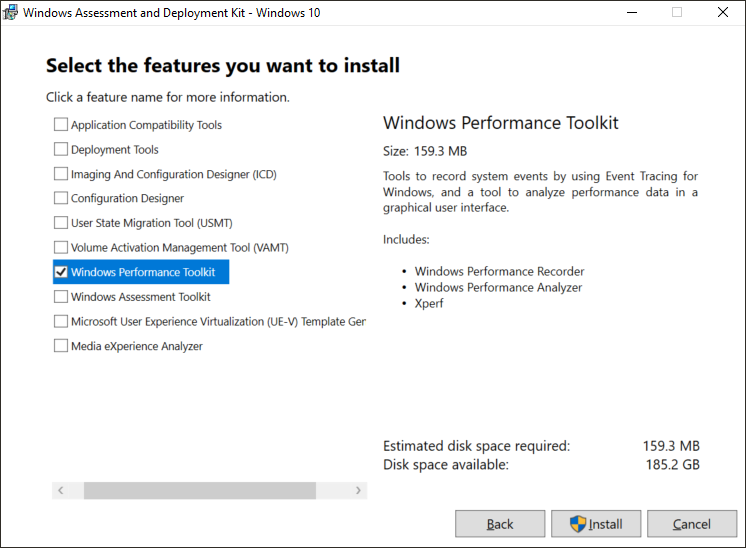
When prompted for the features that you want to install, select the Windows Performance Toolkit. You may select other features if you wish, but they're not required to install WPA.
To configure WPA
Viewing C++ Build Insights traces in WPA requires a special add-in. Follow these steps to install it:
Obtain the add-in by downloading one of the components below. You don't need to get both. Choose the one that you find most convenient.
- Visual Studio 2019 version 16.6 and above. For the latest version, see Visual Studio Downloads.
- C++ Build Insights NuGet package.
Copy the
perf_msvcbuildinsights.dllfile into your WPA installation directory.- In Visual Studio 2019 version 16.6 and above, this file is located here:
C:\Program Files (x86)\Microsoft Visual Studio\{Year}\{Edition}\VC\Tools\MSVC\{Version}\bin\Host{Architecture}\{Architecture}. - In the C++ Build Insights NuGet package, this file is located here:
wpa\{Architecture}. - In the paths above, replace the variables surrounded by curly brackets as follows:
{Year}is your Visual Studio product year, such as 2019 or 2022.{Edition}is your Visual Studio edition such as Community, Professional, or Enterprise.{Version}is your MSVC version. Choose the highest one available.{Architecture}: choosex64if you have a 64-bit version of Windows. Otherwise, choosex86.
- The WPA installation directory is typically:
C:\Program Files (x86)\Windows Kits\10\Windows Performance Toolkit.
- In Visual Studio 2019 version 16.6 and above, this file is located here:
In your WPA installation directory, open the
perfcore.inifile and add an entry forperf_msvcbuildinsights.dll.
Step 2: Trace your build with vcperf.exe
To view C++ Build Insights data, first collect it into a trace file by following these steps:
Open an x64 or x86 Native Tools Command Prompt for VS in administrator mode. (Right-click the Start menu item and choose More > Run as administrator.)
- Choose x64 if you have a 64-bit version of Windows. Otherwise, choose x86.
In the command prompt window, enter this command:
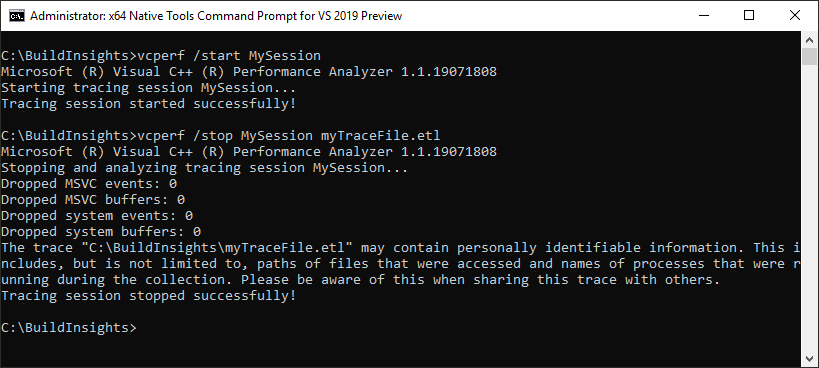
vcperf.exe /start SessionName
Choose a session name you'll remember for SessionName.
Build your project as you normally would. You don't need to use the same command prompt window to build.
In the command prompt window, enter this command:
vcperf.exe /stop SessionName traceFile.etl
Use the same session name you chose for SessionName before. Choose an appropriate name for the traceFile.etl trace file.
Here's what a typical vcperf.exe command sequence looks like in a developer command prompt window:
Important notes about vcperf.exe
Administrator privileges are required to start or stop a vcperf.exe trace. Use a developer command prompt window that you open by using Run as administrator.
Only one tracing session at a time may run on a machine.
Make sure to remember the session name you used to start your trace. It can be troublesome to stop a running session without knowing its name.
Just like cl.exe and link.exe, the command-line utility vcperf.exe is included in an MSVC installation. No additional steps are required to obtain this component.
vcperf.exe collects information about all MSVC tools running on your system. As a result, you don't have to start your build from the same command prompt you used to collect the trace. You can build your project from either a different command prompt, or even in Visual Studio.
vcperf.exe is open-source
If you wish to build and run your own version of vcperf.exe, feel free to clone it from the vcperf GitHub repository.
Step 3: View your trace in Windows Performance Analyzer
Launch WPA and open the trace you just collected. WPA should recognize it as a C++ Build Insights trace, and the following views should appear in the Graph Explorer panel on the left:
- Build Explorer
- Files
- Functions
- Template Instantiations
If you can't see these views, double-check that WPA is configured correctly, as described in Step 1. You can view your build data by dragging the views into the empty Analysis window on the right, as shown here:
Other views are available in the Graph Explorer panel. Drag them into the Analysis window when you're interested in the information they contain. A useful one is the CPU (Sampled) view, which shows CPU utilization throughout your build.
More information
Tutorial: Windows Performance Analyzer basics
Learn about common WPA operations that can help you analyze your build traces.
Reference: vcperf commands
The vcperf.exe command reference lists all the available command options.
Reference: Windows Performance Analyzer views
Refer to this article for details about the C++ Build Insights views in WPA.
Windows Performance Analyzer
The official WPA documentation site.
Feedback
Coming soon: Throughout 2024 we will be phasing out GitHub Issues as the feedback mechanism for content and replacing it with a new feedback system. For more information see: https://aka.ms/ContentUserFeedback.
Submit and view feedback for