Overview of Copilot for Power BI (preview)
APPLIES TO: ![]() Power BI Desktop
Power BI Desktop ![]() Power BI service
Power BI service
Copilot for Microsoft Fabric Public Preview is available in Power BI. Copilot helps you use the transformational power of generative AI to get the most from your data. This article provides an overview of the Copilot capabilities for Power BI.
Before your business can start using Copilot capabilities in Power BI, your administrator needs to Enable Fabric Copilot for Power BI.
Note
Copilot is not yet supported for sovereign clouds due to GPU availability.
Before you start using Copilot
For optimized results using Copilot for Power BI, you may need to do some clean-up work on your semantic model. Read the article Update your data model to work well with Copilot to see if you need to modify your semantic model so that Copilot can get insights from it.
For answers to common questions related to business data security and privacy to help your organization get started with Copilot for Fabric, see the articles in the Fabric documentation:
- Overview of Copilot for Fabric (preview)
- Privacy, security, and responsible use for Copilot for Fabric and Power BI
Copilot requirements
Note
- Your administrator needs to enable Copilot in Microsoft Fabric.
- Your F64 or P1 capacity needs to be in one of the regions listed in this article, Fabric region availability. If it isn't, you can't use Copilot.
- Your administrator needs to enable the tenant switch before you start using Copilot. See the article Copilot tenant settings for details.
- If your tenant or capacity is outside the US or France, Copilot is disabled by default unless your Fabric tenant admin enables the Data sent to Azure OpenAI can be processed outside your tenant's geographic region, compliance boundary, or national cloud instance tenant setting in the Fabric Admin portal.
- Copilot in Microsoft Fabric isn't supported on trial SKUs. Only paid SKUs (F64 or higher, or P1 or higher) are supported.
Feature overview: Copilot capabilities
Copilot for Power BI offers several capabilities to enhance your data interaction and report creation experience, currently available in Power BI Service and Desktop.
As a report author, you can use Copilot to help you write DAX queries, streamline your semantic model documentation, provide a summary about your semantic model, and help you get started with report creation. Additionally, Copilot can also create a narrative visual that summarizes a page or a whole report and can generate synonyms for Q&A, to help your report readers find what they're looking for in your reports. As a report consumer, you can use the Copilot pane to ask a question about your report content or summarize key insights in seconds.
Here are some examples of what Copilot can generate:
- A summary of the underlying semantic model
- Suggested content for a report
- A report page
- A summary of your report in the Copilot pane
- A summary visual on the report itself
- Synonyms to enhance Q&A
- Descriptions for your semantic model measures
- DAX queries
A summary of the underlying semantic model
Summarize a Power BI semantic model by asking Copilot to "summarize the model" in the Copilot pane. This summary can help you gain a better understanding of data in your semantic model, identify important insights, and improve your data exploration experience. Ultimately, this can help you build more meaningful reports.
Suggest content for a report
Copilot can help you get started on a new report by suggesting topics based on your data. When you select this option directly in the chat, Copilot evaluates the data and provides a report outline with suggested pages that you can explore and choose to create for you.
- A report outline of suggested pages for your report: for example, what each page in the report is about, and how many pages it creates.
- The visuals for the individual pages.

Create a report page
Copilot for Power BI can help you create a report page by identifying the tables, fields, measures, and charts for your data. If you give Copilot a high-level prompt that's specific to your data, it can generate a report page that you can then customize and modify, using the existing editing tools. It can help you get started on your report page quickly and save you a lot of time and effort in the process.
Here are some examples of high-level prompts to get you started:
- Create a page to evaluate the performance of different shifts based on good count, reject count, and alarm count over time.
- Create a page to analyze the efficiency of the production line and overall equipment effectiveness.
- Create a page to compare the cost and material of each product and their impact on production.
If you need help with writing prompts that get you the report page you want, see Write Copilot prompts that produce results in Power BI for guidance.
A summary of your report in the Copilot pane
Even if you don't have edit permission for a report, with Copilot you can generate a summary of a report page in the Copilot pane. You have the flexibility to refine or guide the summary by customizing prompts, such as "summarize this page using bullet points" or "Provide a summary of sales on this page."
You can also pose specific questions about the visualized data on a report page and receive a tailored response. This response includes references to specific visuals, aiding you in understanding the specific data sources contributing to each part of the answer or summary within the report.
Learn more about Copilot creating a summary response to prompts about your report.

A summary visual on the report itself
In Power BI Desktop and the Power BI service, you can use Copilot for Power BI to quickly create a narrative about a report page with just a few clicks. This narrative can summarize the entire report, specific pages, or even specific visuals that you select. See Create a narrative with Copilot for Power BI for details.

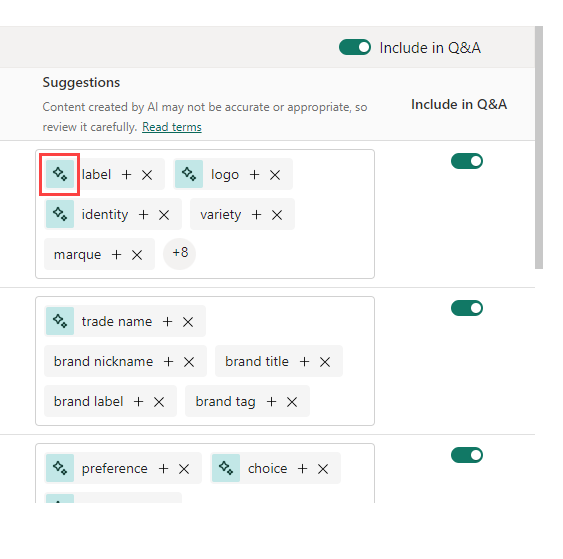
Synonyms to enhance Q&A
Copilot can write synonyms that you can add to Q&A to improve the Q&A visual's ability to understand user questions.
Descriptions for semantic model measures
Copilot can add descriptions to your semantic model measures. People who build reports from your semantic model can see the name and description of your measures, which makes the description property essential documentation.
Use Copilot to create measure descriptions.
Write DAX queries
Copilot can write a DAX query. For example, you can type in a prompt to describe what DAX query you would like it to generate, and select Send or press Enter. To run what is returned, select Keep it to add it to query tab. Then select Run or press F5 to see the results of the DAX query. Read more in the article Write DAX queries.
Power BI service
To access Copilot in Power BI service, the workspace has to be running on at least F64 or Premium capacity.
- To generate summarized insights in reports, you need at least read access to the workspace or permission to the app.
- To create the narrative visual and generate Copilot reports, you need edit access to the workspace.
- In Power BI Apps, free users can use the Copilot pane (as long as the workspace is compatible with Copilot).
Power BI Desktop
- To use Copilot in Power BI Desktop, you need edit access to a workspace that is on at least F64 or Power BI Premium in the Power BI service.
Considerations and limitations
We're continuously working to improve the quality of the report pages, including visuals and summaries generated by Copilot. Here are the current limitations.
- AI may generate content that has mistakes. Make sure it's accurate and appropriate before using it.
- The Copilot button in Desktop report view is always visible in the ribbon; however, Copilot will not work unless Copilot for Microsoft Fabric enabled in tenant settings and you have member or contributor access to at least one workspace that's assigned to a paid Fabric capacity (F64 or higher) or Power BI Premium capacity (P1 or higher).
- Unlike the Data pane or Visualization pane, you can't resize the Copilot pane at this time.
- If you have limited GPU capacity, Copilot may be throttled.
- Copilot can't modify the visuals after it has generated them.
- Copilot can't add filters or set slicers if you specify them in the prompts. For example, if you say: "Create a sales report for the last 30 days." Copilot can't interpret 30 days as a date filter.
- Copilot can't make layout changes. For example, if you tell Copilot to resize the visuals, or to align all the visuals perfectly, it won't work.
- Copilot can't understand complex intent. For example, suppose you frame a prompt like: "Generate a report to show incidents by team, incident type, owner of the incident, and do this for only 30 days." This prompt is complex, and Copilot will probably generate irrelevant visuals.
- Copilot doesn't produce a message for the skills that it doesn't support. For example, if you ask Copilot to edit or add a slicer, it doesn't complete the instruction successfully, as mentioned above. Unfortunately, it doesn't give an error message either.
- Read Update your data model to work well with Copilot for more tips.
Send feedback
We always welcome your feedback about our products. Especially during public preview, your feedback helps us improve the product faster.
Next steps
- Enable Copilot in Power BI
- Update your data model to work well with Copilot
- Create a report with Copilot in the Power BI service
- Create a report with Copilot in Power BI Desktop
- Write Copilot prompts for creating report pages in Power BI
- Create a narrative summary visual with Copilot for Power BI
- Write Copilot prompts for creating narrative visuals in Power BI
- Overview of Copilot for Fabric (preview)
- Frequently asked questions about Copilot for Power BI and Fabric
- Privacy, security, and responsible use for Copilot article in the Fabric documentation
- Copilot tenant settings (preview) article in the Fabric documentation
- Enhance Q&A with Copilot for Power BI
Feedback
Coming soon: Throughout 2024 we will be phasing out GitHub Issues as the feedback mechanism for content and replacing it with a new feedback system. For more information see: https://aka.ms/ContentUserFeedback.
Submit and view feedback for