Monitor and alert with LoadBalancerHealthEvent logs
In this article, you learn how to monitor and alert with Azure Load Balancer health event logs. These logs can help you identify and troubleshoot ongoing issues affecting your load balancer resource’s health. The health event logs are provided through the Azure Monitor resource log category LoadBalancerHealthEvent.
Important
LoadBalancerHealthEvent logs for Azure Load Balancer is currently in Preview and is available in all Azure public regions. While in Preview, the log structure, event types, publishing behavior, and other aspects of this feature may change in response to feedback.
This preview version is provided without a service level agreement, and it's not recommended for production workloads. Certain features might not be supported or might have constrained capabilities. For more information, see Supplemental Terms of Use for Microsoft Azure Previews.
Prerequisites
- An Azure subscription. If you don't have an Azure subscription, create a free account.
- An Azure Load Balancer resource. To learn how to create a Load Balancer resource, see Quickstart: Create a public Standard Load Balancer.
- An Azure Monitor Log Analytics workspace. To learn how to create a Log Analytics workspace, see Quickstart: Create a Log Analytics workspace.
Configuring diagnostic settings to collect LoadBalancerHealthEvent logs
In this section, you learn configure diagnostic settings to collect LoadBalancerHealthEvent logs and store the logs in a log analytics workspace.
Important
We recommend sending your logs to a Log Analytics workspace, which will enable you to control access, log data retention and archive settings, and more. To learn more about configuring Log Analytics workspaces, see Log Analytics workspace overview - Azure Monitor.
In the Azure portal, navigate to your load balancer resource.
From your load balancer resource's Overview page, choose Monitoring > Diagnostic settings.
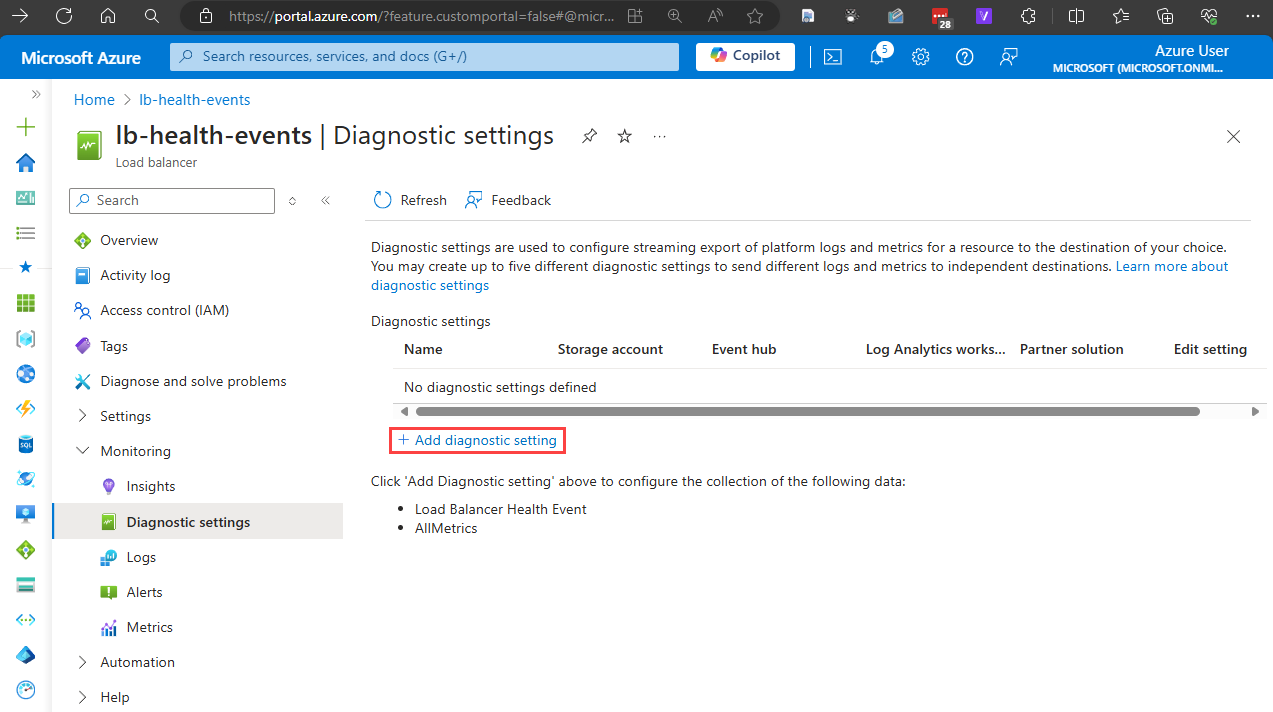
Select + Add diagnostic setting.
In the Diagnostic setting window, select or enter the following settings:
Setting Value Diagnostic setting name Enter a name for the diagnostic setting. Logs Category Groups Select LoadBalancerHealthEvent or Load Balancer Health Event. Metrics Leave unchecked. Destination details Select Send to Log Analytics workspace.Select your subscription and your Log Analytics workspace. Note
Selecting AllLogs will result in all new log categories for load balancer resources to be automatically collected as they are supported. If you don't want this option, select only the log categories you want to collect. In this case, Load Balancer Health Event logs.
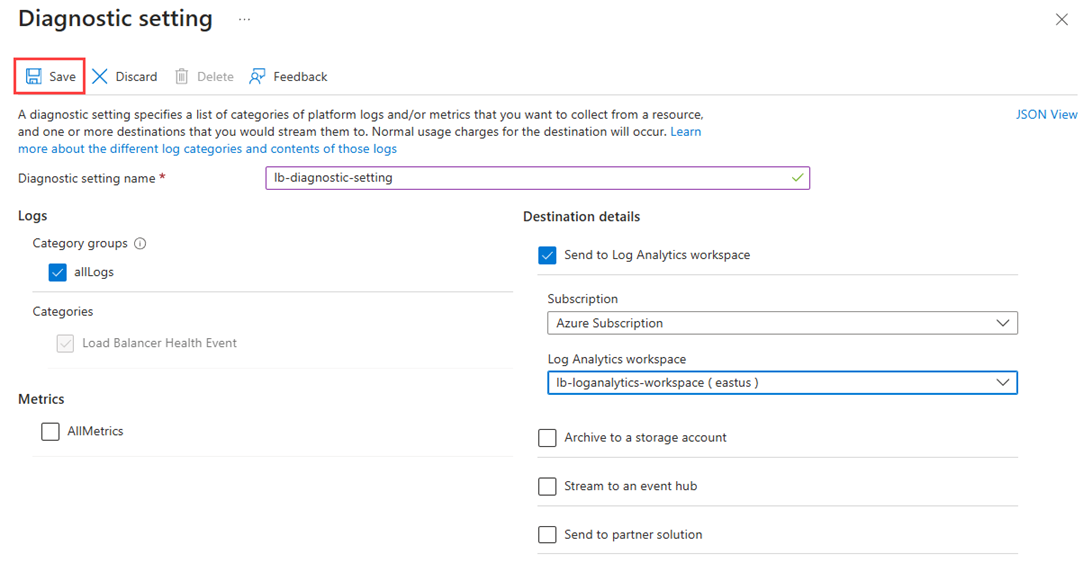
Select Save and close the Diagnostic setting window.
Note
Once your diagnostic setting has been configured, it can take up to 90 minutes for logs to begin appearing. If there are no health events affecting your load balancer, you may not see any logs.
Configure a log query
In this section, you learn how to query LoadBalancerHealthEvent logs in a Log Analytics workspace. In this example, you query for the latest SnatPortExhaustion health events from the last day, and summarize the events by the load balancer’s resource IDs and frontend IP configurations.
In the Azure portal, navigate to your load balancer resource.
From your load balancer resource’s Overview page, choose Monitoring > Logs.
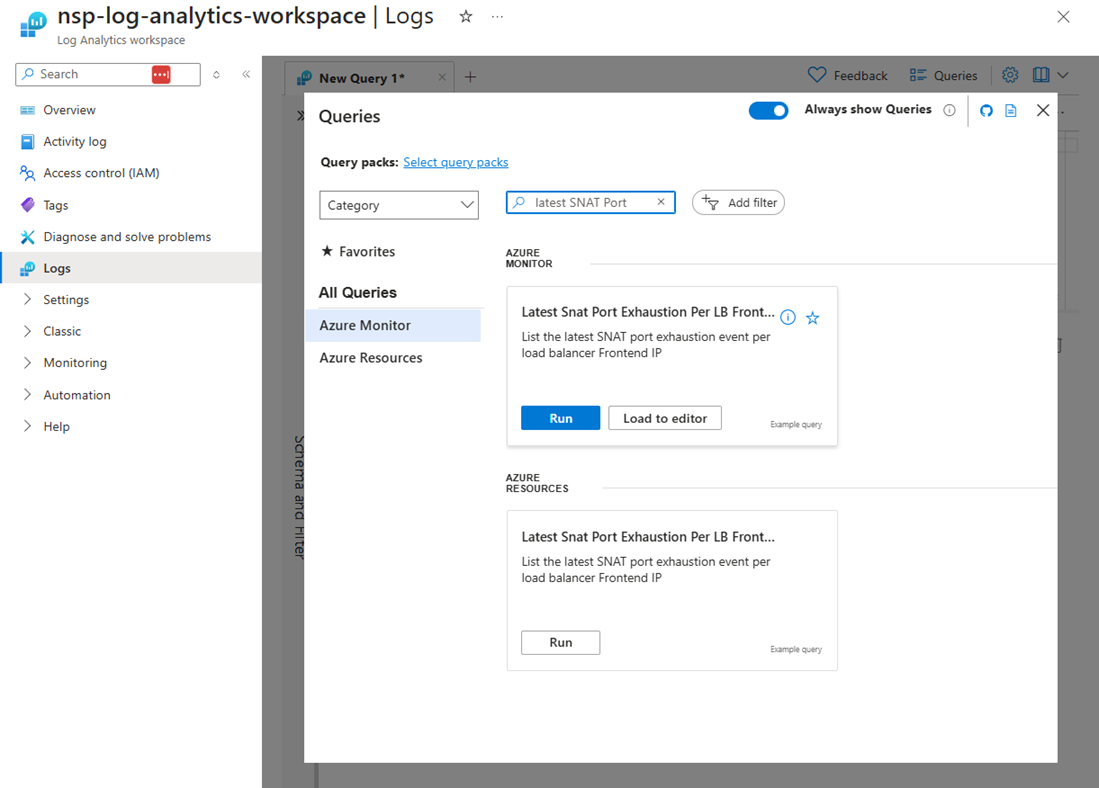
In the Queries window, enter Latest SNAT Port in the search bar.
From the results, select Load to editor under Latest SNAT Port Exhaustion per LB Frontend.
The following code is displayed in the query editor:
    // Latest Snat Port Exhaustion Per LB Frontend
    // List the latest SNAT port exhaustion event per load balancer Frontend IP
    ALBHealthEvent
    | where TimeGenerated > ago(1d)
    | where HealthEventType == "SnatPortExhaustion"
    | summarize arg_max(TimeGenerated, *) by LoadBalancerResourceId, FrontendIP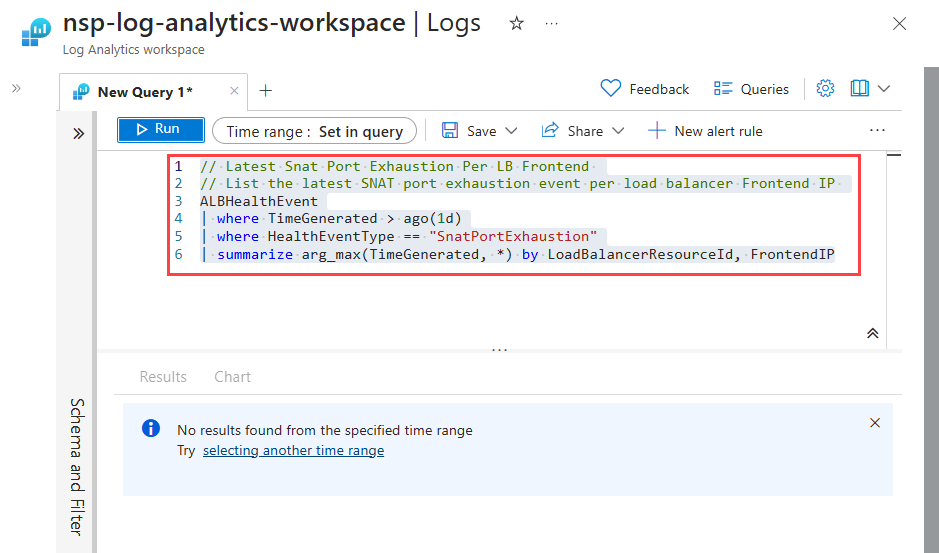
Select Run to execute the query.
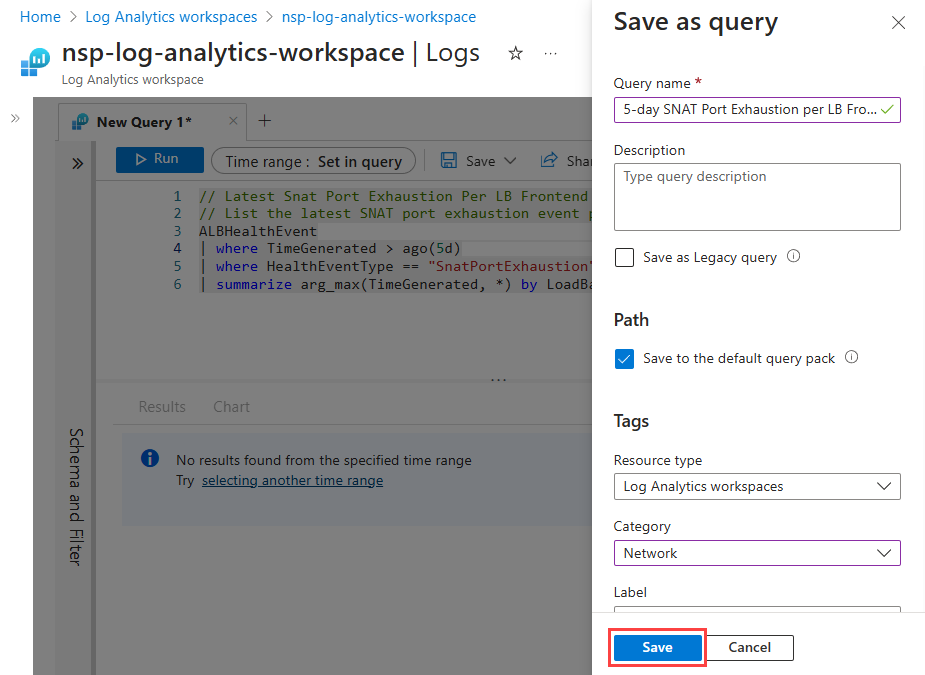
If you want to modify and save the query, make your query changes and select Save>Save as query.
In the Save a query window, enter a name for the query, other optional information, and select Save.
Create alerts based on LoadBalancerHealthEvent logs
In this section, you learn how to create an alert that sends an email whenever a SnatPortExhaustion event is logged within the past 5 minutes. You can create alerts based on log queries to be notified immediately when health event logs are generated, indicating potential impact to your load balancer resource.
In the Azure portal, navigate to your load balancer resource.
From your load balancer resource’s Overview page, choose Monitoring > Alerts.
On the Alerts page, select Create customer alert rule.
On the Create an alert rule page, choose Custom log search under Signal name.
In the Logs window for Log Analytics, enter the following query and select Run:
    ALBHealthEvent
    | where TimeGenerated > ago(5m)
    | where HealthEventType == "SnatPortExhaustion"
    | summarize arg_max(TimeGenerated, *) by LoadBalancerResourceId, FrontendIP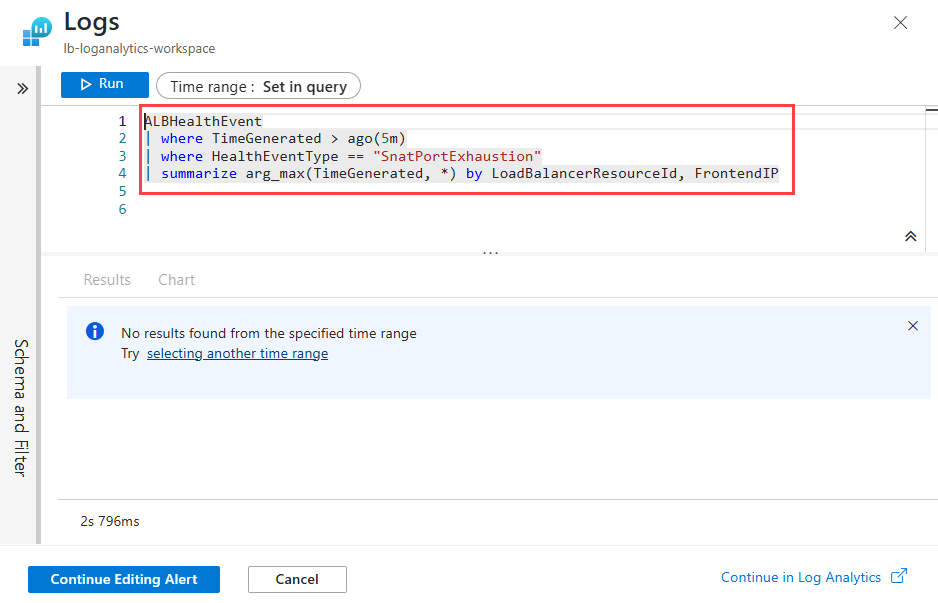
Select Continue Editing Alert
On the Conditions tab, set the Threshold value to 0 under Alert logic.
Select Next: Actions> or the Actions tab.
On the Select an action group page, select + Create action group.
On the Basics tab, enter the following settings then select Next: Notifications:
Setting Value Project details Subscription Select your subscription. Resource group Select the resource group that contains your Log Analytics workspace. Region Select the region for the action group. Instance details Action group name Enter a name for the action group. Display name Enter a display name for the action group. 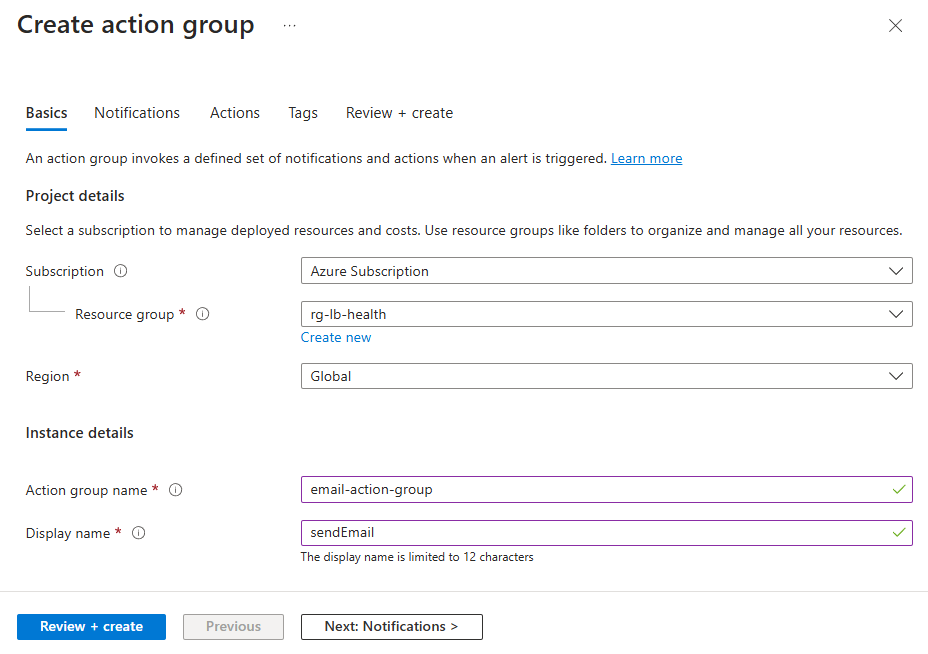
On the Notifications tab, enter the following settings:
Setting Value Notification type Select Email/SMS message/Push/Voice.Enter the email address to receive the alert.Select Ok. Name Enter a name for the notification. 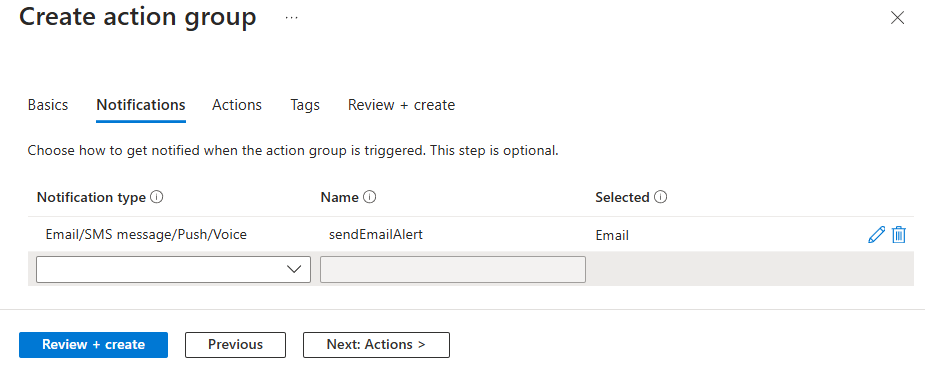
Select Review + create then Create to create the action group.
On the Create an alert rule page, select Next: Details or the Details tab.
On the Details tab, enter the following settings:
-
Setting Value Severity Select the severity level for the alert. Alert rule name Enter a name for the alert rule. Alert rule description Enter a description for the alert rule. Severity Select the severity level for the alert. Region Select the region for the alert rule. 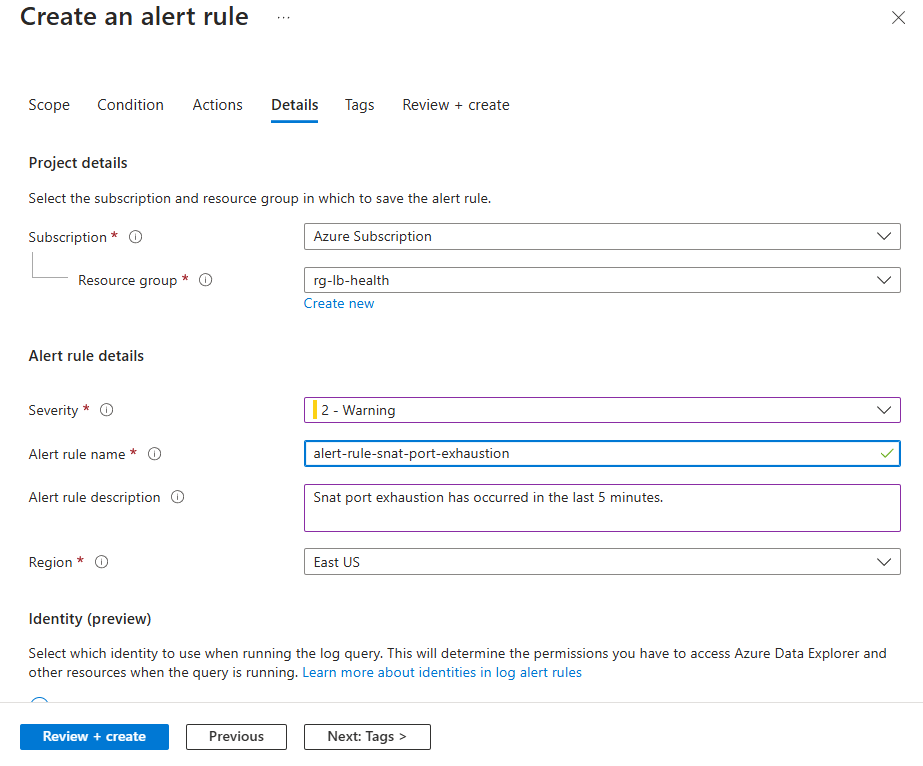
Select Review + create then Create to create the alert rule.
Next steps
In this article, you learned how to collect, analyze, and create alerts using these logs.
For more information about Azure Load Balancer health event logs and health event types, along with how to troubleshoot each health event type, see:
Feedback
Coming soon: Throughout 2024 we will be phasing out GitHub Issues as the feedback mechanism for content and replacing it with a new feedback system. For more information see: https://aka.ms/ContentUserFeedback.
Submit and view feedback for