Azure IoT
A category of Azure services for internet of things devices.
378 questions
This browser is no longer supported.
Upgrade to Microsoft Edge to take advantage of the latest features, security updates, and technical support.
' cx='32' cy='32' r='32' /%3E%3Ctext x='50%25' y='55%25' dominant-baseline='middle' text-anchor='middle' fill='%23FFF' %3EGO%3C/text%3E%3C/svg%3E)
Hey Microsoft,
What is the suggested way to pivot Data History from Azure Digital Twins, so that multiple properties of a single twin can be rendered, whether they are nested in a component or not?
Currently, all documentation focuses on selecting a single property (/key) from one or multiple twins. This data is then sometimes rendered from a single or multiples twins, but it always seems to be focused on a single key. What is the best way to come to a table where we can extend multiple columns to render multiple keys in a single chart (i.e. temperature and humidity over time from a single sensor)?
Example: https://learn.microsoft.com/en-us/azure/digital-twins/how-to-use-data-history?tabs=cli
Data is filtered based on a single Key (property OutFlow) which is then displayed for machine C0 and C1 but what if the render should contain InFlow and OutFlow for just machine C0.
This sounds like a very easy task but the problem is that all keys are in a single column of the Data Explorer as well as all values as dynamic. We have pivoted the table based on the Key column which results almost in the table that we desire, but some properties are inside components which then generates columns named component.key1, component.key2.
To add to that, with the pivoted table and a single column extended to a simple name (component.temperature to temperature for example) and then converted to double, the table looks fine but the dashboard tool is unable to create visuals.
Hopefully the question is clear and the added information is of value, otherwise please ask which part is vague so I can provide more information.
Thanks in advance,
Giel Oomen
' cx='32' cy='32' r='32' /%3E%3Ctext x='50%25' y='55%25' dominant-baseline='middle' text-anchor='middle' fill='%23FFF' %3EQ%3C/text%3E%3C/svg%3E)
Hello @Giel Oomen Could you please add images or screenshots of the Data Explorer issue so that the question stays focused with smaller queries. Images or any screenshots will add more readability to understand what is your actual ask over here, thanks for your understanding!
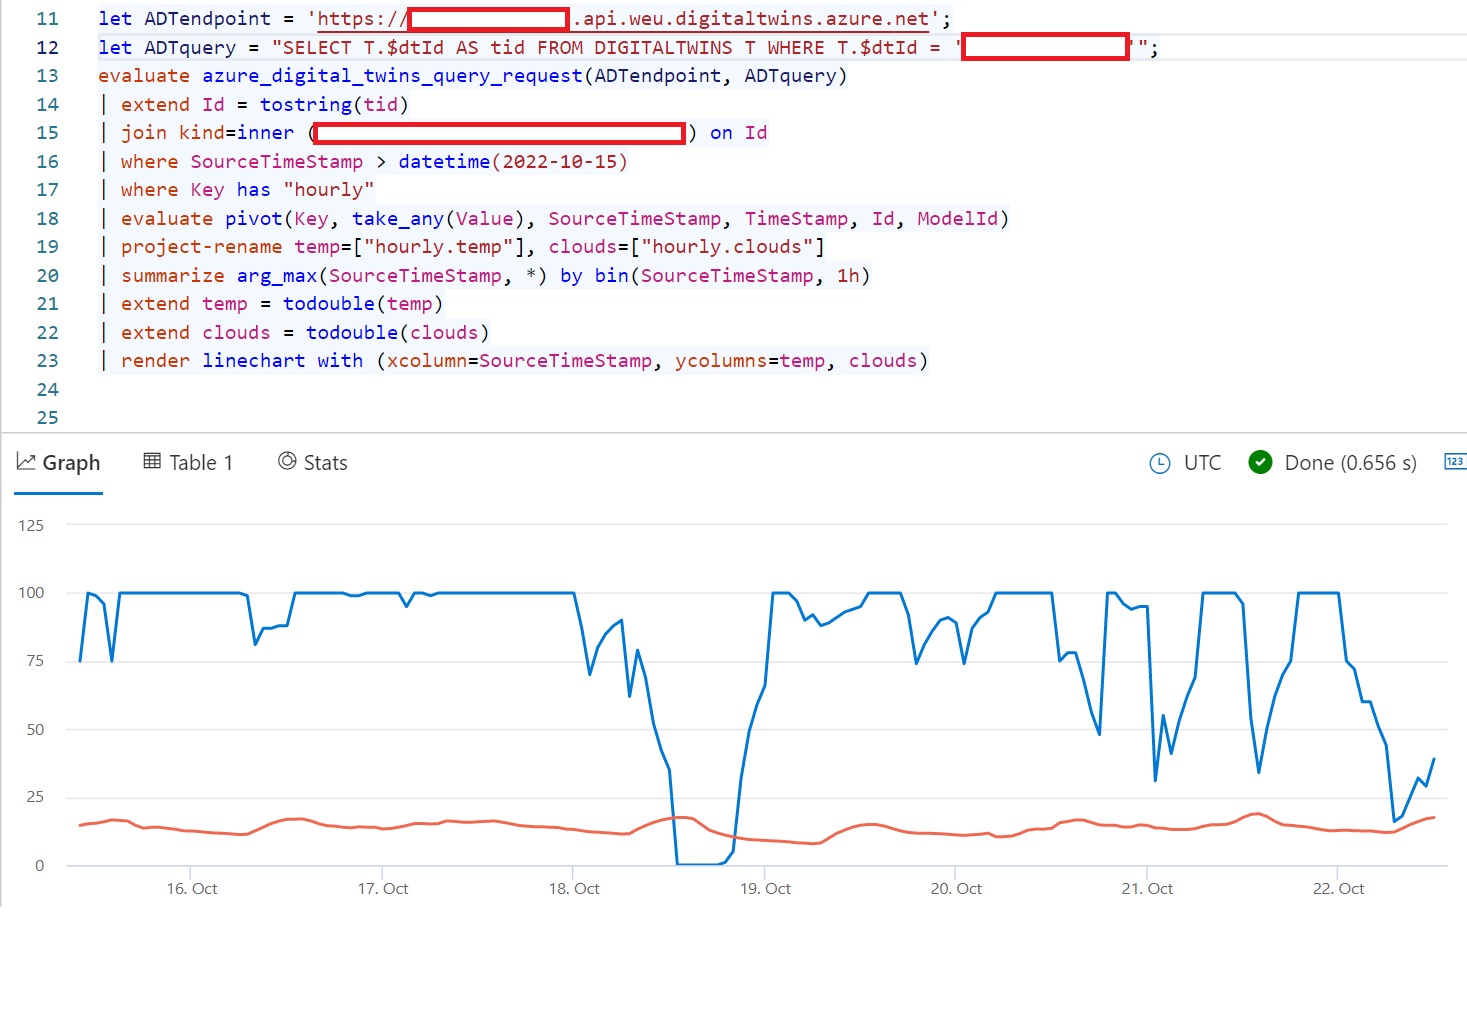
We actually just managed to fix this ourselves, I will add the query for people in the future. Query + solution below.
What we are doing is selecting a single twin containing weather forecast data. This hourly forecast data exists in a component called hourly so we filter out all non-hourly twin data.
Then we rename hourly.temp and hourly.clouds to simple names and only grab the most recent forecast for each SourceTimeStamp binned by the hour with arg_max and bin.
Finally, temp and clouds are converted to doubles to be able to graph the data (they are dynamics until now, that is how the data comes in before the pivot).
This example contains some more information than just pivotting and graphig two different properties from the same twin instance.