Azure Monitor
An Azure service that is used to collect, analyze, and act on telemetry data from Azure and on-premises environments.
2,819 questions
This browser is no longer supported.
Upgrade to Microsoft Edge to take advantage of the latest features, security updates, and technical support.
' cx='32' cy='32' r='32' /%3E%3Ctext x='50%25' y='55%25' dominant-baseline='middle' text-anchor='middle' fill='%23FFF' %3EN%3C/text%3E%3C/svg%3E)
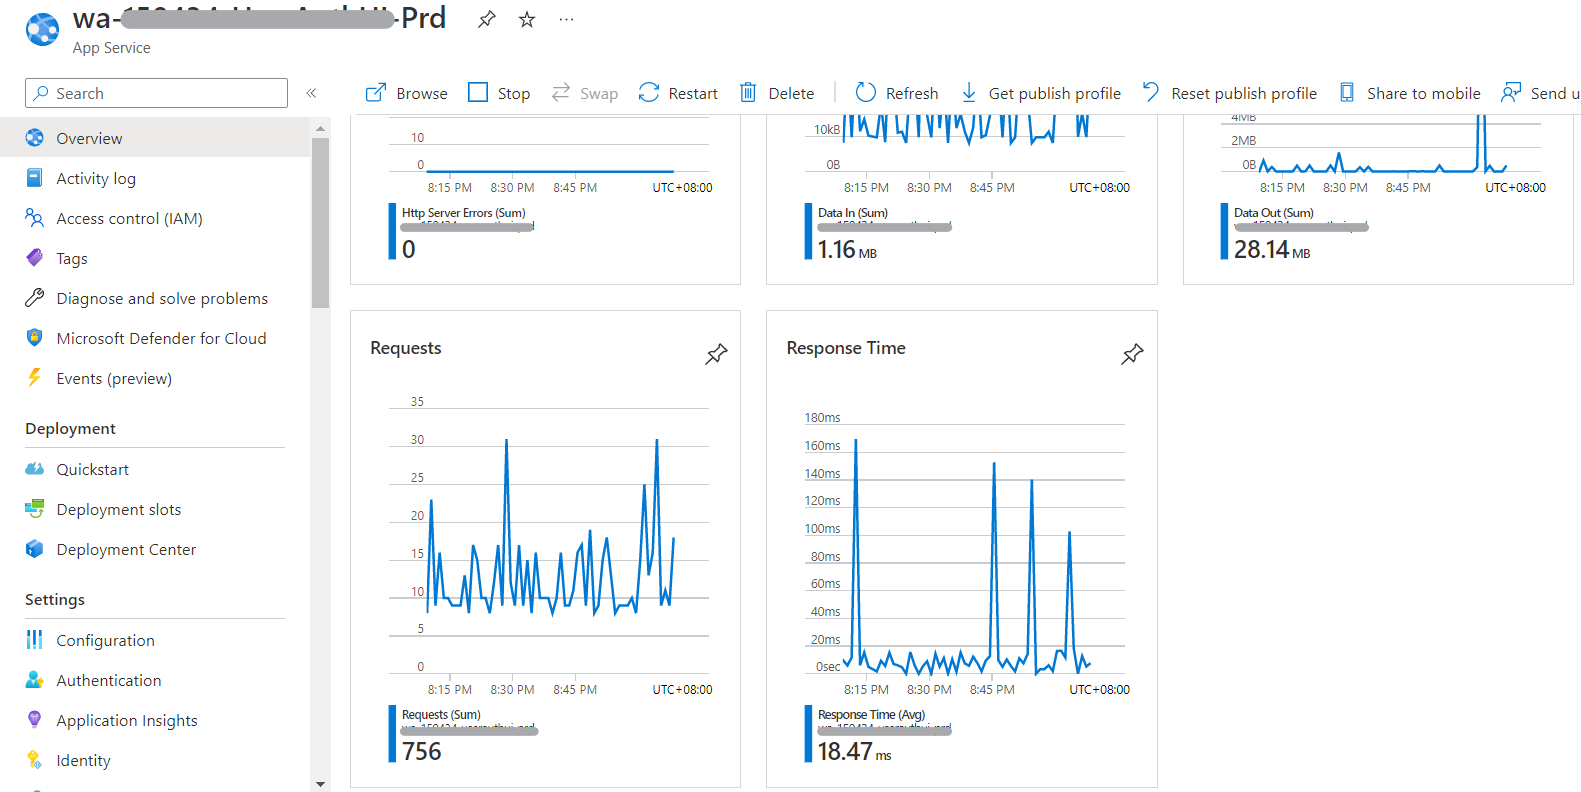
I have a web app hosted in Azure. I created function apps and app service with application insights enabled on each resource. As you can see from the screenshot of my app service, there is a metric data:
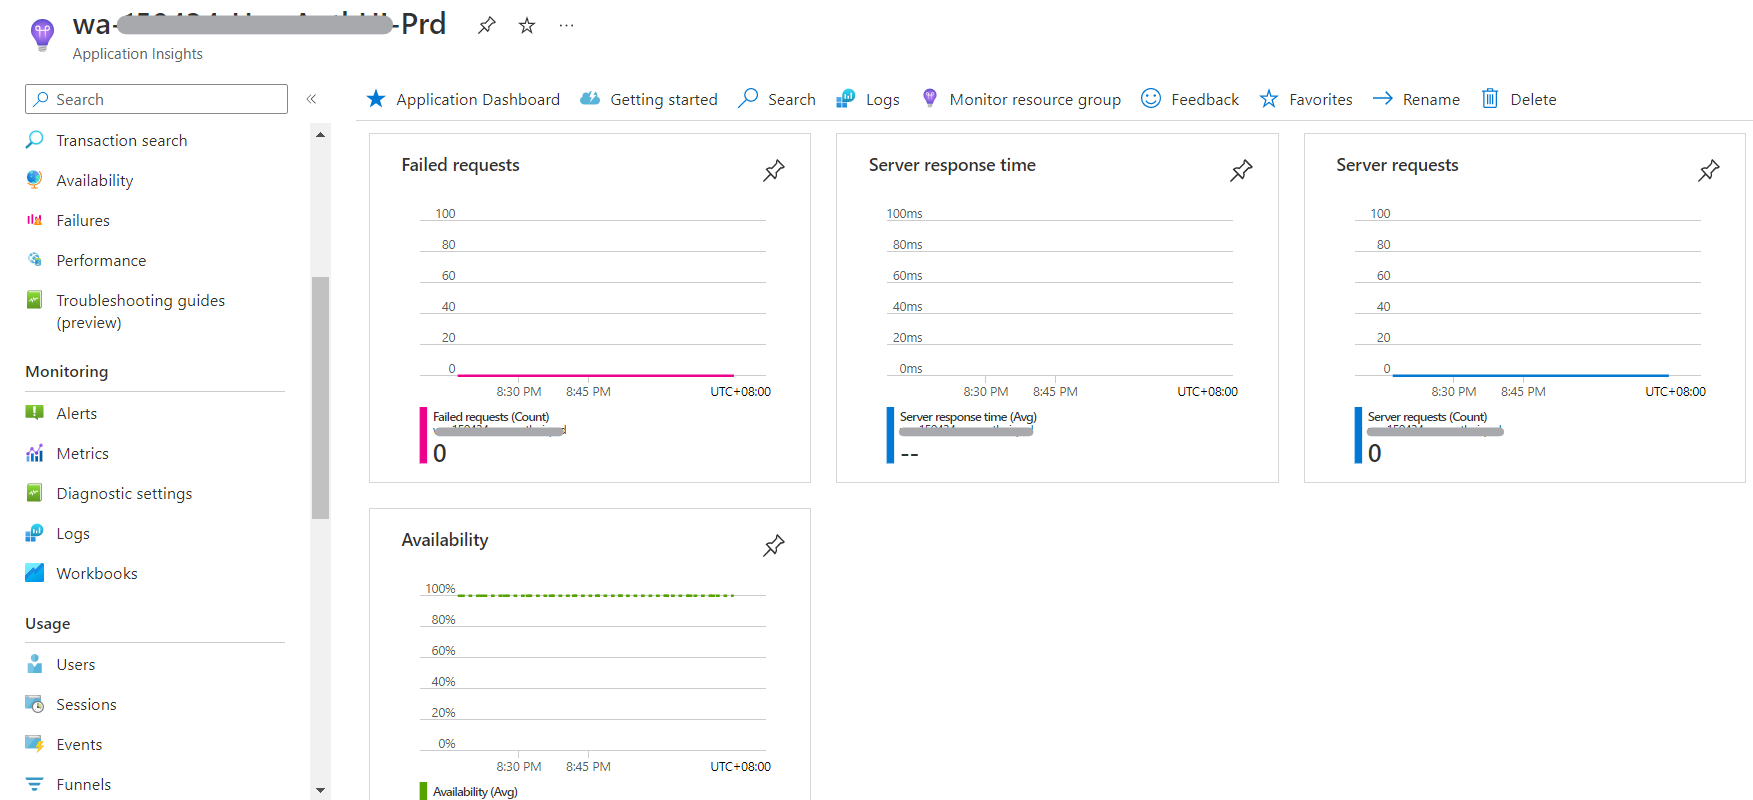
But when I checked its application insights, there are no data in the metrics:
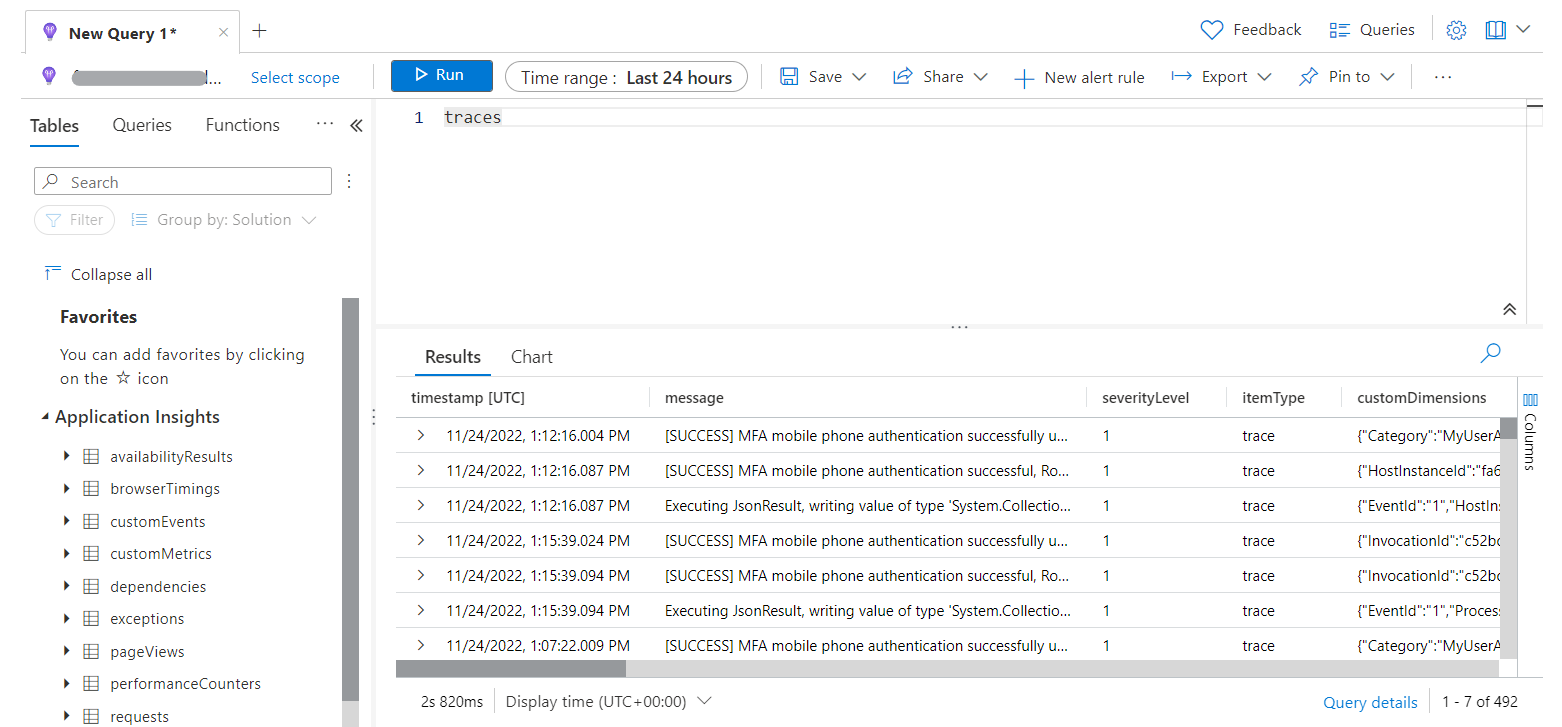
I also checked traces from the logs and there are data being logged.
I would like to know why data is not reflected on the application insights. The instrumentation key are matched with the app settings of function app/app service. Hope you can help me on this issue. Thanks!

Hi there,
WebApp doesn't require to enable Application Insights
By default, every WebApp has a bunch of default "free" platform-based metrics that could be used for monitoring of the WebApp instance itself.
If you need to get more specific data related to the application itself (code-based telemetry), it requires to enable the Application Inisights.
Literally, default platform metrics are being collected from Control Plane, ApplicationInisights metrics are being collected from "Data Plane"
Both they are different pillars of data.
p.s. traces table is a log-based data, metrics for Application Insights are collecting in Application Insights itself
Hi @Maxim Sergeev ,
Thank you for your comment. But I am experiencing this issue also on my function app. Would you know why there are no metrics reflected on the app insights? Am I missing some configurations? I would appreciate your reply, thanks!
Actually, your FunctionApp is a WebApp. What kind of metrics information you are looking for?
Yes, the one on the screenshots are for the web app service but I also have created function apps for the same app. The metrics that I am looking for are these:
' cx='32' cy='32' r='32' /%3E%3Ctext x='50%25' y='55%25' dominant-baseline='middle' text-anchor='middle' fill='%23FFF' %3ESM%3C/text%3E%3C/svg%3E)
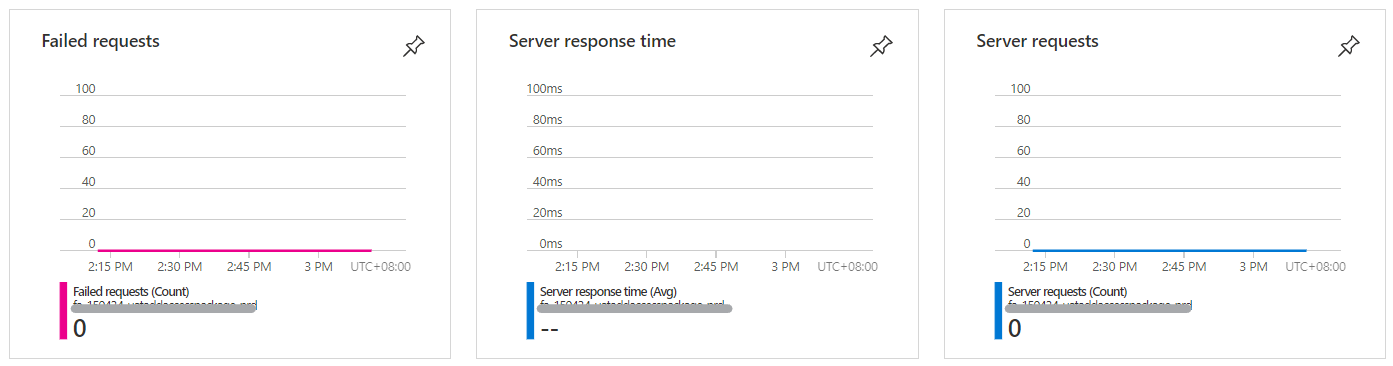
@nabi04 Can you please verify whether there is data logged for the above charts within application insights? You can below queries to verify them.
Server Response Time :
requests
| where notempty(duration)
| extend request_duration = iif(itemType == 'request', duration, todouble(''))
| extend _sum = request_duration
| extend _count = itemCount
| extend _sum = _sum*_count
| summarize sum(_sum) / sum(_count) by bin(timestamp, 1m)
| render timechart
Failed Requests :
requests
| where success == 'False'
| summarize sum(itemCount) by bin(timestamp, 5m)
| render barchart
Server requests:
requests
| where client_Type != "Browser"
| summarize count_=sum(itemCount) by bin(timestamp, 1m)
| extend ["request"]='Overall'
| render timechart
If the above results don't show any data, then the charts are displaying correct information.