Azure App Service
Azure App Service is a service used to create and deploy scalable, mission-critical web apps.
6,956 questions
This browser is no longer supported.
Upgrade to Microsoft Edge to take advantage of the latest features, security updates, and technical support.
' cx='32' cy='32' r='32' /%3E%3Ctext x='50%25' y='55%25' dominant-baseline='middle' text-anchor='middle' fill='%23FFF' %3ES%3C/text%3E%3C/svg%3E)
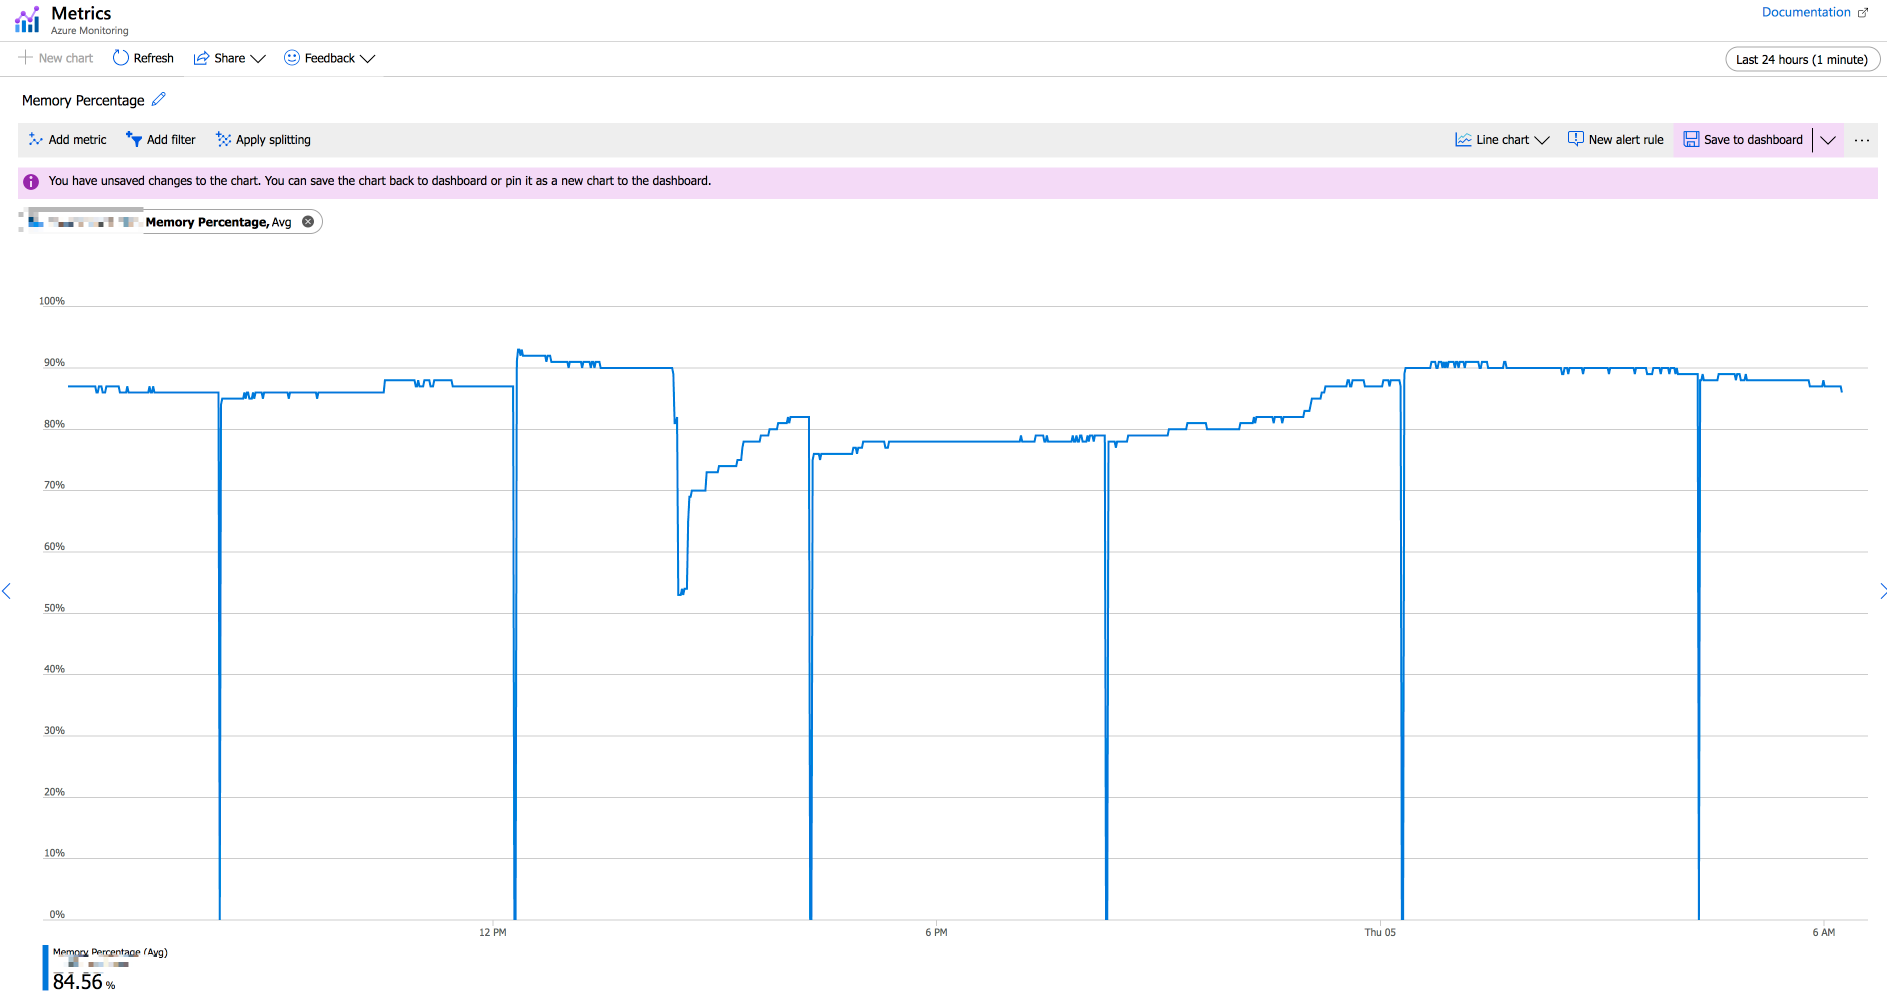
I'm having a container web app, the memory usage pattern in the graph looks odd. Memory keeps increasing to around 90% but the application process takes about 50% only, sometime it downs to 0, do you know why?
' cx='32' cy='32' r='32' /%3E%3Ctext x='50%25' y='55%25' dominant-baseline='middle' text-anchor='middle' fill='%23FFF' %3EA%3C/text%3E%3C/svg%3E)
@scott , Welcome to Microsoft Q&A! Thanks for posting this question.
On which region have you hosted your WebApp?
Has this been the case since the app was provisioned or you recently started to see this memory leak? If it's the latter, were there any changes performed prior to this issue?
Firstly, run the "Memory usage" diagnostic, to do this, use the Diagnose and solve problems blade in the Azure portal.
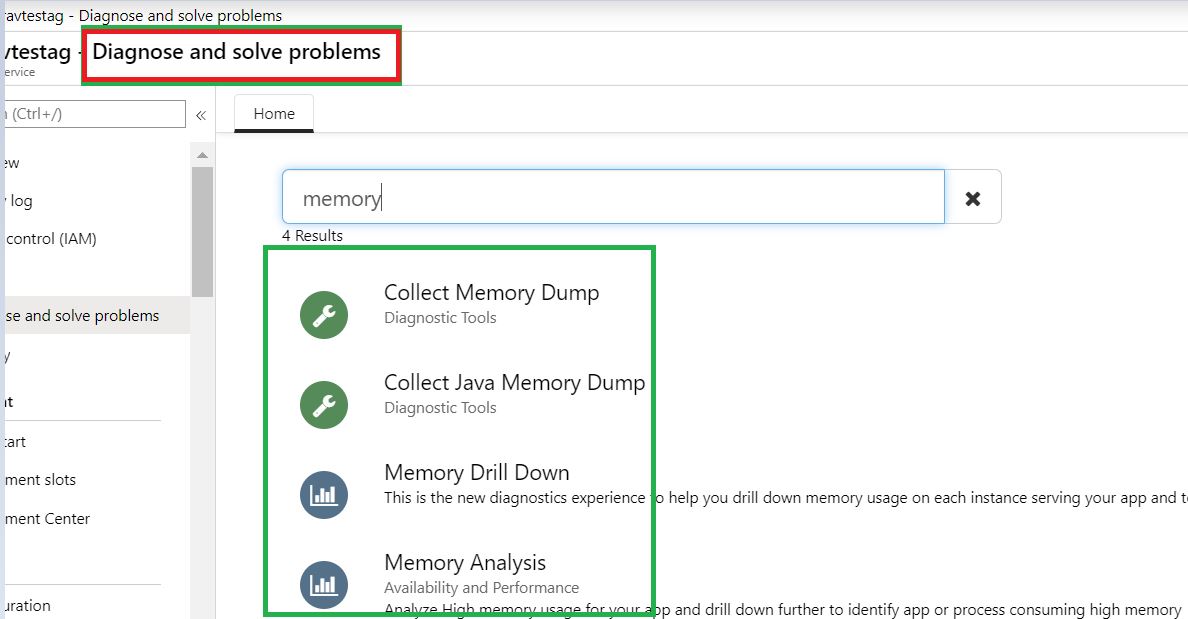
In some high memory-consumption scenarios, your app might truly require more computing resources. In that case, consider scaling to a higher service tier so the application gets all the resources it needs. Other times, a bug in the code might cause a memory leak. A coding practice also might increase memory consumption. Getting insight into what's triggering high memory consumption is a two-part process: create a process dump, and then analyze the process dump (as highlighted in the screenshot).
Furthermore, you could also review the Service Health and Resource Health notifications - The ‘Service Health’ - Service issues view shows any ongoing problems in Azure services that are impacting your resources. You can understand when the issue began, and what services and regions are impacted. You can also read the most recent update to understand what Azure is doing to resolve the issue.
Where as the Resource health helps you diagnose and get support when an Azure issue impacts your resources. It informs you about the current and past health of your resources and helps you mitigate issues.
hi @ajkuma , the region is South-east Asia. This high memory consumption has happened since beginning but I've just noticed the dropping to 0 of memory recently. When checked processes in the container, I see it only takes total about 50%, what about the rest, how do I know all processes using memory of the instance?
Also is there an explanation for periodically drop to 0% of memory?
Thank for the update! Getting insight into what's triggering high memory consumption is a two-part process: create a process dump, and then analyze the process dump (as highlighted in the screenshot).
As mentioned in my previous post - In some high memory-consumption scenarios, your app might truly require more computing resources. In that case, consider scaling to a higher service tier so the application gets all the resources it needs. Other times, a bug in the code might cause a memory leak. A coding practice also might increase memory consumption.
Sorry I still don't get it, I see no connections between periodically drop memory consumption to 0%
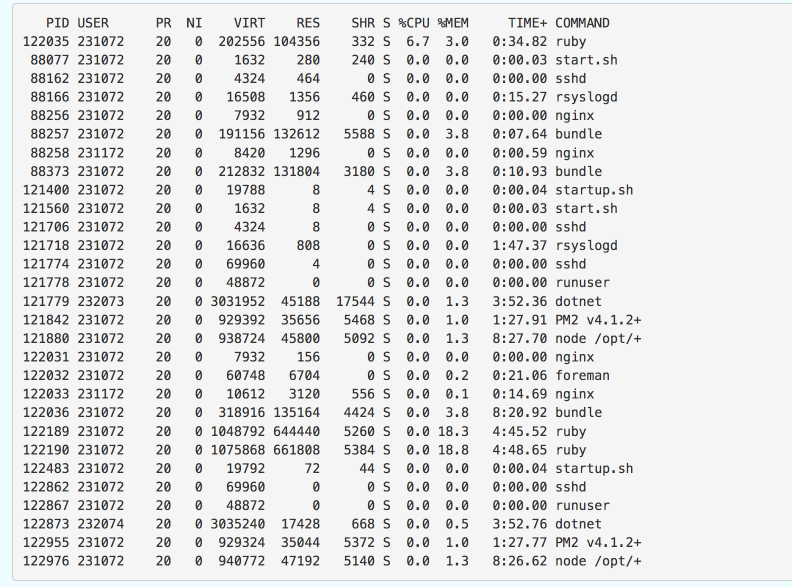
This is the dump process list from instance and I don't see there is memory leak from there, sum memory consumption would only take about 50 - 60 percent, what are the rest 20 - 30 percent consumption? I have no visibility on that.
I wish to engage with you offline further for a detailed analysis and provide a specialized assistance, so could you please send an email to me - AzCommunity[at]Microsoft[dot]com referencing this thread, your Azure subscription ID and the WebApp name in question. Thanks!