Hi ALL,
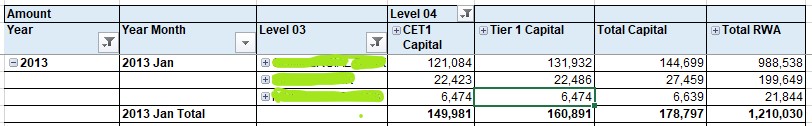
I have a dimension 'XYZ' with hierarchy up to level 7. When I drag level 04 of this dim (along with other dim) into pivot against measure value. I am getting below display. And this is expected result. Here I am connecting excel to cube from environment test1.
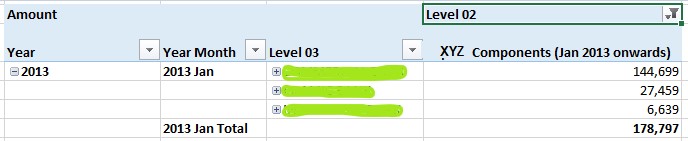
Problem is when I am browsing SAME thing with exactly same measures and dims from other environment test2.
When I drag level 04 of 'XYZ' dim (along with other dim) into pivot against measure value, it always shows level 02(highest level). whichever level I drag into pivot, it only shows level 02 as below.
Cube structure in both environment is exactly same. And one excel is being used to connect to both different cubes form 2 different test servers.
may this be an issue with excel pivot setting?
Please help . any tips, tricks, suggestion will be very much helpful.
Many Thanks
' cx='32' cy='32' r='32' /%3E%3Ctext x='50%25' y='55%25' dominant-baseline='middle' text-anchor='middle' fill='%23FFF' %3EKS%3C/text%3E%3C/svg%3E)
' cx='32' cy='32' r='32' /%3E%3Ctext x='50%25' y='55%25' dominant-baseline='middle' text-anchor='middle' fill='%23FFF' %3EDG%3C/text%3E%3C/svg%3E)
' cx='32' cy='32' r='32' /%3E%3Ctext x='50%25' y='55%25' dominant-baseline='middle' text-anchor='middle' fill='%23FFF' %3ELY%3C/text%3E%3C/svg%3E)