SQL Server Reporting Services
A SQL Server technology that supports the creation, management, and delivery of both traditional, paper-oriented reports and interactive, web-based reports.
2,928 questions
This browser is no longer supported.
Upgrade to Microsoft Edge to take advantage of the latest features, security updates, and technical support.
' cx='32' cy='32' r='32' /%3E%3Ctext x='50%25' y='55%25' dominant-baseline='middle' text-anchor='middle' fill='%23FFF' %3ESA%3C/text%3E%3C/svg%3E)
Hello,
We're experiencing some problems using a bar/range chart in SSRS. I couldn't post an RDL as this extension is not supported (nor rename it as XML and upload that), so I posted the XML for the RDL file below as a code block. Simply put it into a .rdl file in order to test the report.
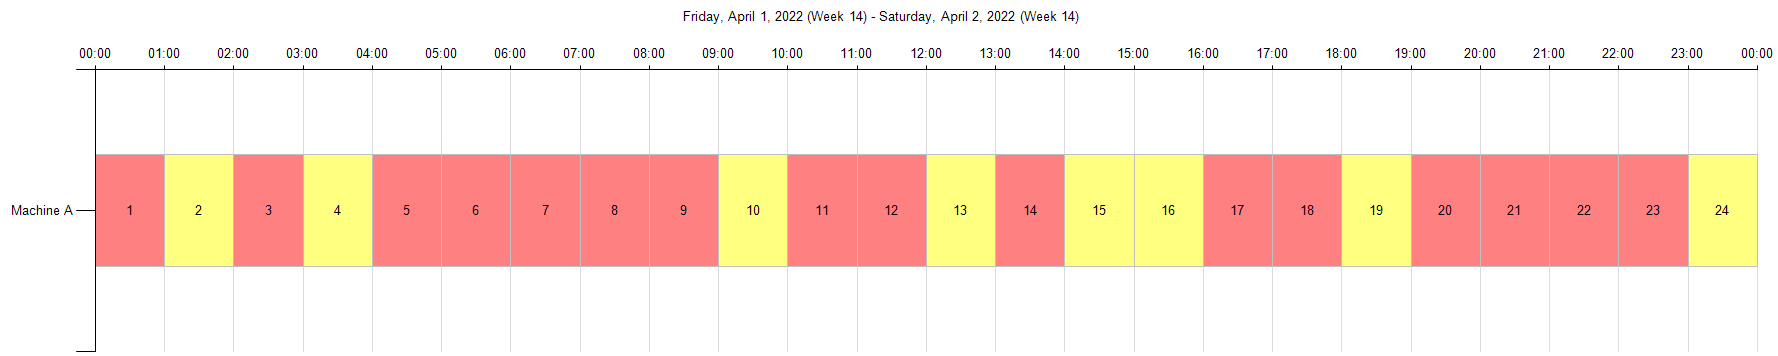
The report shows the performance data for a specific machine. For every hour that has passed, the report shows a number that represents its performance. The number is located on top of a bar, and the bar's background color shows whether this was sufficient or not. The actual values are irrelevant here, I even made this easier to read by simply counting up. Also, the data has been reduced to a single machine, in an attempt to find our problem (however we didn't manage to solve it, hence this post).
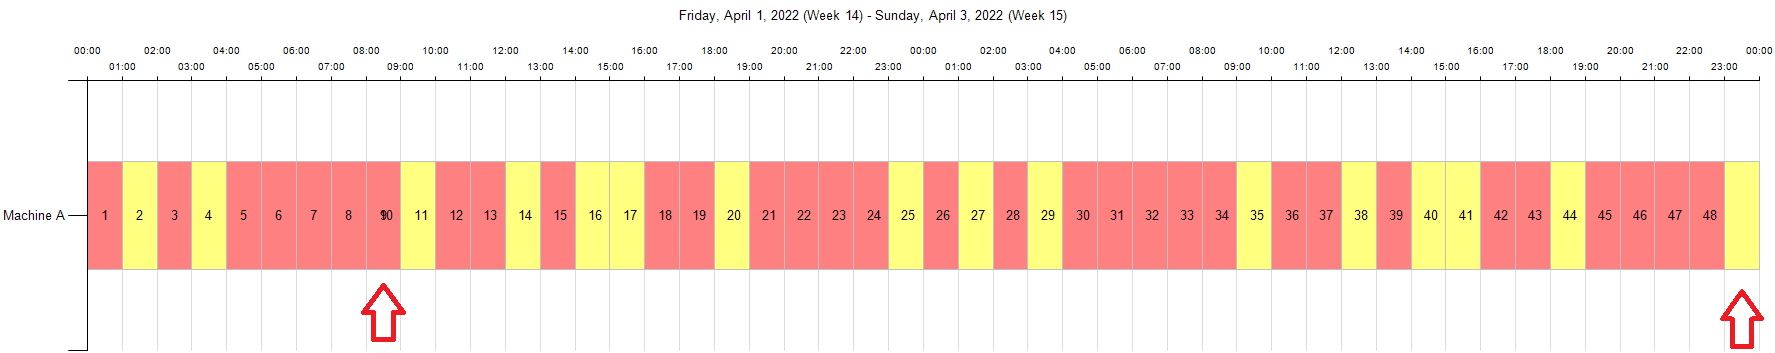
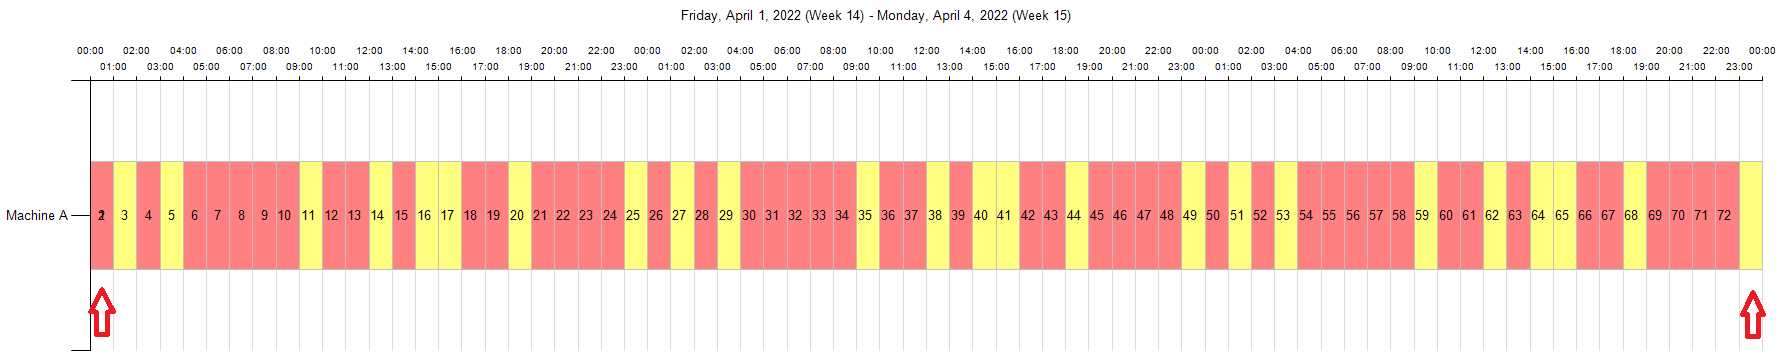
So, what's wrong with the report? There is a report parameter that allows the user to select the amount of data he wishes to see. You can choose between 1, 2 or 3 days of data. If you choose only one day, everything is correct. However, when you choose 2 or 3 days, then the report starts showing the labels incorrectly. The labels are being shifted, and because of this some labels overlap, others are being placed on top of the wrong bar, and others are being left empty.
So, in other words, the amount of data seems to cause the bar chart to render incorrectly, even though the data itself should be correct. You can check the data if you run the query in the dataset. I added some screenshots in the attachments, which also show this. Perhaps stranger even is that on my colleague's system, the reports show differently, even though the data is hard-coded.
Does anyone know what we can do about this? Any help is appreciated!
Kind regards,
Stefan Adriaenssen
<?xml version="1.0" encoding="utf-8"?>
<Report xmlns="http://schemas.microsoft.com/sqlserver/reporting/2016/01/reportdefinition" xmlns:rd="http://schemas.microsoft.com/SQLServer/reporting/reportdesigner">
<AutoRefresh>0</AutoRefresh>
<DataSources>
<DataSource Name="Dummy">
<ConnectionProperties>
<DataProvider>SQL</DataProvider>
<ConnectString>Integrated Security=True,Initial Catalog=master</ConnectString>
<IntegratedSecurity>true</IntegratedSecurity>
</ConnectionProperties>
<rd:SecurityType>Integrated</rd:SecurityType>
<rd:DataSourceID>76e7bd00-e08e-4775-ad8f-4fcf73924647</rd:DataSourceID>
</DataSource>
</DataSources>
<DataSets>
<DataSet Name="ChartData">
<Query>
<DataSourceName>Dummy</DataSourceName>
<QueryParameters>
<QueryParameter Name="@Duration">
<Value>=Parameters!Duration.Value</Value>
<rd:UserDefined>true</rd:UserDefined>
</QueryParameter>
</QueryParameters>
<CommandText>DECLARE @Temp TABLE
(
[From] DATETIME,
[Till] DATETIME,
[GroupID] NVARCHAR(MAX),
[WithinRange] BIT,
[AmountOfBatches] INT
)
--DECLARE @Duration INT = 3
INSERT INTO @Temp
SELECT '2022-04-01 00:00:00.000','2022-04-01 01:00:00.000','Machine A',-1, 1
UNION ALL SELECT '2022-04-01 01:00:00.000', '2022-04-01 02:00:00.000','Machine A', 0, 2
UNION ALL SELECT '2022-04-01 02:00:00.000', '2022-04-01 03:00:00.000','Machine A', 1, 3
UNION ALL SELECT '2022-04-01 03:00:00.000', '2022-04-01 04:00:00.000','Machine A', 0, 4
UNION ALL SELECT '2022-04-01 04:00:00.000', '2022-04-01 05:00:00.000','Machine A', 1, 5
UNION ALL SELECT '2022-04-01 05:00:00.000', '2022-04-01 06:00:00.000','Machine A', 1, 6
UNION ALL SELECT '2022-04-01 06:00:00.000', '2022-04-01 07:00:00.000','Machine A', -1, 7
UNION ALL SELECT '2022-04-01 07:00:00.000', '2022-04-01 08:00:00.000','Machine A', -1, 8
UNION ALL SELECT '2022-04-01 08:00:00.000', '2022-04-01 09:00:00.000','Machine A', 1, 9
UNION ALL SELECT '2022-04-01 09:00:00.000', '2022-04-01 10:00:00.000','Machine A', 0, 10
UNION ALL SELECT '2022-04-01 10:00:00.000', '2022-04-01 11:00:00.000','Machine A', 1, 11
UNION ALL SELECT '2022-04-01 11:00:00.000', '2022-04-01 12:00:00.000','Machine A', 1, 12
UNION ALL SELECT '2022-04-01 12:00:00.000', '2022-04-01 13:00:00.000','Machine A', 0, 13
UNION ALL SELECT '2022-04-01 13:00:00.000', '2022-04-01 14:00:00.000','Machine A', 1, 14
UNION ALL SELECT '2022-04-01 14:00:00.000', '2022-04-01 15:00:00.000','Machine A', 0, 15
UNION ALL SELECT '2022-04-01 15:00:00.000', '2022-04-01 16:00:00.000','Machine A', 0, 16
UNION ALL SELECT '2022-04-01 16:00:00.000', '2022-04-01 17:00:00.000','Machine A', -1, 17
UNION ALL SELECT '2022-04-01 17:00:00.000', '2022-04-01 18:00:00.000','Machine A', 1, 18
UNION ALL SELECT '2022-04-01 18:00:00.000', '2022-04-01 19:00:00.000','Machine A', 0, 19
UNION ALL SELECT '2022-04-01 19:00:00.000', '2022-04-01 20:00:00.000','Machine A', 1, 20
UNION ALL SELECT '2022-04-01 20:00:00.000', '2022-04-01 21:00:00.000','Machine A', 1, 21
UNION ALL SELECT '2022-04-01 21:00:00.000', '2022-04-01 22:00:00.000','Machine A', 1, 22
UNION ALL SELECT '2022-04-01 22:00:00.000', '2022-04-01 23:00:00.000','Machine A', 1, 23
UNION ALL SELECT '2022-04-01 23:00:00.000', '2022-04-02 00:00:00.000','Machine A', 0, 24
IF @Duration > 1
BEGIN
INSERT INTO @Temp
SELECT '2022-04-02 00:00:00.000', '2022-04-02 01:00:00.000','Machine A', -1, 25
UNION ALL SELECT '2022-04-02 01:00:00.000', '2022-04-02 02:00:00.000','Machine A', 0, 26
UNION ALL SELECT '2022-04-02 02:00:00.000', '2022-04-02 03:00:00.000','Machine A', 1, 27
UNION ALL SELECT '2022-04-02 03:00:00.000', '2022-04-02 04:00:00.000','Machine A', 0, 28
UNION ALL SELECT '2022-04-02 04:00:00.000', '2022-04-02 05:00:00.000','Machine A', 1, 29
UNION ALL SELECT '2022-04-02 05:00:00.000', '2022-04-02 06:00:00.000','Machine A', 1, 30
UNION ALL SELECT '2022-04-02 06:00:00.000', '2022-04-02 07:00:00.000','Machine A', -1, 31
UNION ALL SELECT '2022-04-02 07:00:00.000', '2022-04-02 08:00:00.000','Machine A', -1, 32
UNION ALL SELECT '2022-04-02 08:00:00.000', '2022-04-02 09:00:00.000','Machine A', 1, 33
UNION ALL SELECT '2022-04-02 09:00:00.000', '2022-04-02 10:00:00.000','Machine A', 0, 34
UNION ALL SELECT '2022-04-02 10:00:00.000', '2022-04-02 11:00:00.000','Machine A', 1, 35
UNION ALL SELECT '2022-04-02 11:00:00.000', '2022-04-02 12:00:00.000','Machine A', 1, 36
UNION ALL SELECT '2022-04-02 12:00:00.000', '2022-04-02 13:00:00.000','Machine A', 0, 37
UNION ALL SELECT '2022-04-02 13:00:00.000', '2022-04-02 14:00:00.000','Machine A', 1, 38
UNION ALL SELECT '2022-04-02 14:00:00.000', '2022-04-02 15:00:00.000','Machine A', 0, 39
UNION ALL SELECT '2022-04-02 15:00:00.000', '2022-04-02 16:00:00.000','Machine A', 0, 40
UNION ALL SELECT '2022-04-02 16:00:00.000', '2022-04-02 17:00:00.000','Machine A', -1, 41
UNION ALL SELECT '2022-04-02 17:00:00.000', '2022-04-02 18:00:00.000','Machine A', 1, 42
UNION ALL SELECT '2022-04-02 18:00:00.000', '2022-04-02 19:00:00.000','Machine A', 0, 43
UNION ALL SELECT '2022-04-02 19:00:00.000', '2022-04-02 20:00:00.000','Machine A', 1, 44
UNION ALL SELECT '2022-04-02 20:00:00.000', '2022-04-02 21:00:00.000','Machine A', 1, 45
UNION ALL SELECT '2022-04-02 21:00:00.000', '2022-04-02 22:00:00.000','Machine A', 1, 46
UNION ALL SELECT '2022-04-02 22:00:00.000', '2022-04-02 23:00:00.000','Machine A', 1, 47
UNION ALL SELECT '2022-04-02 23:00:00.000', '2022-04-03 00:00:00.000','Machine A', 0, 48
END
IF @Duration > 2
BEGIN
INSERT INTO @Temp
SELECT '2022-04-03 00:00:00.000', '2022-04-03 01:00:00.000','Machine A', -1, 49
UNION ALL SELECT '2022-04-03 01:00:00.000', '2022-04-03 02:00:00.000','Machine A', 0, 50
UNION ALL SELECT '2022-04-03 02:00:00.000', '2022-04-03 03:00:00.000','Machine A', 1, 51
UNION ALL SELECT '2022-04-03 03:00:00.000', '2022-04-03 04:00:00.000','Machine A', 0, 52
UNION ALL SELECT '2022-04-03 04:00:00.000', '2022-04-03 05:00:00.000','Machine A', 1, 53
UNION ALL SELECT '2022-04-03 05:00:00.000', '2022-04-03 06:00:00.000','Machine A', 1, 54
UNION ALL SELECT '2022-04-03 06:00:00.000', '2022-04-03 07:00:00.000','Machine A', -1, 55
UNION ALL SELECT '2022-04-03 07:00:00.000', '2022-04-03 08:00:00.000','Machine A', -1, 56
UNION ALL SELECT '2022-04-03 08:00:00.000', '2022-04-03 09:00:00.000','Machine A', 1, 57
UNION ALL SELECT '2022-04-03 09:00:00.000', '2022-04-03 10:00:00.000','Machine A', 0, 58
UNION ALL SELECT '2022-04-03 10:00:00.000', '2022-04-03 11:00:00.000','Machine A', 1, 59
UNION ALL SELECT '2022-04-03 11:00:00.000', '2022-04-03 12:00:00.000','Machine A', 1, 60
UNION ALL SELECT '2022-04-03 12:00:00.000', '2022-04-03 13:00:00.000','Machine A', 0, 61
UNION ALL SELECT '2022-04-03 13:00:00.000', '2022-04-03 14:00:00.000','Machine A', 1, 62
UNION ALL SELECT '2022-04-03 14:00:00.000', '2022-04-03 15:00:00.000','Machine A', 0, 63
UNION ALL SELECT '2022-04-03 15:00:00.000', '2022-04-03 16:00:00.000','Machine A', 0, 64
UNION ALL SELECT '2022-04-03 16:00:00.000', '2022-04-03 17:00:00.000','Machine A', -1, 65
UNION ALL SELECT '2022-04-03 17:00:00.000', '2022-04-03 18:00:00.000','Machine A', 1, 66
UNION ALL SELECT '2022-04-03 18:00:00.000', '2022-04-03 19:00:00.000','Machine A', 0, 67
UNION ALL SELECT '2022-04-03 19:00:00.000', '2022-04-03 20:00:00.000','Machine A', 1, 68
UNION ALL SELECT '2022-04-03 20:00:00.000', '2022-04-03 21:00:00.000','Machine A', 1, 69
UNION ALL SELECT '2022-04-03 21:00:00.000', '2022-04-03 22:00:00.000','Machine A', 1, 70
UNION ALL SELECT '2022-04-03 22:00:00.000', '2022-04-03 23:00:00.000','Machine A', 1, 71
UNION ALL SELECT '2022-04-03 23:00:00.000', '2022-04-04 00:00:00.000','Machine A', 0, 72
END
SELECT * FROM @Temp</CommandText>
<rd:UseGenericDesigner>true</rd:UseGenericDesigner>
</Query>
<Fields>
<Field Name="From">
<DataField>From</DataField>
<rd:UserDefined>true</rd:UserDefined>
</Field>
<Field Name="Till">
<DataField>Till</DataField>
<rd:UserDefined>true</rd:UserDefined>
</Field>
<Field Name="GroupID">
<DataField>GroupID</DataField>
<rd:UserDefined>true</rd:UserDefined>
</Field>
<Field Name="WithinRange">
<DataField>WithinRange</DataField>
<rd:UserDefined>true</rd:UserDefined>
</Field>
<Field Name="AmountOfBatches">
<DataField>AmountOfBatches</DataField>
<rd:UserDefined>true</rd:UserDefined>
</Field>
</Fields>
</DataSet>
</DataSets>
<ReportSections>
<ReportSection>
<Body>
<ReportItems>
<Chart Name="Chart1">
<ChartCategoryHierarchy>
<ChartMembers>
<ChartMember>
<Group Name="Chart1_CategoryGroup">
<GroupExpressions>
<GroupExpression>=Fields!GroupID.Value</GroupExpression>
</GroupExpressions>
</Group>
<SortExpressions>
<SortExpression>
<Value>=Fields!GroupID.Value</Value>
</SortExpression>
</SortExpressions>
<Label>=Fields!GroupID.Value</Label>
</ChartMember>
</ChartMembers>
</ChartCategoryHierarchy>
<ChartSeriesHierarchy>
<ChartMembers>
<ChartMember>
<Group Name="Chart1_SeriesGroup" />
<SortExpressions>
<SortExpression>
<Value>=Fields!WithinRange.Value</Value>
</SortExpression>
</SortExpressions>
<Label>=Fields!WithinRange.Value</Label>
</ChartMember>
</ChartMembers>
</ChartSeriesHierarchy>
<ChartData>
<ChartSeriesCollection>
<ChartSeries Name="Till">
<ChartDataPoints>
<ChartDataPoint>
<ChartDataPointValues>
<High>=Fields!Till.Value</High>
<Low>=Fields!From.Value</Low>
</ChartDataPointValues>
<ChartDataLabel>
<Style />
<Label>=Fields!AmountOfBatches.Value</Label>
<Visible>true</Visible>
</ChartDataLabel>
<Style>
<Border>
<Color>Silver</Color>
</Border>
<Color>=
Choose(Fields!WithinRange.Value + 2, "#7FFF0000", "#7FFFFF00", "#7F008000")</Color>
</Style>
<ChartMarker>
<Style />
</ChartMarker>
<DataElementOutput>Output</DataElementOutput>
</ChartDataPoint>
</ChartDataPoints>
<Type>Range</Type>
<Subtype>Bar</Subtype>
<Style />
<ChartEmptyPoints>
<Style />
<ChartMarker>
<Style />
</ChartMarker>
<ChartDataLabel>
<Style />
</ChartDataLabel>
</ChartEmptyPoints>
<CustomProperties>
<CustomProperty>
<Name>DrawSideBySide</Name>
<Value>False</Value>
</CustomProperty>
</CustomProperties>
<ValueAxisName>Primary</ValueAxisName>
<CategoryAxisName>Primary</CategoryAxisName>
<ChartSmartLabel>
<CalloutLineColor>Black</CalloutLineColor>
<MinMovingDistance>0pt</MinMovingDistance>
</ChartSmartLabel>
</ChartSeries>
</ChartSeriesCollection>
</ChartData>
<ChartAreas>
<ChartArea Name="Default">
<ChartCategoryAxes>
<ChartAxis Name="Primary">
<Style>
<FontSize>8pt</FontSize>
</Style>
<ChartAxisTitle>
<Caption />
<Style>
<FontSize>8pt</FontSize>
</Style>
</ChartAxisTitle>
<Interval>1</Interval>
<ChartMajorGridLines>
<Enabled>False</Enabled>
<Style>
<Border>
<Color>Gainsboro</Color>
</Border>
</Style>
</ChartMajorGridLines>
<ChartMinorGridLines>
<Style>
<Border>
<Color>Gainsboro</Color>
<Style>Dotted</Style>
</Border>
</Style>
</ChartMinorGridLines>
<ChartMinorTickMarks>
<Length>0.5</Length>
</ChartMinorTickMarks>
<Reverse>true</Reverse>
<CrossAt>NaN</CrossAt>
<Minimum>NaN</Minimum>
<Maximum>NaN</Maximum>
<ChartAxisScaleBreak>
<Style />
</ChartAxisScaleBreak>
</ChartAxis>
<ChartAxis Name="Secondary">
<Style>
<FontSize>8pt</FontSize>
</Style>
<ChartAxisTitle>
<Caption>Axis Title</Caption>
<Style>
<FontSize>8pt</FontSize>
</Style>
</ChartAxisTitle>
<ChartMajorGridLines>
<Enabled>False</Enabled>
<Style>
<Border>
<Color>Gainsboro</Color>
</Border>
</Style>
</ChartMajorGridLines>
<ChartMinorGridLines>
<Style>
<Border>
<Color>Gainsboro</Color>
<Style>Dotted</Style>
</Border>
</Style>
</ChartMinorGridLines>
<ChartMinorTickMarks>
<Length>0.5</Length>
</ChartMinorTickMarks>
<CrossAt>NaN</CrossAt>
<Location>Opposite</Location>
<Minimum>NaN</Minimum>
<Maximum>NaN</Maximum>
<ChartAxisScaleBreak>
<Style />
</ChartAxisScaleBreak>
</ChartAxis>
</ChartCategoryAxes>
<ChartValueAxes>
<ChartAxis Name="Primary">
<Style>
<FontSize>8pt</FontSize>
<Format>HH:mm</Format>
</Style>
<ChartAxisTitle>
<Caption />
<Style>
<FontSize>8pt</FontSize>
</Style>
</ChartAxisTitle>
<Interval>1</Interval>
<IntervalType>Hours</IntervalType>
<ChartMajorGridLines>
<Style>
<Border>
<Color>Gainsboro</Color>
</Border>
</Style>
</ChartMajorGridLines>
<ChartMinorGridLines>
<Enabled>False</Enabled>
<Style>
<Border>
<Color>Gainsboro</Color>
<Style>Dotted</Style>
</Border>
</Style>
</ChartMinorGridLines>
<ChartMinorTickMarks>
<Length>0.5</Length>
</ChartMinorTickMarks>
<CrossAt>NaN</CrossAt>
<Minimum>=Min(Fields!From.Value)</Minimum>
<Maximum>=Max(Fields!Till.Value)</Maximum>
<ChartAxisScaleBreak>
<Style />
</ChartAxisScaleBreak>
</ChartAxis>
<ChartAxis Name="Secondary">
<Style>
<FontSize>8pt</FontSize>
</Style>
<ChartAxisTitle>
<Caption>Axis Title</Caption>
<Style>
<FontSize>8pt</FontSize>
</Style>
</ChartAxisTitle>
<ChartMajorGridLines>
<Style>
<Border>
<Color>Gainsboro</Color>
</Border>
</Style>
</ChartMajorGridLines>
<ChartMinorGridLines>
<Style>
<Border>
<Color>Gainsboro</Color>
<Style>Dotted</Style>
</Border>
</Style>
</ChartMinorGridLines>
<ChartMinorTickMarks>
<Length>0.5</Length>
</ChartMinorTickMarks>
<CrossAt>NaN</CrossAt>
<Location>Opposite</Location>
<Minimum>NaN</Minimum>
<Maximum>NaN</Maximum>
<ChartAxisScaleBreak>
<Style />
</ChartAxisScaleBreak>
</ChartAxis>
</ChartValueAxes>
<Style>
<BackgroundGradientType>None</BackgroundGradientType>
</Style>
</ChartArea>
</ChartAreas>
<ChartTitles>
<ChartTitle Name="Title1">
<Caption>=Iif(Min(Fields!Till.Value) = Max(Fields!Till.Value)
, Code.FormatDateTime(Min(Fields!Till.Value), 1033)
, Code.FormatDateTime(Min(Fields!Till.Value), 1033) + " - " + Code.FormatDateTime(Max(Fields!Till.Value), 1033))</Caption>
<Style>
<BackgroundGradientType>None</BackgroundGradientType>
<TextAlign>General</TextAlign>
<VerticalAlign>Top</VerticalAlign>
</Style>
<DockOutsideChartArea>true</DockOutsideChartArea>
</ChartTitle>
</ChartTitles>
<Palette>Custom</Palette>
<PaletteHatchBehavior>None</PaletteHatchBehavior>
<ChartBorderSkin>
<Style>
<BackgroundColor>Gray</BackgroundColor>
<BackgroundGradientType>None</BackgroundGradientType>
<Color>White</Color>
</Style>
</ChartBorderSkin>
<ChartNoDataMessage Name="NoDataMessage">
<Caption>No Data Available</Caption>
<Style>
<BackgroundGradientType>None</BackgroundGradientType>
<TextAlign>General</TextAlign>
<VerticalAlign>Top</VerticalAlign>
</Style>
</ChartNoDataMessage>
<DataSetName>ChartData</DataSetName>
<PageBreak>
<BreakLocation>End</BreakLocation>
</PageBreak>
<Top>0in</Top>
<Height>10cm</Height>
<Width>51.04375cm</Width>
<Style>
<Border>
<Color>LightGrey</Color>
<Style>Solid</Style>
</Border>
<BackgroundColor>White</BackgroundColor>
<BackgroundGradientType>None</BackgroundGradientType>
</Style>
</Chart>
</ReportItems>
<Height>10.97775cm</Height>
<Style>
<Border>
<Style>None</Style>
</Border>
</Style>
</Body>
<Width>51.14958cm</Width>
<Page>
<PageHeader>
<Height>1.1cm</Height>
<PrintOnFirstPage>true</PrintOnFirstPage>
<PrintOnLastPage>true</PrintOnLastPage>
<Style>
<Border>
<Style>None</Style>
</Border>
</Style>
</PageHeader>
<PageFooter>
<Height>0.89076cm</Height>
<PrintOnFirstPage>true</PrintOnFirstPage>
<PrintOnLastPage>true</PrintOnLastPage>
<Style>
<Border>
<Style>None</Style>
</Border>
</Style>
</PageFooter>
<PageHeight>21cm</PageHeight>
<PageWidth>29.7cm</PageWidth>
<LeftMargin>0.1cm</LeftMargin>
<RightMargin>0.1cm</RightMargin>
<TopMargin>0.1cm</TopMargin>
<BottomMargin>0.1cm</BottomMargin>
<ColumnSpacing>1.27cm</ColumnSpacing>
<Style />
</Page>
</ReportSection>
</ReportSections>
<ReportParameters>
<ReportParameter Name="Duration">
<DataType>String</DataType>
<DefaultValue>
<Values>
<Value>24</Value>
</Values>
</DefaultValue>
<Prompt>Duration</Prompt>
<ValidValues>
<ParameterValues>
<ParameterValue>
<Value>1</Value>
<Label>1 Day</Label>
</ParameterValue>
<ParameterValue>
<Value>2</Value>
<Label>2 Days</Label>
</ParameterValue>
<ParameterValue>
<Value>3</Value>
<Label>3 Days</Label>
</ParameterValue>
</ParameterValues>
</ValidValues>
</ReportParameter>
</ReportParameters>
<ReportParametersLayout>
<GridLayoutDefinition>
<NumberOfColumns>4</NumberOfColumns>
<NumberOfRows>3</NumberOfRows>
<CellDefinitions>
<CellDefinition>
<ColumnIndex>0</ColumnIndex>
<RowIndex>0</RowIndex>
<ParameterName>Duration</ParameterName>
</CellDefinition>
</CellDefinitions>
</GridLayoutDefinition>
</ReportParametersLayout>
<Language>en-US</Language>
<rd:ReportUnitType>Cm</rd:ReportUnitType>
<rd:ReportID>3cd56514-4e62-4be5-9eb0-8820c4cec463</rd:ReportID>
</Report>
' cx='32' cy='32' r='32' /%3E%3Ctext x='50%25' y='55%25' dominant-baseline='middle' text-anchor='middle' fill='%23FFF' %3EAM%3C/text%3E%3C/svg%3E)
Hi @Stefan Adriaenssen ,
Has your issue been resolved?
If you have any questions, please feel free to let me know.
If the answer is helpful, please click "Accept Answer" and upvote it.
Best regards,
Aniya
' cx='32' cy='32' r='32' /%3E%3Ctext x='50%25' y='55%25' dominant-baseline='middle' text-anchor='middle' fill='%23FFF' %3EA%3C/text%3E%3C/svg%3E)
Hi @Stefan Adriaenssen
I tried a lot of things and what worked was changing the width of the Chart. If the width value is large, the labels of 2 days and 3 days will not overlap, and if the width value is small, even the labels of 1 day will overlap.
Another way is to change the type of Chart. If you change the type to Range Column, the labels will not move.
Best Regards,
Aniya
Hello,
Thanks for your response. Actually, changing the width didn't seem to fix it for us, but changing the type of chart is an option we can discuss with our customer as it also changes the layout.
However, we also found another way to achieve a very similar result by using a tablix in combination with column groups. It does require some work but it's actually possible to make it look like a bar chart. So, you did trigger us to think outside of the box and we'll find a solution now.
Regards,
Stefan