Azure Monitoring and Analytics at Scale
Authored by Michael Thomassy and Tycen Hopkins. Edited by RoAnn Corbisier. Reviewed by Jeff Fattic.
Monitoring health and usage information is a critical maintenance task for any site or application. Azure provides several tools to help you track and interpret events generated by your solutions, but as traffic and workload scales up to very high levels these tools can run into limits.
This article describes how to implement monitoring, logging, diagnostics, and analytics for Azure applications capable of generating events at rates of tens of thousands per second or higher. It does this by illustrating how to build a custom telemetry pipeline for logging and diagnostic events using Microsoft’s logging extensions and the Application Insights SDK.
Prerequisites
Before reading further in this document, make sure you're familiar with the general topic of monitoring, diagnostics, and analytics for Azure applications:
Overview—Dealing with scale
Telemetry, in the context of this article, refers to the process of generating and communicating events such as application status, diagnostic logs, health, or other usage information to a data store for later analysis. Application Insights is the primary monitoring and analytics service used on the Azure platform for processing application telemetry data.
The Applications Insights core telemetry API is capable of handling direct ingestion rates upwards of tens of thousands of events per second. See the current Azure limits for Application Insights. This capacity can be optimized through the use of application side sampling and aggregation to lower the overall number of requests to the API. However, for applications generating events at the rate of tens to hundreds of thousands of events per seconds, or higher, the number of individual events processed can overwhelm both the application generating the events, and the analytics service receiving them.
To achieve this scale, custom telemetry pipelines need to be built to handle the number of logged events. These custom pipelines buffer events in application memory and send them asynchronously in batches, either due to a buffer being full or based on a timer. A custom telemetry pipeline generates events that can target one or more external monitoring and analytics systems including Application Insights Analytics, Elastic Search/Kibana, Graphite/Grafana, or even external pipelines such as Event Hubs.
This article discusses three solutions for addressing how to send, process, ingest, and query large volumes of telemetry events. These solutions may be used independently or together in a coordinated fashion:
- Aggregation of Event Metrics represents event data logged over a specific time span. Examples include logs of resource utilization or number of errors over a time span. Event metrics represent a large number of individual events and are stored as aggregated, statistical data.
- Sampling Events processes only a select percentage of generated events. Common methods used for sampling are adaptive, fixed-rate, and ingestion.
- Batching Events occurs as events are generated by the application. The events are buffered in memory, processed, and sent in batch to the telemetry API service. Sending a batch of events can drastically reduce the number of round trip requests to the telemetry API service. The assumption with batching is that the telemetry service has a batching API enabling this optimized ingestion of telemetry events.
An ideal functional telemetry system requires storing and processing data, enabling it to query and analyze the data within a matter of minutes. As the size and complexity of an application grows, the resources needed to ingest, process, and store event data needs to scale out as well.
Handling the flow of telemetry events
In large scale scenarios, even a modest level of telemetry monitoring can easily generate far more monitoring events than a typical telemetry system can handle. To extend this capability, you need to understand how events flow from application to analysis, and how you can modify this flow to better optimize your telemetry system.

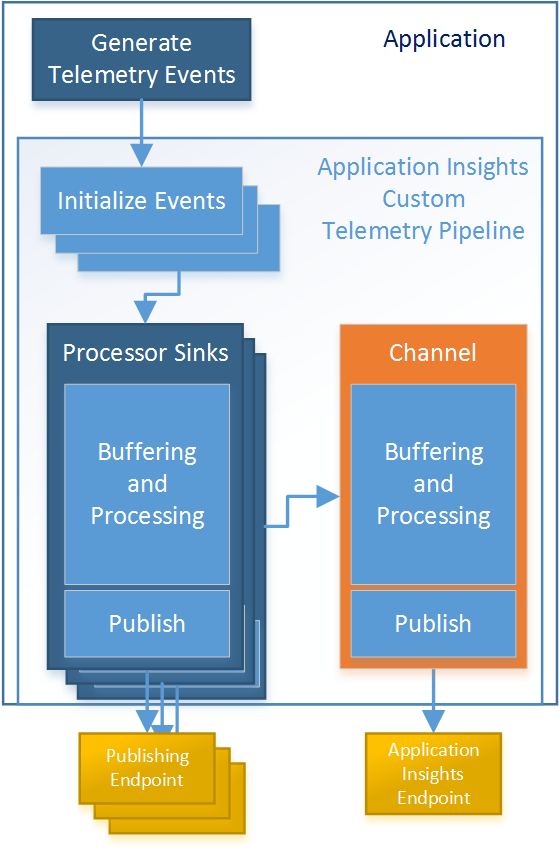
Figure 1. Overview of a telemetry pipeline extended from the Application Insights SDK.
As shown in the figure, events are initialized and enriched, then sent to one or more custom processing sinks which filter, buffer, process, and publish event data to custom publishing endpoints to be consumed by analytical services. Once passed through the custom sinks, the event is then passed to the default Application Insights sink.
Generate Logging events
The first piece of telemetry flow is the logging mechanism. Applications typically log telemetry events through a common interface to generate diagnostic event objects and post them for processing.
Events are classified as one of the following types:
- Information
- Warning
- Errors
- Exceptions
- Latency
- Requests
- Other custom logging event types
When an event is logged, an event object is created and populated with common and custom properties containing all of the event details and other information you want to include as telemetry data. Once this is complete, the event object is posted to the Telemetry pipeline for processing.
Telemetry pipeline
A custom telemetry pipeline extends the default telemetry monitoring behavior. This pipeline adds any necessary information to the event before submitting it to a chain of one or more processing sinks. These sinks prepare the event data for a final output destination, buffers the data, and then submits the data to a telemetry ingestion service. This processing can be broken down into three major components:
- Initialize events/enrichment. Once events make it into the pipeline, additional information can be added to them before further processing. This enrichment step populates any custom properties and then submits the event to the processing sink chain.
- Processing sinks. A telemetry pipeline contains one or more processing sinks that are chained together so that an event will be processed by each of the sinks in turn. Using the properties defined in the logging and enrichment steps, each sink determines if it should process the event or ignore it. If it does decide to process the event, it will buffer the event object in memory for later processing by the sink. In-memory buffering is a key aspect of this process that enables optimizations like parallel processing, aggregation, and batch publishing. It is critical to limiting the large number of individual calls to analytics services that can be overwhelming. Once the event has either been buffered or ignored by a sink, it's then passed on to the next sink in the processing chain.
- Processing events. Once a sink's buffer is either full or a timer is triggered to flush the events from memory, the sink processes stored events. This processing is handled in batches, with events grouped along common types (such as events, warnings, and so on). Each type of event data is transformed into the correct schema expected by the destination service. Once this processing is complete, the transformed event data is sent to the destination service for ingestion.
Query and Visualization
Each sink sends processed data to a specific destination service. Once the data is ingested, the service then provides a means to query and visualize the data.
Application Insights pipeline customization
To provide an example of how to build a custom telemetry pipeline, we've created a sample code project that will create a full custom pipeline that extends the standard Applications Insights SDK.
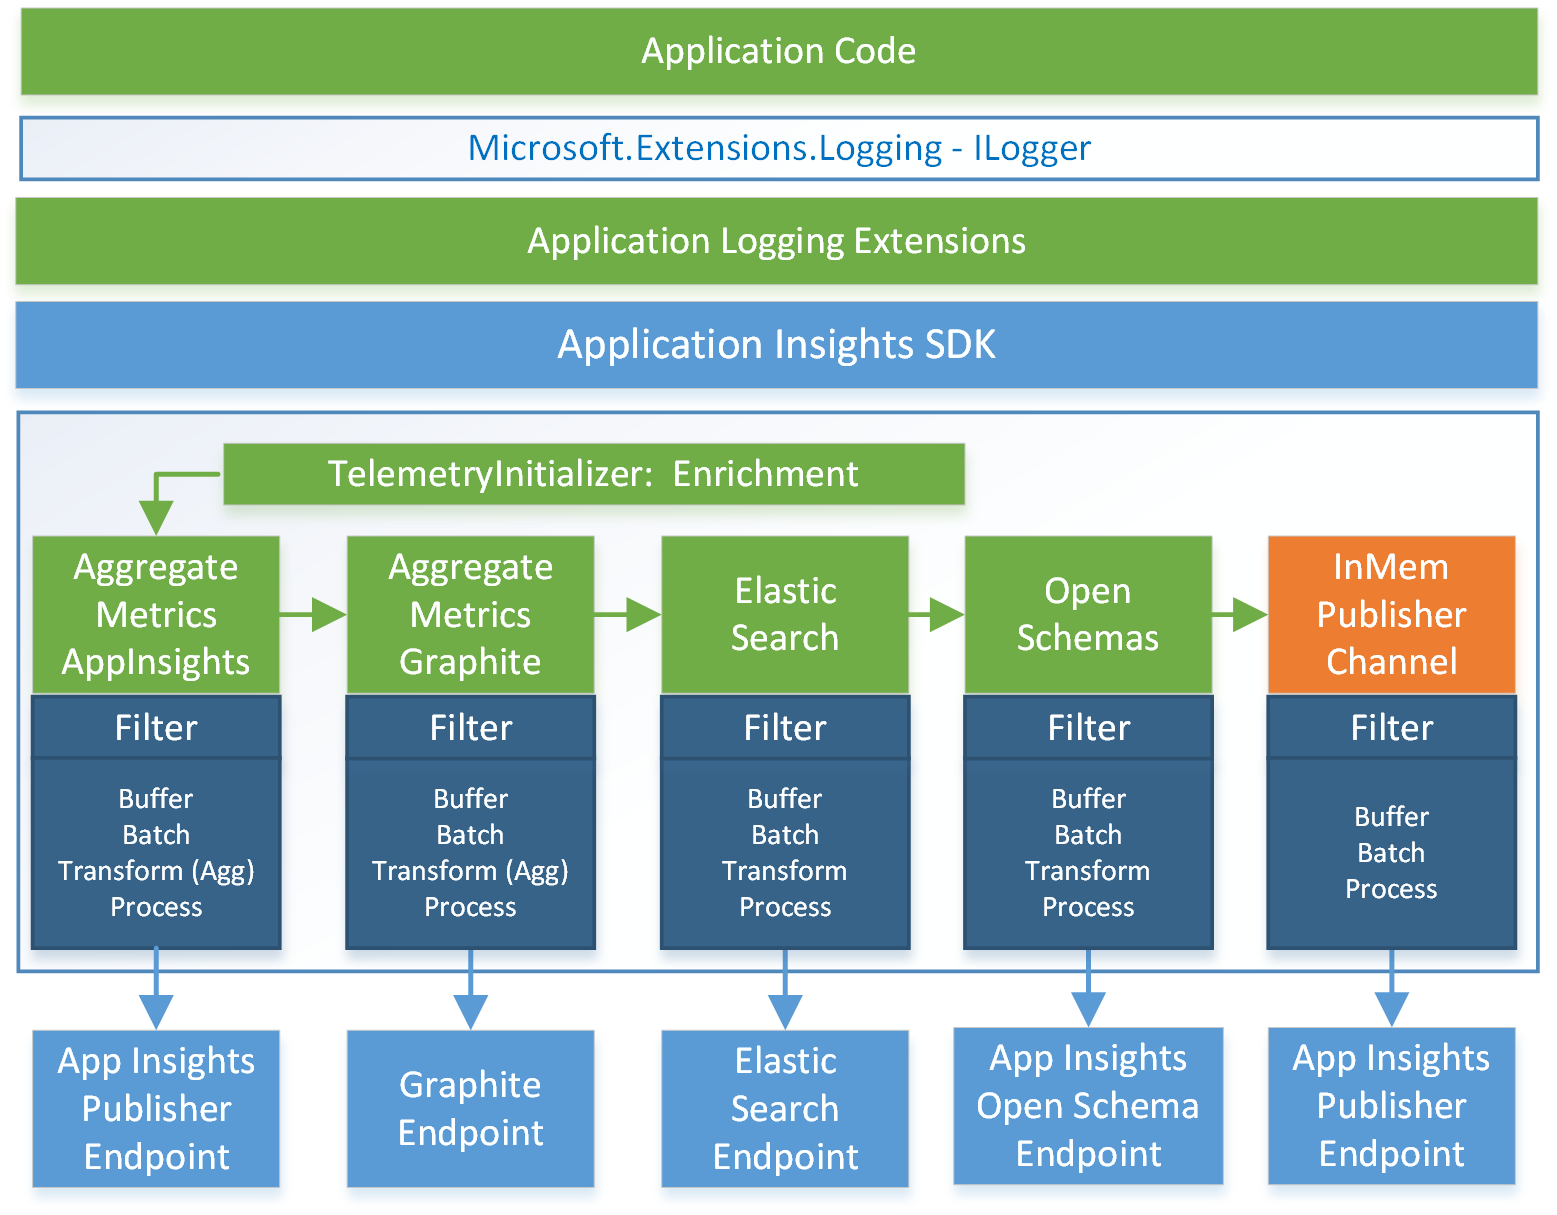
Using the Microsoft logging extensions to provide the base logging functionality, we added additional custom logging extensions to populate our event telemetry objects, and then pass them on to the custom pipeline built on top of the SDK. The pipeline first adds enrichment properties to the event object, and then passes the object to each of our telemetry sinks where the event data is buffered, processed, and then submitted to each of the target end points.
This custom pipeline adds processor sinks to support the following services:
- Application Insights (for Aggregated Metrics)
- Application Insights Open Schema (custom schemas)
- Elasticsearch
- Graphite (for Aggregated Metrics)
In addition to these sinks, we create a buffered in-memory publisher for standard Application Insights events.
The project contains a sample console application in both .NET Framework and .NET Core.

Figure 2. Logging flow
Configuration
The pipeline supports customization through a configuration file. This configuration file determines which processing sinks are made available to the application, and what their endpoint, connection, and buffering settings are.
As the application starts, the necessary dependency injection and inversion of control (IOC) containers are built.
Input into pipeline
The Microsoft.Extensions.Logging ILogger interface provides a set of standard logging methods such as LogInformation, LogWarning, or LogError. The sample code also includes custom logging extension methods like LogMetric.
ILogger is extended by the AppInsightsLogger class to call the custom IPopulateEventTelemetry method. These methods take the base logging event state data and map that data to the custom properties used by the Application Insights SDK's MetricTelemetry and EventTelemetry objects. These objects in turn will be used to send events to the custom processor sinks.
The standard Application Insights Telemetry Client API is still available if you want to submit event telemetry to the standard Application Insight endpoints. However, once the ILogger has been extended, log calls will only post EventTelemetry to the Application Insights API as part of the custom processor chain.
Build Pipeline
The LoggingManager object is called to generate new ILogger instances. When it creates a new ILogger object, it builds an Application Insights SDK telemetry processor chain to process events through the custom sinks.
To build this chain, LoggingManager starts by creating a custom ITelemetryChannel object to replace the default publishing channel provided by Application Insights. This in-memory publishing channel uses the same buffering and batch capabilities when submitting to the standard Application Insights API as the ones provided by the custom processing sinks.
Next the LoggingManager reads the configuration file to determine what functionality to create and how to configure it. With this information it does the following:
- Configures the AppInsightsLogger (the custom ILogger implementation) to call the custom IPopulateTelemetry object that will populate the EventTelemetry events and MetricTelemetry metrics used by the Application Insights API.
- Optional: Creates an instance of the ITelemetryInitializerFactory via reflection to create Application Insight ITelemetryInitializer objects. These objects will be used to enrich events with custom properties.
- Creates an instance of the ITelemetryProcessorSinkFactory via reflection to create ITelemetryProcessor. These objects are the sinks that will perform the custom event processing and publishing.
Once all the processing sinks are created they are all connected into a TelemetryProcessorChain.
Process events in the Application Insights pipeline
The custom events need to be enriched with custom properties relevant to their endpoints that will then be processed by the custom sink processors.
Enrichment is provided by custom implementations of the Application Insights ITelemetryInitializer interface. The sample provides an example implementation, EnrichmentTelemetryInitializer that attaches any custom properties specified in main configuration file.
The processor sinks are implemented using the Application Insights ITelemetryProcessor interface to enable them to plug into the Application Insights SDK pipeline.
Implementing a processor sink
Each processor sink consists of a filter, buffering and batch handling capability, a data transformation process, and a publishing capability. In discussing these components, we'll be looking specifically at the Open Schema sink that submits event data to Application Insights Open Schema for ingestion, but the other sinks in the sample code are structured in a similar way.
The AppInsightBlobSink class inherits functionality from both the ITelemetryProcessor class, which provides filtering capability from the Application Insights SDK, and from the BlobContainerSink class, which provides the buffering, batch handling, and publishing for the sink.
Filtering
When an event is passed to the sink, the AppInsightBlobSink Process method is called. This method in turn calls ProcessEntry method, where the Filter method is called to determine if the event has the Open Schema property set. If so, the event is further processed by the sink. Otherwise it is ignored.
In either case the Process method passes the event on to the next sink in the chain.
Buffering and batch processing
The BlobContainerSink class inherits the BatchingPublisherTransform class. This class stores events buffered in memory that are processed in a batch when triggered by either a maximum number of events reached in the buffer or after a specified amount of time.
When this buffer triggers, the Transform method is called to convert the batched event data into a format consumable by Open Schema.
Publishing
Once the event data has been processed, the AppInsightBlobSink Publish method is called, which serializes each event item in the batch to the WriteToBlobBuffer function, which in turn submits the batched events to WriteMemoryBuffer where it is compressed and written out to an Azure blob for ingestion into the Open Schema system. The use of compression is optional and uses the built-in gzip functionality provided by .NET. Once the blob is written, Application Insights Analytics is notified to import the blob.
End of pipeline
When we're done processing the custom sinks, we still want to submit any events that aren't one of the custom event types to Application Insights. However, we still want to take advantage of the batched processing we've put in place for the custom sink.
To do this we make use of the InMemoryPublishingChannel that replaces the default telemetry channel used by Application Insights SDK. The InMemoryPublisherChannel makes use of TPL Dataflow pipeline objects to provide buffering and batch output capabilities similar to the custom sinks. Events processed by this object are submitted to the standard Application Insights endpoint in batches.
Query & Visualization
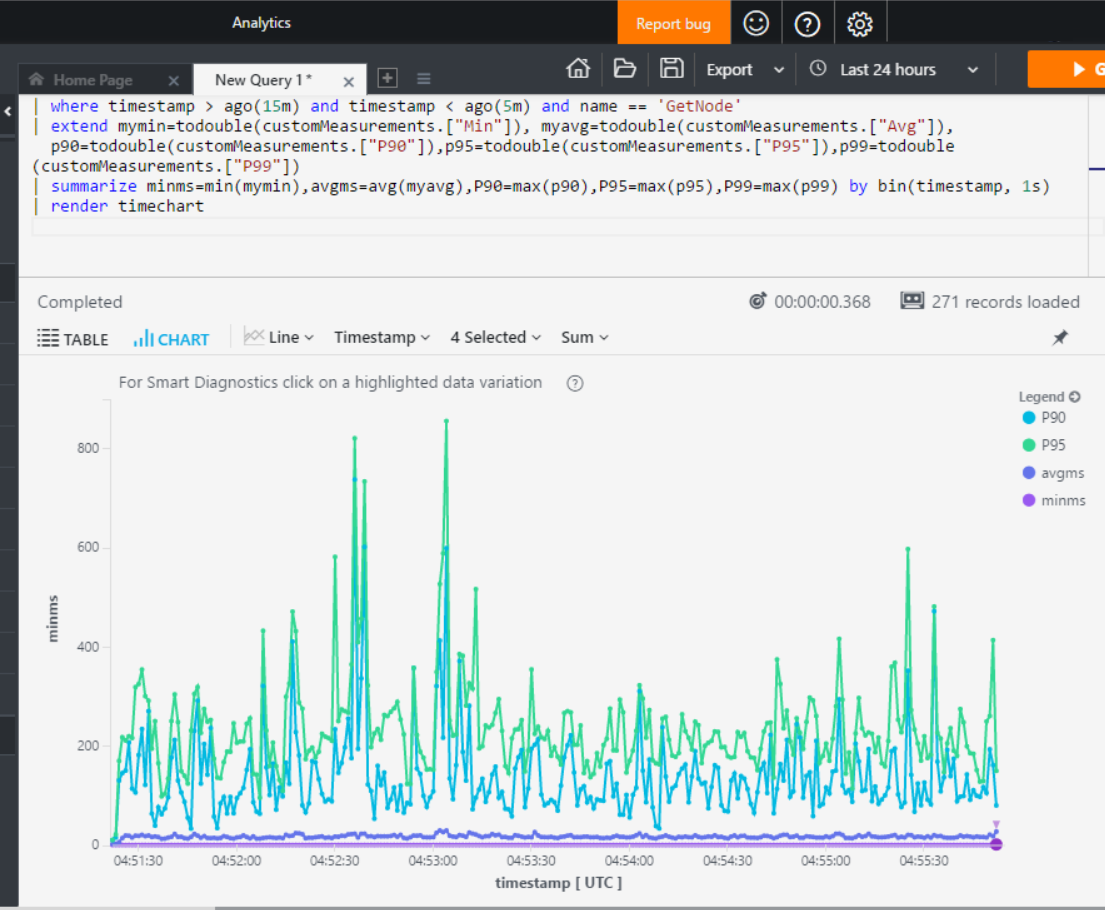
Once event telemetry is published from our pipeline to the target service ingestion endpoints, you will be able to query and analyze your event data. In the case of Open Schema events, you can use the same Application Insights Analytics engine to query and visualize your data that you use with the default Application Insights SDK.

Figure 3. Visualization Example
Summary
Implementing monitoring and analytics at large scale presents a number of challenges for applications and services in Azure. By leveraging a standard, extensible logging interface with Microsoft logging extension’s ILogger, many options are available for publishing events. These events can be published through the Application Insights SDK which provides a pluggable pipeline for any type of logging event. The logging types can target not just Application Insights but other third party endpoints such as Elasticsearch and Graphite.
To achieve diagnostic logging of hundreds of thousands of events per second, Application Insights Client SDK can be extended to leverage scaling techniques using metrics aggregation, sampling and batching of events. The Application Insights service in Azure provides two endpoints to facilitate large scale ingestion of events: the standard interface and the custom Open Schema interface. Both ingestion endpoints submit all events to a single query engine for indexing and analytics. The Azure portal for Application Insights provides a powerful analytics experience with a robust query language to create tables and charts of data ingested through either interface.
Next Steps
- View the sample code project on GitHubGraphite.
- Application Insights Analytics with OpenSchema on the Azure Code Samples gallery
Comments
- Anonymous
May 12, 2017
Nice and detailed article!- Anonymous
May 13, 2017
We appreciate it, Sjoukje!
- Anonymous