إضافة طبقة خط إلى الخريطة في iOS SDK (إصدار أولي)
إشعار
خرائط Azure إيقاف iOS SDK
تم الآن إهمال خرائط Azure Native SDK لنظام التشغيل iOS وسيتم إيقافه في 3/31/25. لتجنب انقطاع الخدمة، قم بالترحيل إلى خرائط Azure Web SDK بحلول 3/31/25. لمزيد من المعلومات، راجع دليل ترحيل خرائط Azure iOS SDK.
يمكن استخدام طبقة الخط لعرض معالم LineString وMultiLineString كممرات أو مسارات على الخريطة. يمكن أيضًا استخدام طبقة الخط لعرض مخطط الميزتين Polygon وMultiPolygon. يتم توصيل مصدر البيانات بطبقة خط لتزويدها بالبيانات المطلوب عرضها.
تلميح
ستعرض طبقات الخطوط بشكل افتراضي إحداثيات المضلعات وكذلك الخطوط في مصدر البيانات. لتقييد الطبقة بحيث تعرض فقط ميزات هندسة LineString، اضبط خيار filter للطبقة على NSPredicate(format: "%@ == \"LineString\"", NSExpression.geometryTypeAZMVariable). إذا كنت تريد تضمين ميزات MultiLineString أيضاً، فاستخدم NSCompoundPredicate.
المتطلبات الأساسية
تأكد من إكمال الخطوات الواردة في تشغيل سريع: أنشئ تطبيق مستند iOS. يمكن إدراج كتل التعليمة البرمجية في هذه المقالة في وظيفة viewDidLoad الخاصة بـ ViewController.
إضافة طبقة خط
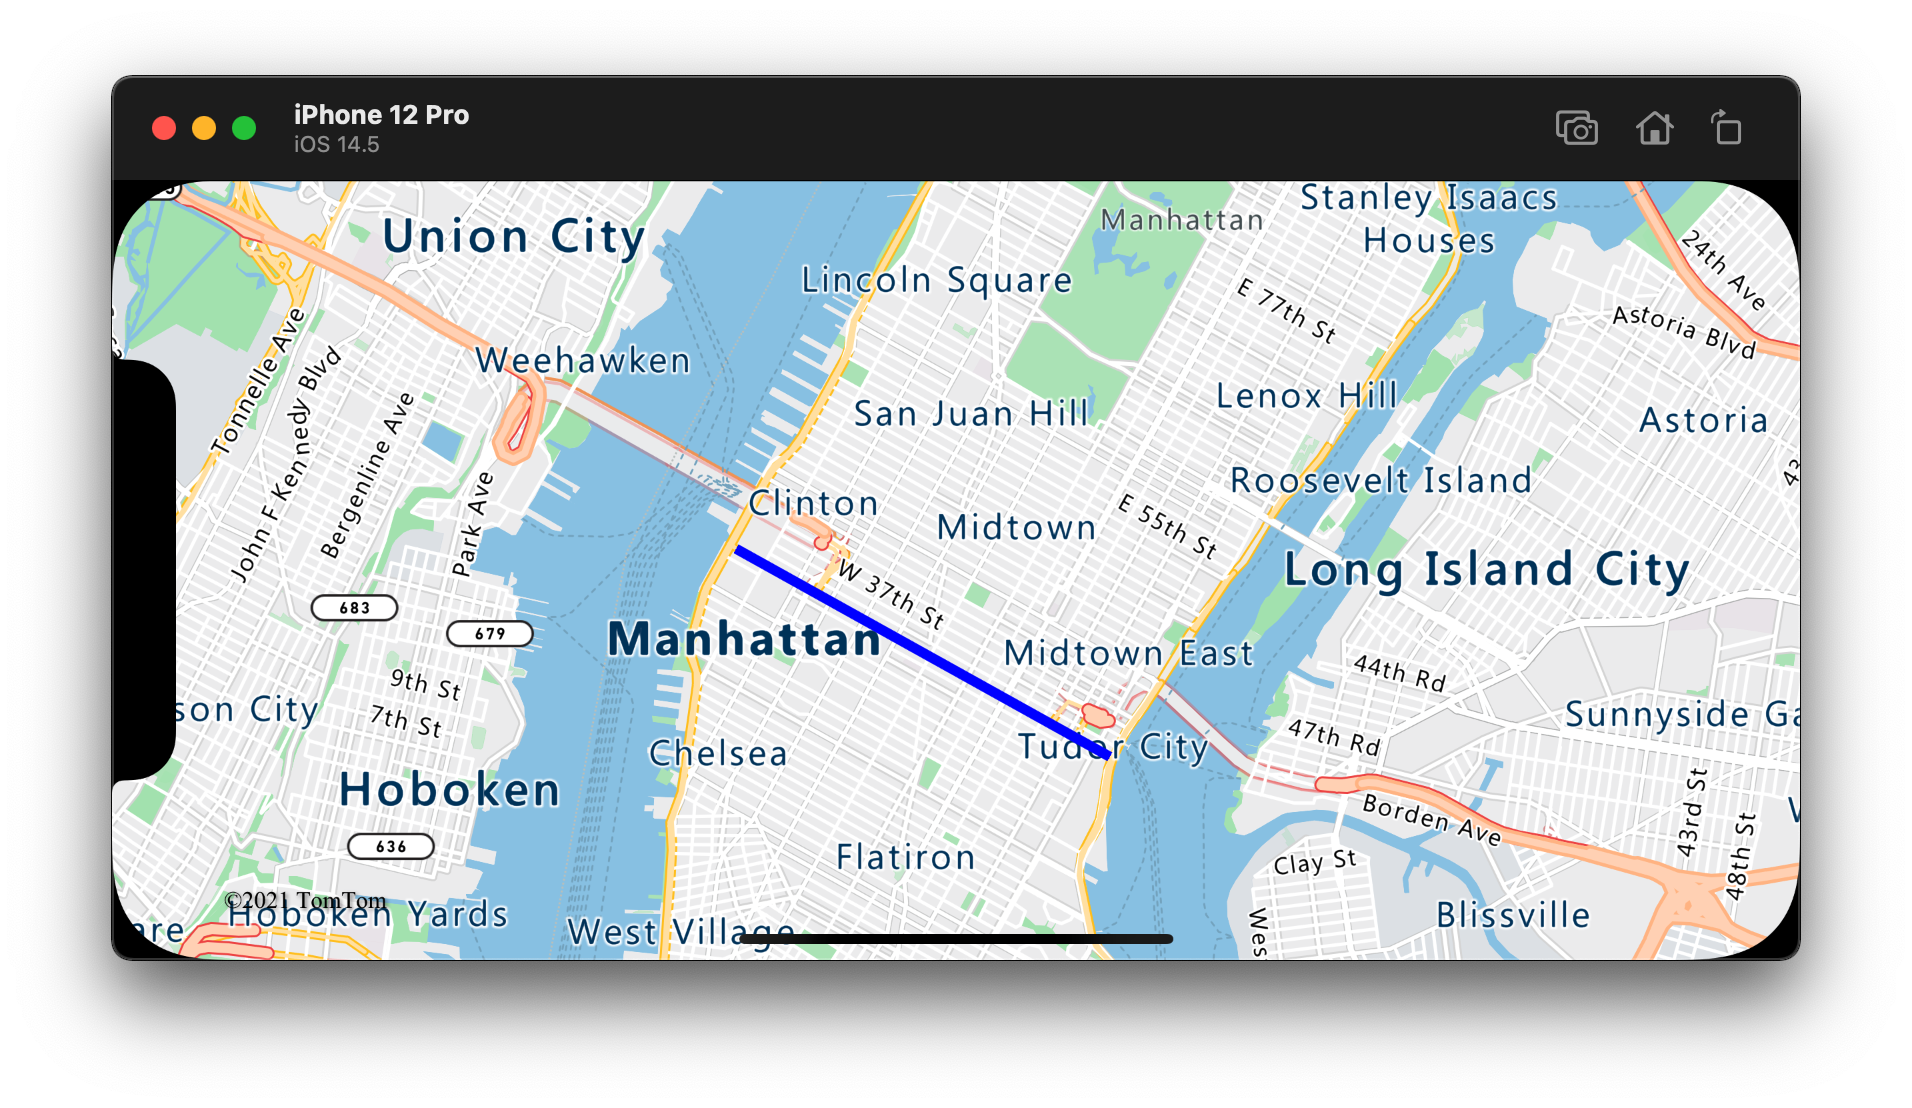
توضح التعليمة البرمجية التالية كيفية إنشاء خط. أضف الخط إلى مصدر البيانات، ثم اجعله بطبقة خط باستخدام الفئة LineLayer.
// Create a data source and add it to the map.
let source = DataSource()
map.sources.add(source)

// Create a list of points.
let points = [
    CLLocationCoordinate2D(latitude: 40.74327, longitude: -73.97234),
    CLLocationCoordinate2D(latitude: 40.75680, longitude: -74.00442)
]

// Create a Polyline geometry and add it to the data source.
source.add(geometry: Polyline(points))

// Create a line layer and add it to the map.
let layer = LineLayer(source: source, options: [
    .strokeWidth(5),
    .strokeColor(.blue)
])
map.layers.addLayer(layer)
تُظهر لقطة الشاشة التالية التعليمة البرمجية أعلاه التي تعرض خطًا في طبقة خط.
نمط الخط المعتمد على البيانات
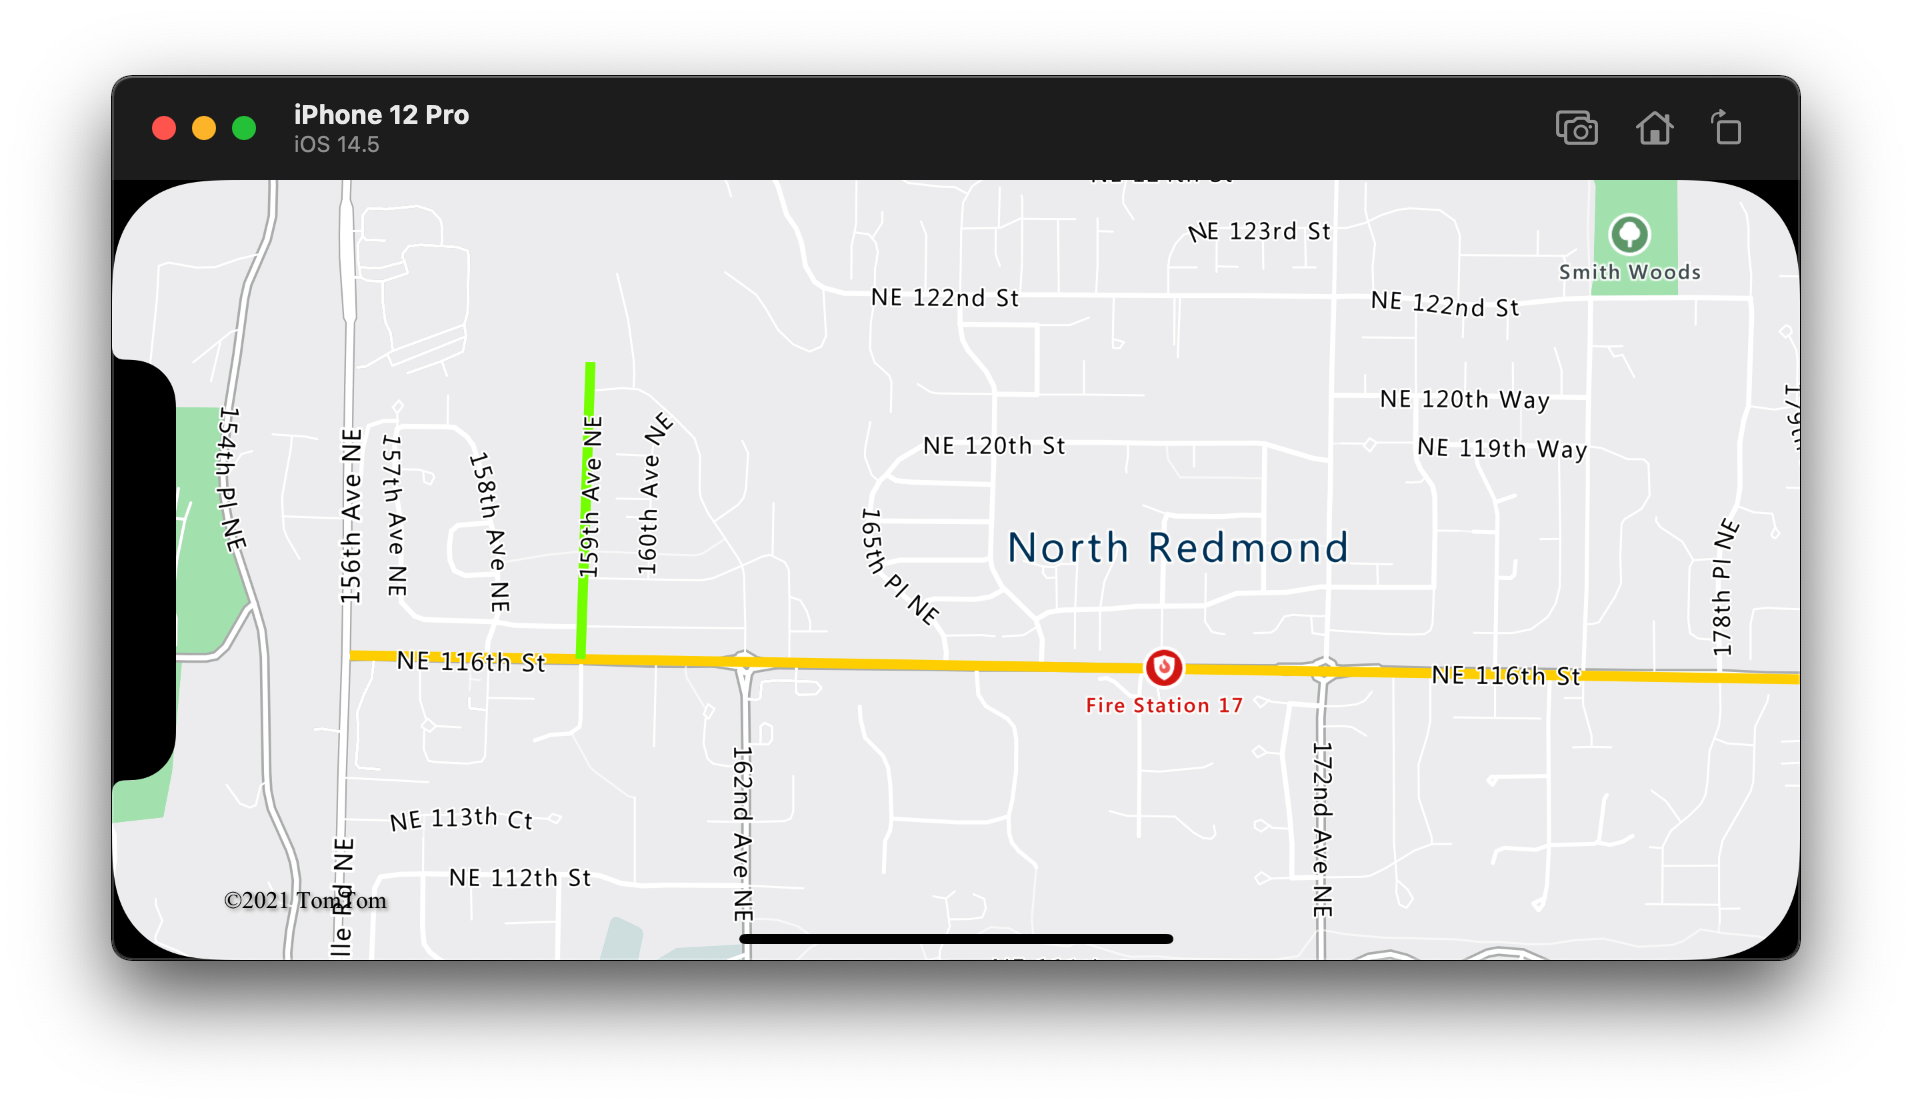
تقوم التعليمة البرمجية التالية بإنشاء ميزتي خطيتين وتضيف قيمة حد السرعة باعتبارها خاصية لكل خط. تستخدم طبقة الخط تعبير نمط محرك البيانات لتلوين الخطوط بناءً على قيمة حد السرعة. نظرا لأن بيانات الخط تراكب على طول الطرق، تضيف التعليمات البرمجية التالية طبقة الخط أسفل طبقة التسمية بحيث تظل تسميات الطرق مرئية.
// Create a data source and add it to the map.
let source = DataSource()
map.sources.add(source)

// Create a line feature.
let feature = Feature(Polyline([
    CLLocationCoordinate2D(latitude: 47.704033, longitude: -122.131821),
    CLLocationCoordinate2D(latitude: 47.703678, longitude: -122.099919)
]))

// Add a property to the feature.
feature.addProperty("speedLimitMph", value: 35)

// Add the feature to the data source.
source.add(feature: feature)

// Create a second line feature.
let feature2 = Feature(Polyline([
    CLLocationCoordinate2D(latitude: 47.708265, longitude: -122.126662),
    CLLocationCoordinate2D(latitude: 47.703980, longitude: -122.126877)
]))

// Add a property to the second feature.
feature2.addProperty("speedLimitMph", value: 15)

// Add the second feature to the data source.
source.add(feature: feature2)

// Create a line layer and add it to the map.
let stops: [Int: UIColor] = [
    0: .green,
    30: .yellow,
    60: .red
]
let colorExpression = NSExpression(
    forAZMInterpolating: NSExpression(forKeyPath: "speedLimitMph"),
    curveType: .linear,
    parameters: nil,
    stops: NSExpression(forConstantValue: stops)
)

let layer = LineLayer(source: source, options: [
    .strokeWidth(5),
    .strokeColor(from: colorExpression)
])

map.layers.insertLayer(layer, below: "labels")
تظهر لقطة الشاشة التالية التعليمات البرمجية أعلاه التي تعرض سطرين في طبقة خط مع اللون الذي تم استرداده من تعبير نمط يستند إلى البيانات استنادا إلى خاصية في ميزات السطر.
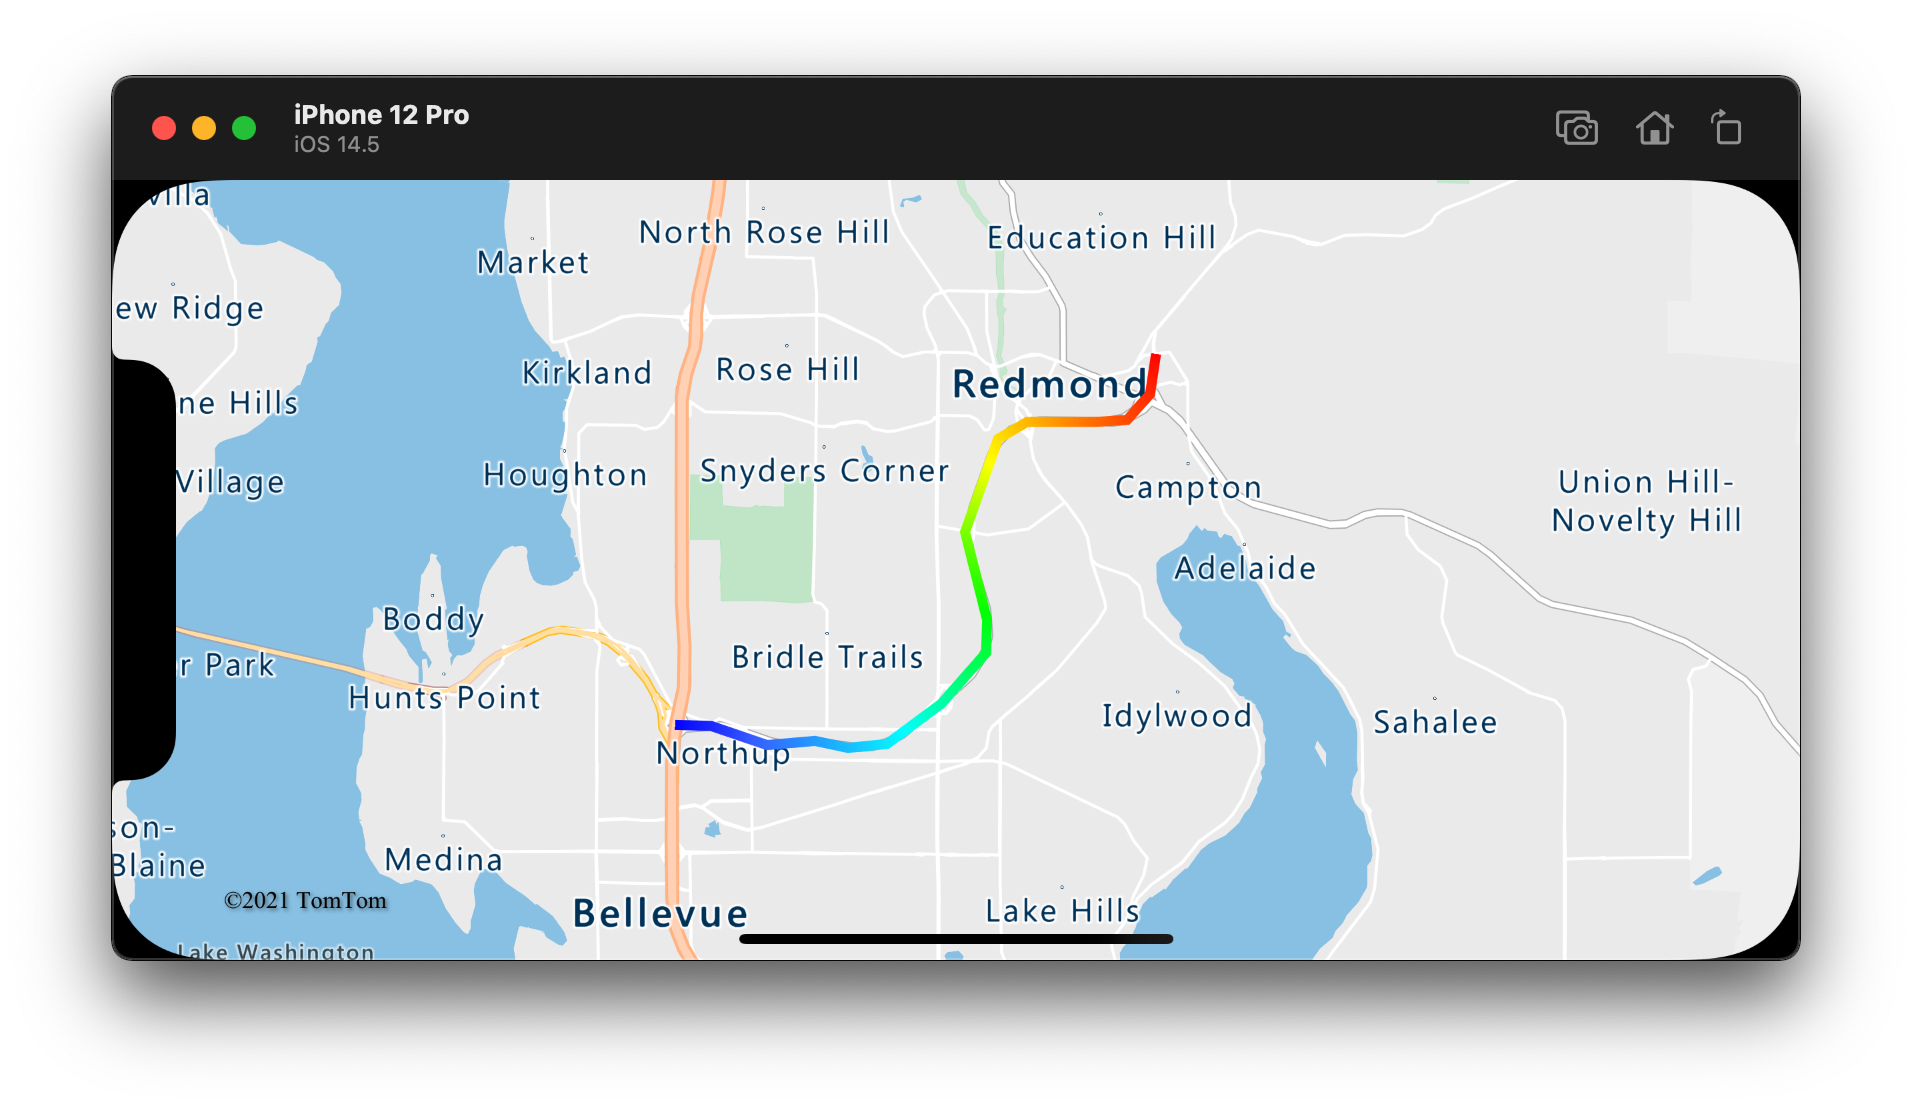
إضافة تدرج حد إلى خط
يمكنك تطبيق لون رسمة فرشاة واحدة على خط. يمكنك أيضًا ملء خط بتدرج لوني من الألوان لإظهار الانتقال من مقطع خط واحد إلى مقطع الخط التالي. على سبيل المثال، يمكن استخدام التدرجات الخطية لتمثيل التغييرات بمرور الوقت والمسافة، أو درجات حرارة مختلفة عبر خط متصل من العناصر. لتطبيق هذه الميزة على أحد الخطوط، يجب أن يكون الخيار lineMetrics لمصدر البيانات مضبوطًا true، ومن ثم يمكن تمرير تعبير التدرج اللوني إلى الخيار strokeGradient للخط. يجب أن يشير تعبير تدرج رسمة بالفرشاة إلى تعبير البيانات NSExpression.lineProgressAZMVariable الذي يعرض مقاييس الخط المحسوبة للتعبير.
// Create a data source and add it to the map.
let source = DataSource(options: [
    // Enable line metrics on the data source. This is needed to enable support for strokeGradient.
    .lineMetrics(true)
])
map.sources.add(source)

// Create a line and add it to the data source.
source.add(geometry: Polyline([
    CLLocationCoordinate2D(latitude: 47.63208, longitude: -122.18822),
    CLLocationCoordinate2D(latitude: 47.63196, longitude: -122.18204),
    CLLocationCoordinate2D(latitude: 47.62976, longitude: -122.17243),
    CLLocationCoordinate2D(latitude: 47.63023, longitude: -122.16419),
    CLLocationCoordinate2D(latitude: 47.62942, longitude: -122.15852),
    CLLocationCoordinate2D(latitude: 47.62988, longitude: -122.15183),
    CLLocationCoordinate2D(latitude: 47.63451, longitude: -122.14256),
    CLLocationCoordinate2D(latitude: 47.64041, longitude: -122.13483),
    CLLocationCoordinate2D(latitude: 47.64422, longitude: -122.13466),
    CLLocationCoordinate2D(latitude: 47.65440, longitude: -122.13844),
    CLLocationCoordinate2D(latitude: 47.66515, longitude: -122.13277),
    CLLocationCoordinate2D(latitude: 47.66712, longitude: -122.12779),
    CLLocationCoordinate2D(latitude: 47.66712, longitude: -122.11595),
    CLLocationCoordinate2D(latitude: 47.66735, longitude: -122.11063),
    CLLocationCoordinate2D(latitude: 47.67035, longitude: -122.10668),
    CLLocationCoordinate2D(latitude: 47.67498, longitude: -122.10565)
]))

// Create a line layer and add it to the map.
let stops: [Double: UIColor] = [
    0: .blue,
    0.1: UIColor(red: 0.25, green: 0.41, blue: 1, alpha: 1), // Royal Blue
    0.3: .cyan,
    0.5: UIColor(red: 0, green: 1, blue: 0, alpha: 1), // Lime
    0.7: .yellow,
    1: .red
]
let colorExpression = NSExpression(
    forAZMInterpolating: NSExpression.lineProgressAZMVariable,
    curveType: .linear,
    parameters: nil,
    stops: NSExpression(forConstantValue: stops)
)

map.layers.addLayer(LineLayer(source: source, options: [
    .strokeWidth(5),
    .strokeGradient(from: colorExpression)
]))
تُظهر لقطة الشاشة التالية التعليمة البرمجية أعلاه التي تعرض خطًا معروضًا باستخدام لون رسمة بالفرشاة متدرجة.
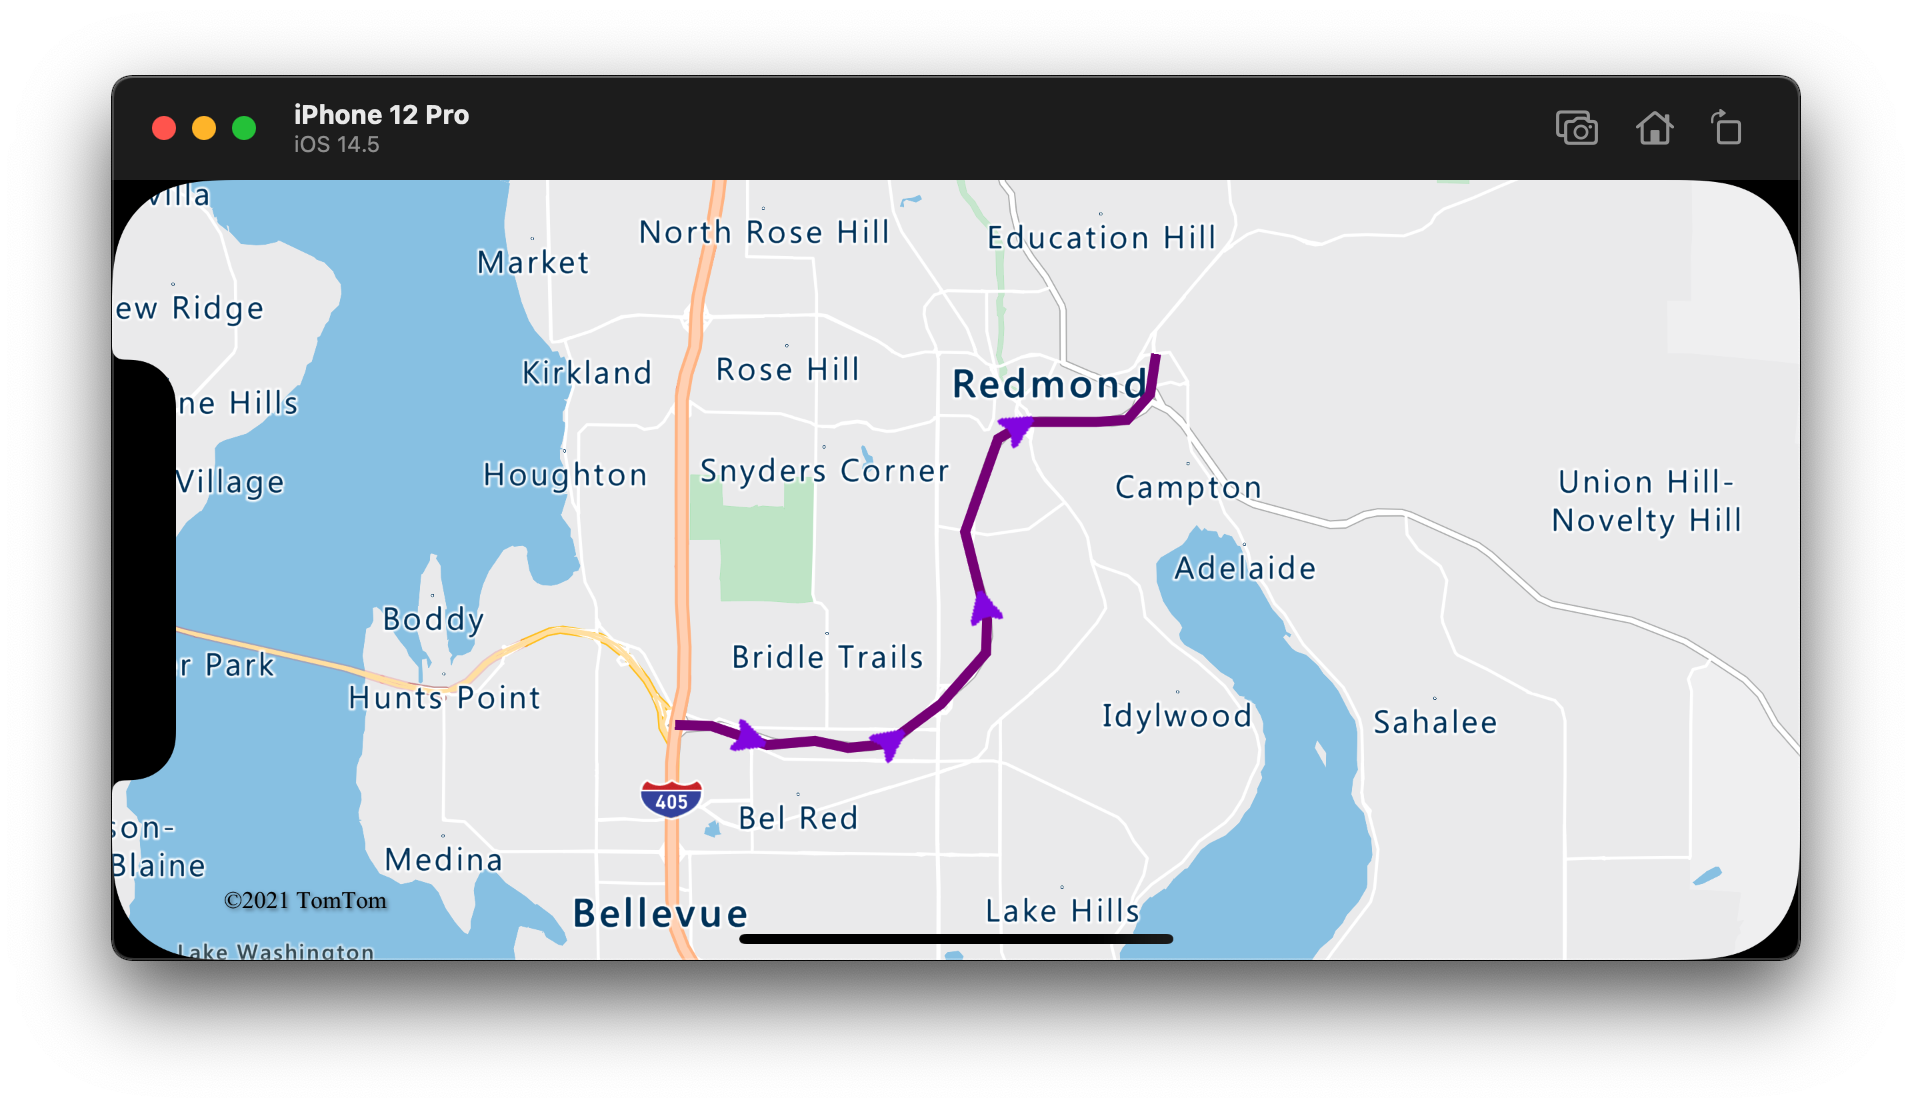
أضف الرموز على طول الخط
يوضح هذا النموذج كيفية إضافة رموز الأسهم على طول خط على الخريطة. وعند استخدام طبقة رمز، قم بتعيين الخيار symbolPlacement إلى .line. يعرض هذا الخيار الرموز على طول الخط ويدور الأيقونات (0 درجة = يمين).
// Create a data source and add it to the map.
let source = DataSource()
map.sources.add(source)

// Load a image of an arrow into the map image sprite and call it "arrow-icon".
map.images.add(UIImage(named: "purple-arrow-right")!, withID: "arrow-icon")

// Create a line and add it to the data source.
source.add(geometry: Polyline([
    CLLocationCoordinate2D(latitude: 47.63208, longitude: -122.18822),
    CLLocationCoordinate2D(latitude: 47.63196, longitude: -122.18204),
    CLLocationCoordinate2D(latitude: 47.62976, longitude: -122.17243),
    CLLocationCoordinate2D(latitude: 47.63023, longitude: -122.16419),
    CLLocationCoordinate2D(latitude: 47.62942, longitude: -122.15852),
    CLLocationCoordinate2D(latitude: 47.62988, longitude: -122.15183),
    CLLocationCoordinate2D(latitude: 47.63451, longitude: -122.14256),
    CLLocationCoordinate2D(latitude: 47.64041, longitude: -122.13483),
    CLLocationCoordinate2D(latitude: 47.64422, longitude: -122.13466),
    CLLocationCoordinate2D(latitude: 47.65440, longitude: -122.13844),
    CLLocationCoordinate2D(latitude: 47.66515, longitude: -122.13277),
    CLLocationCoordinate2D(latitude: 47.66712, longitude: -122.12779),
    CLLocationCoordinate2D(latitude: 47.66712, longitude: -122.11595),
    CLLocationCoordinate2D(latitude: 47.66735, longitude: -122.11063),
    CLLocationCoordinate2D(latitude: 47.67035, longitude: -122.10668),
    CLLocationCoordinate2D(latitude: 47.67498, longitude: -122.10565)
]))

// Create a line layer and add it to the map.
map.layers.addLayer(LineLayer(source: source, options: [
    .strokeWidth(5),
    .strokeColor(.purple)
]))

// Create a symbol layer and add it to the map.
map.layers.addLayer(SymbolLayer(source: source, options: [
    // Space symbols out along line.
    .symbolPlacement(.line),

    // Spread the symbols out 100 points apart.
    .symbolSpacing(100),

    // Use the arrow icon as the symbol.
    .iconImage("arrow-icon"),

    // Allow icons to overlap so that they aren't hidden if they collide with other map elements.
    .iconAllowOverlap(true),

    // Center the symbol icon.
    .iconAnchor(.center),

    // Scale the icon size.
    .iconSize(0.8)
]))
بالنسبة لهذه العينة، تم تحميل الصورة التالية في مجلد الأصول للتطبيق.
purple-arrow-right.png |
تظهر لقطة الشاشة التالية التعليمات البرمجية أعلاه التي تعرض سطرا مع أيقونات الأسهم المعروضة على طوله.
معلومات إضافية
راجع المقالات التالية للحصول على المزيد من نماذج التعليمات البرمجية لإضافتها إلى الخرائط الخاصة بك:
الملاحظات
قريبًا: خلال عام 2024، سنتخلص تدريجيًا من GitHub Issues بوصفها آلية إرسال ملاحظات للمحتوى ونستبدلها بنظام ملاحظات جديد. لمزيد من المعلومات، راجع https://aka.ms/ContentUserFeedback.
إرسال الملاحظات وعرضها المتعلقة بـ