إضافة طبقة إقصاء مضلع إلى الخريطة في iOS SDK (إصدار أولي)
توضح لك هذه المقالة كيفية استخدام طبقة إقصاء مضلع لعرض مناطق Polygon والميزة الهندسية MultiPolygon كأشكال مُقصاة.
إشعار
خرائط Azure إيقاف iOS SDK
تم الآن إهمال خرائط Azure Native SDK لنظام التشغيل iOS وسيتم إيقافه في 3/31/25. لتجنب انقطاع الخدمة، قم بالترحيل إلى خرائط Azure Web SDK بحلول 3/31/25. لمزيد من المعلومات، راجع دليل ترحيل خرائط Azure iOS SDK.
استخدام طبقة إقصاء مضلع
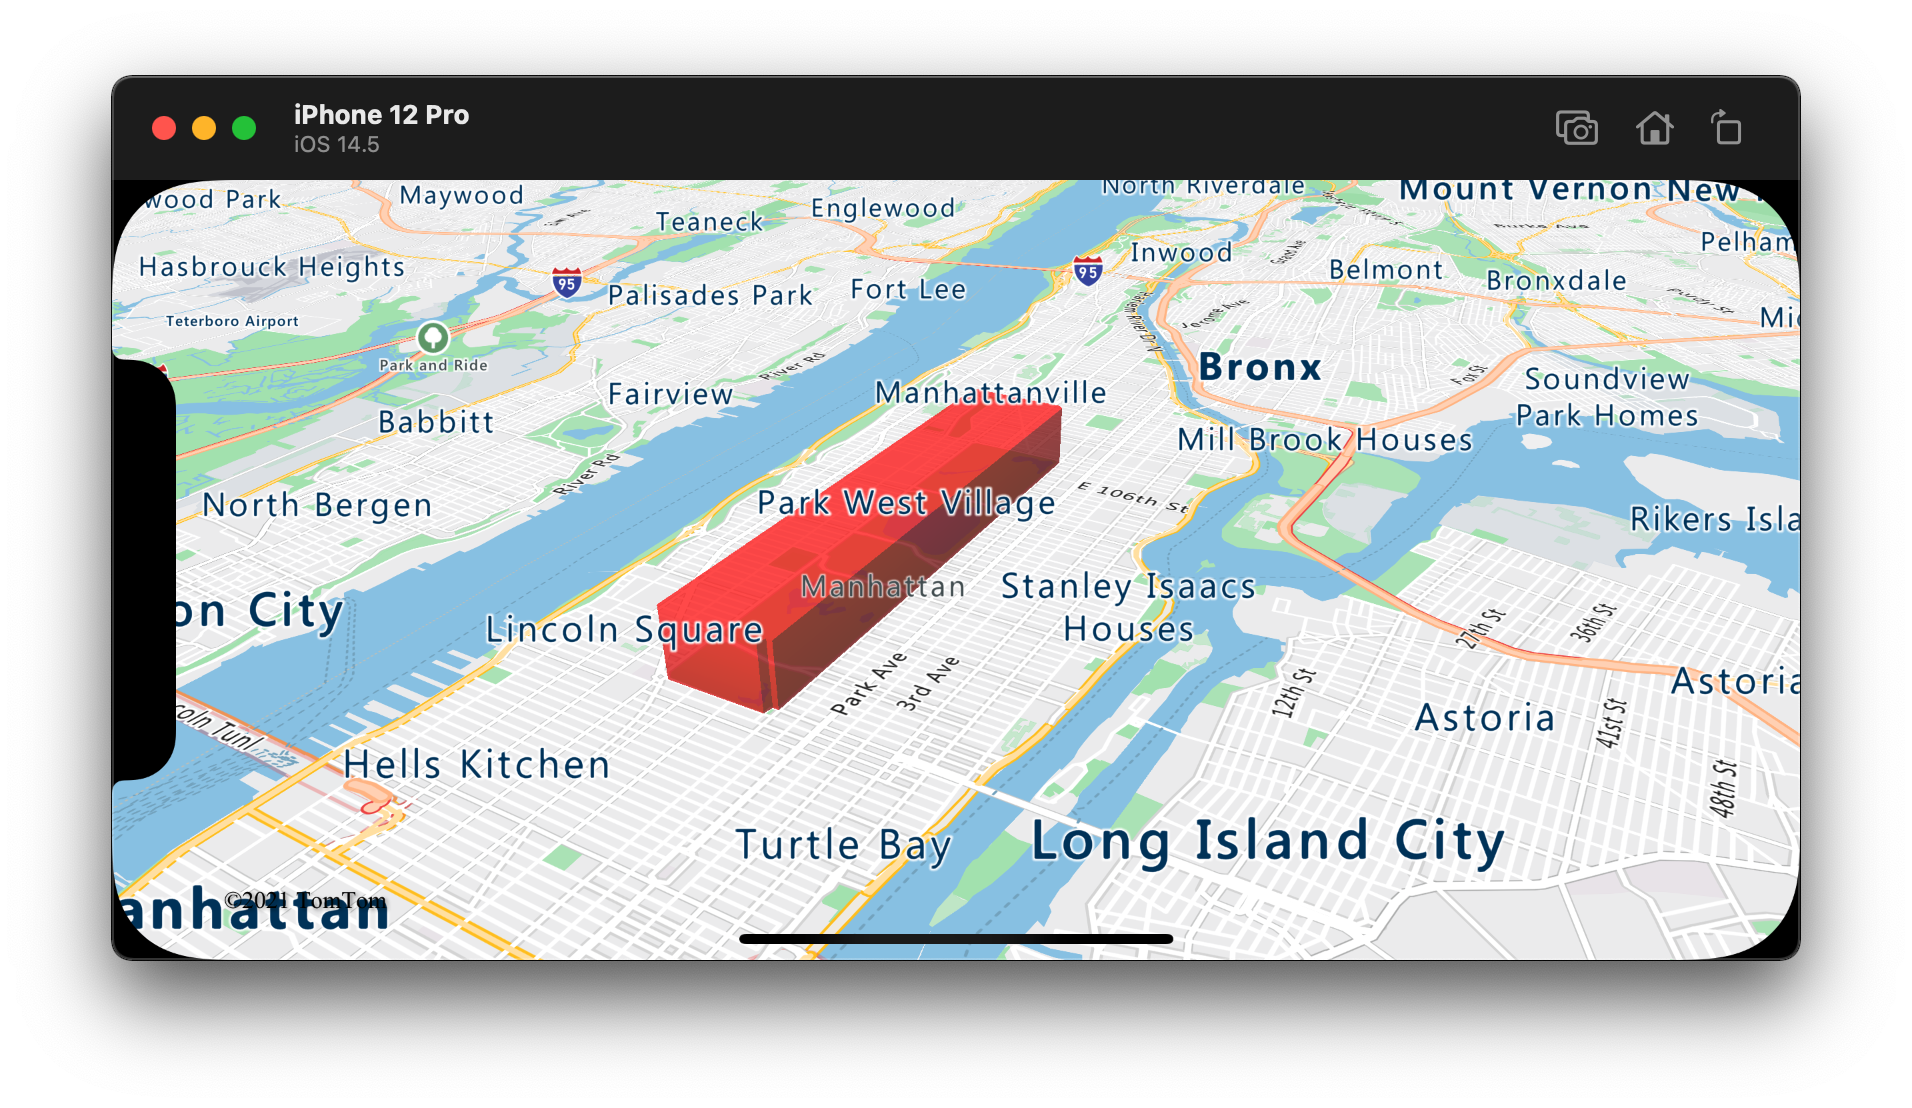
توصيل طبقة إقصاء المضلع بمصدر بيانات. ثم حمّله على الخريطة. تعرض طبقة إقصاء المضلع مناطق ميزات Polygon وMultiPolygon كأشكال مُقصاة. تحدد خصائص height وbase لطبقة إقصاء المضلع المسافة الأساسية من الأرض وارتفاع الشكل المُقصى بالأمتار. توضح التعليماتِ البرمجيةِ التالية كيفية إنشاء مضلع وإضافته إلى مصدر بيانات وعرضه باستخدام فئة طبقة المضلع.
// Create a data source and add it to the map.
let source = DataSource()
map.sources.add(source)

// Create a rectangular polygon.
source.add(geometry: Polygon([
    CLLocationCoordinate2D(latitude: 40.800279, longitude: -73.958383),
    CLLocationCoordinate2D(latitude: 40.768459, longitude: -73.981547),
    CLLocationCoordinate2D(latitude: 40.767761, longitude: -73.981246),
    CLLocationCoordinate2D(latitude: 40.764616, longitude: -73.973618),
    CLLocationCoordinate2D(latitude: 40.765128, longitude: -73.973060),
    CLLocationCoordinate2D(latitude: 40.764908, longitude: -73.972599),
    CLLocationCoordinate2D(latitude: 40.796584, longitude: -73.949446),
    CLLocationCoordinate2D(latitude: 40.797088, longitude: -73.949661),
    CLLocationCoordinate2D(latitude: 40.800523, longitude: -73.957815),
    CLLocationCoordinate2D(latitude: 40.800279, longitude: -73.958383)
]))

// Create and add a polygon extrusion layer to the map below the labels so that they are still readable.
map.layers.insertLayer(
    PolygonExtrusionLayer(source: source, options: [
        .fillColor(.red),
        .fillOpacity(0.7),
        .height(500)
    ]),
    below: "labels"
)
تُظهر لقطة الشاشة التالية التعليمات البرمجية أعلاه التي تعرض مضلعًا ممتدًا عموديًا باستخدام طبقة إقصاء مضلع.
إضافة مضلعاتٍ تستند إلى البيانات
يمكن عرض خريطة choropleth باستخدام طبقة إقصاء المضلع. عيّن خصائص height وfillColor لطبقة الإقصاء إلى قياس المتغير الإحصائي في هندسة الميزات Polygon وMultiPolygon. يُظهر نموذج التعليمات البرمجية التالي خريطة choropleth مُقصاة للولايات المتحدة استنادًا إلى قياس كثافة السكان حسب الولاية.
// Create a data source and add it to the map.
let source = DataSource()

// Import the geojson data and add it to the data source.
source.importData(fromURL: Bundle.main.url(forResource: "US_States_Population_Density", withExtension: "json")!)

map.sources.add(source)

// Create and add a polygon extrusion layer to the map below the labels so that they are still readable.
let densityColorSteps: [Int: UIColor] = [
    0: UIColor(red: 0, green: 1, blue: 0.5, alpha: 1),
    10: UIColor(red: 9 / 255, green: 224 / 255, blue: 118 / 255, alpha: 1),
    20: UIColor(red: 11 / 255, green: 191 / 255, blue: 103 / 255, alpha: 1),
    50: UIColor(red: 247 / 255, green: 227 / 255, blue: 5 / 255, alpha: 1),
    100: UIColor(red: 247 / 255, green: 199 / 255, blue: 7 / 255, alpha: 1),
    200: UIColor(red: 247 / 255, green: 130 / 255, blue: 5 / 255, alpha: 1),
    500: UIColor(red: 247 / 255, green: 94 / 255, blue: 5 / 255, alpha: 1),
    1000: UIColor(red: 247 / 255, green: 37 / 255, blue: 5 / 255, alpha: 1)
]
let colorExpression = NSExpression(
    forAZMStepping: NSExpression(forKeyPath: "density"),
    from: NSExpression(forConstantValue: UIColor(red: 0, green: 1, blue: 0.5, alpha: 1)),
    stops: NSExpression(forConstantValue: densityColorSteps)
)

let densityHeightSteps: [Int: Int] = [
    0: 100,
    1200: 960_000
]
let heightExpression = NSExpression(
    forAZMInterpolating: NSExpression(forKeyPath: "density"),
    curveType: .linear,
    parameters: nil,
    stops: NSExpression(forConstantValue: densityHeightSteps)
)

map.layers.insertLayer(
    PolygonExtrusionLayer(source: source, options: [
        .fillOpacity(0.7),
        .fillColor(from: colorExpression),
        .height(from: heightExpression)
    ]),
    below: "labels"
)
تُظهر لقطة الشاشة التالية خريطة choropleth للولايات الأمريكية ملونة وممتدة عموديًا كمضلعات مُقصاة استنادًا إلى كثافة السكان.

معلومات إضافية
راجع المقالات التالية للحصول على المزيد من نماذج التعليمات البرمجية لإضافتها إلى الخرائط الخاصة بك:
الملاحظات
قريبًا: خلال عام 2024، سنتخلص تدريجيًا من GitHub Issues بوصفها آلية إرسال ملاحظات للمحتوى ونستبدلها بنظام ملاحظات جديد. لمزيد من المعلومات، راجع https://aka.ms/ContentUserFeedback.
إرسال الملاحظات وعرضها المتعلقة بـ