إضافة طبقة فقاعة إلى خريطة
توضح لك هذه المقالة كيفية عرض بيانات النقطة من مصدر بيانات كطبقة فقاعية على الخريطة. طبقات الفقاعات تقدم النقاط كدوائر على الخريطة بنصف قطر بكسل ثابت.
تلميح
ستعرض الطبقات الفقاعية بشكل افتراضي إحداثيات كل الأشكال الهندسية في مصدر البيانات. للحد من الطبقة بحيث تعرض فقط ميزات هندسة النقاط، قم بتعيين خاصية filter للطبقة إلى ['==', ['geometry-type'], 'Point'] أو ['any', ['==', ['geometry-type'], 'Point'], ['==', ['geometry-type'], 'MultiPoint']] إذا أردت تضمين ميزات مجموعة النقاط أيضاً.
إضافة طبقة فقاعة
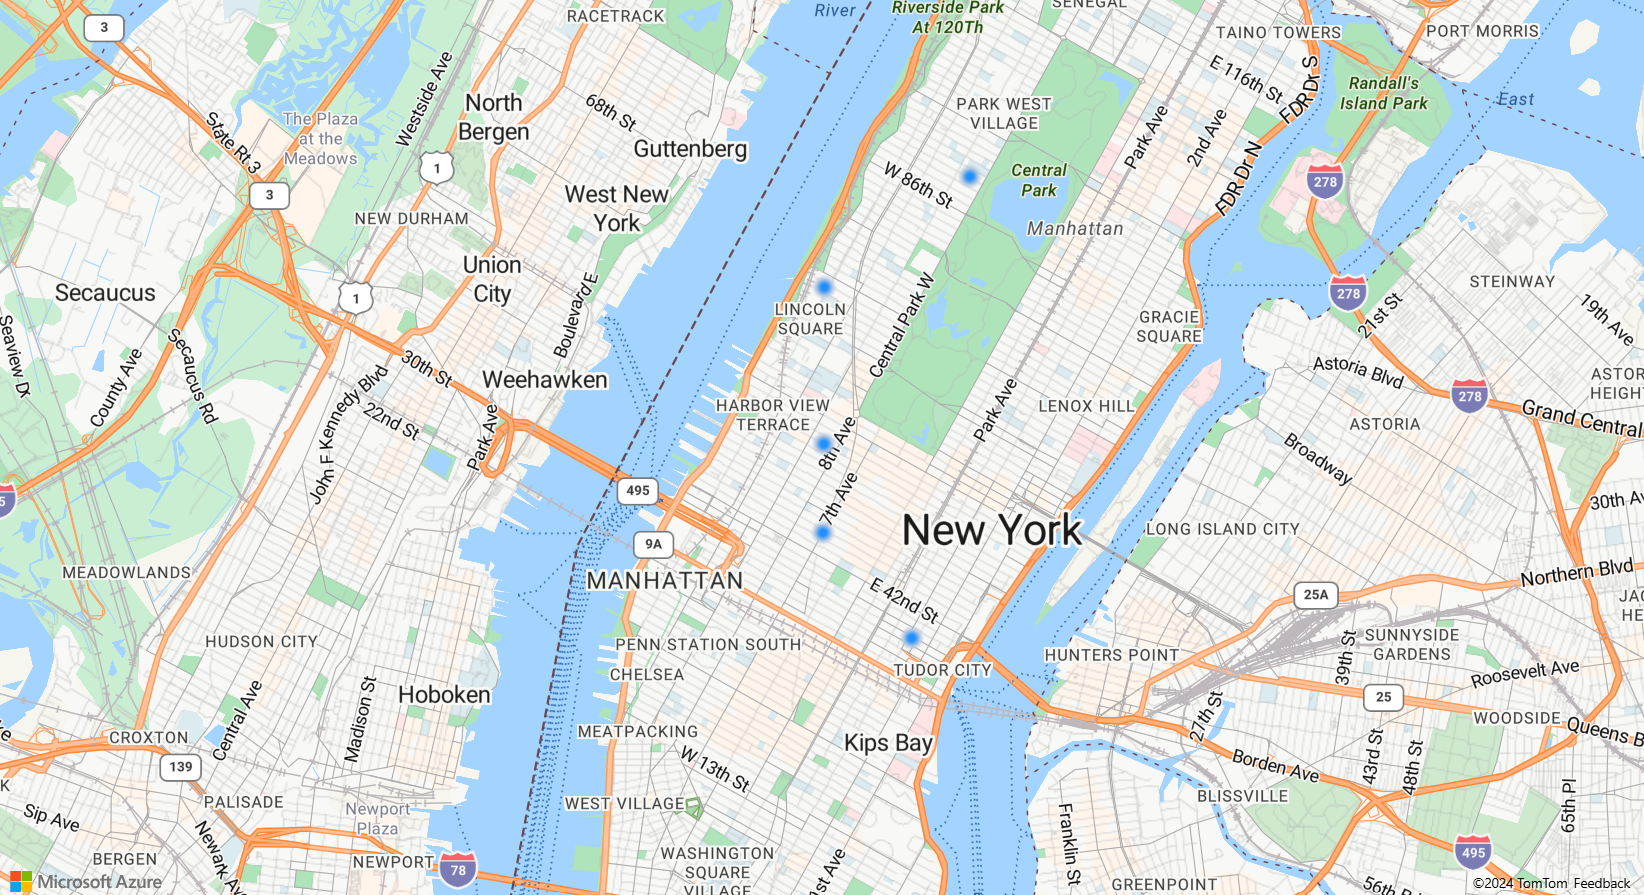
تحمل التعليمة البرمجية التالية صفيفاً من النقاط في مصدر بيانات. بعد ذلك، يقوم بتوصيل نقاط البيانات بطبقة فقاعية. تعرض طبقة الفقاعة كل فقاعة نصف قطرها ستة بكسل وعرض ضغطة من ثلاثة بكسل.
/*Ensure that the map is fully loaded*/
map.events.add("load", function () {

  /*Add point locations*/
  var points = [
    new atlas.data.Point([-73.985708, 40.75773]),
    new atlas.data.Point([-73.985600, 40.76542]),
    new atlas.data.Point([-73.985550, 40.77900]),
    new atlas.data.Point([-73.975550, 40.74859]),
    new atlas.data.Point([-73.968900, 40.78859])]

  /*Create a data source and add it to the map*/
  var dataSource = new atlas.source.DataSource();
  map.sources.add(dataSource);
  /*Add the points to the data source*/
  dataSource.add(points);

  //Create a bubble layer to render the filled in area of the circle, and add it to the map.*/
  map.layers.add(new atlas.layer.BubbleLayer(dataSource, null, {
    radius: 6,
    strokeColor: "LightSteelBlue",
    strokeWidth: 3,
    color: "DodgerBlue",
    blur: 0.5
  }));
});
إظهار الملصقات مع طبقة فقاعية
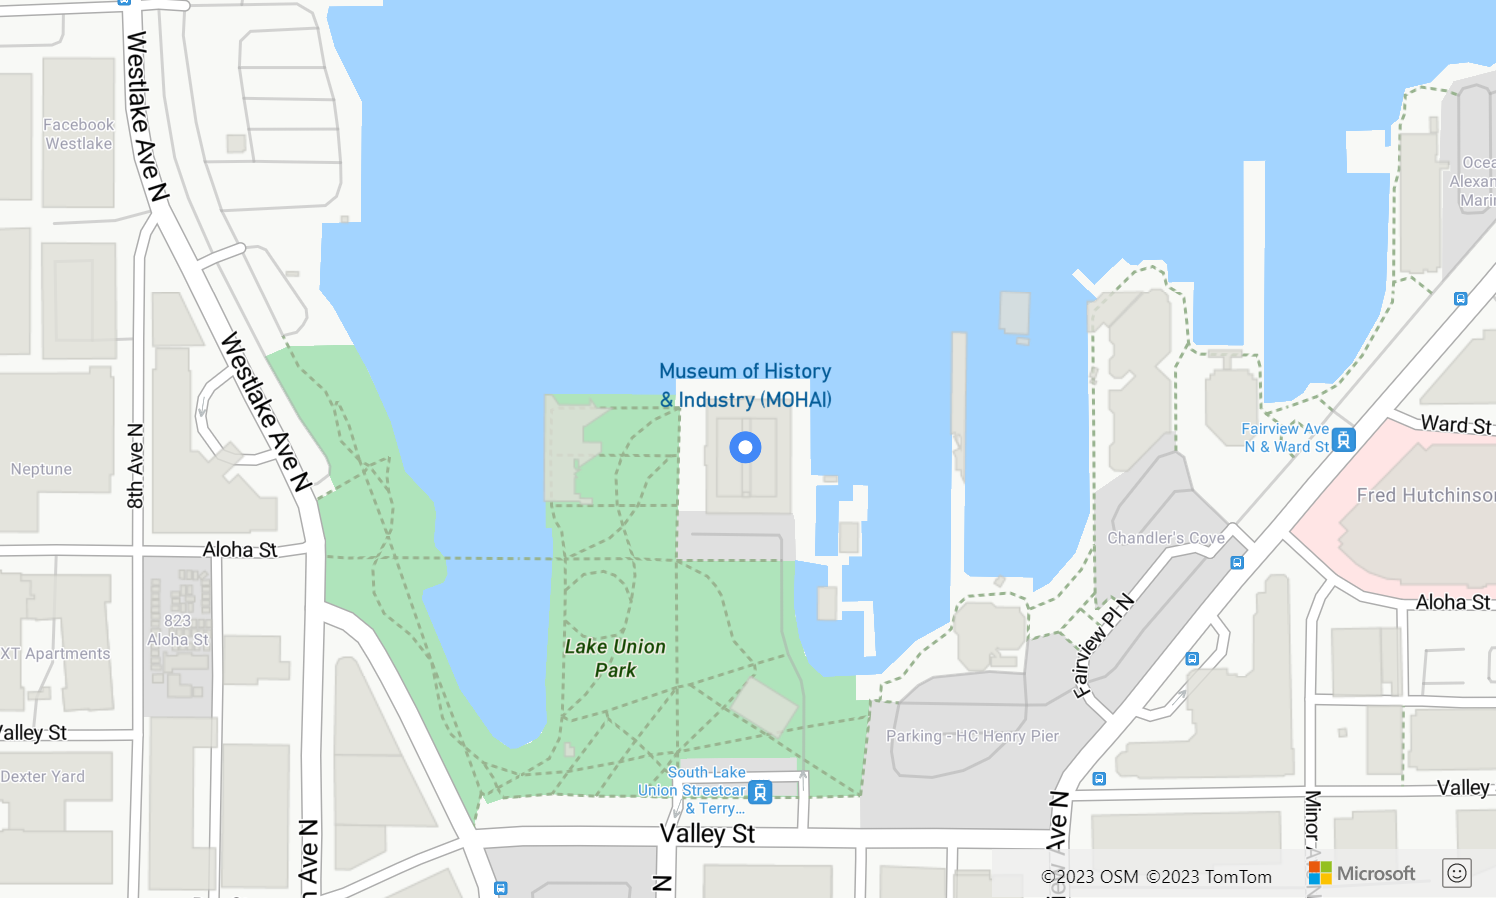
توضح لك هذه التعليمة البرمجية كيفية استخدام طبقة فقاعة لعرض نقطة على الخريطة وطبقة رمز لعرض تسمية. لإخفاء أيقونة طبقة الرمز، قم بتعيين image خاصية خيارات الأيقونة إلى none.
//Create an instance of the map control and set some options.
 function InitMap()

    var map = new atlas.Map('myMap', {
    center: [-122.336641, 47.627631],
    zoom: 16,
    view: "Auto",
        authOptions: {
            authType: 'subscriptionKey',
            subscriptionKey: '{Your-Azure-Maps-Subscription-key}'
        }
    });

    /*Ensure that the map is fully loaded*/
    map.events.add("load", function () {

        /*Create point object*/
        var point =  new atlas.data.Point([-122.336641,47.627631]);

        /*Create a data source and add it to the map*/
        var dataSource = new atlas.source.DataSource();
        map.sources.add(dataSource);
        dataSource.add(point);

        map.layers.add(new atlas.layer.BubbleLayer(dataSource, null, {
            radius: 5,
            strokeColor: "#4288f7",
            strokeWidth: 6,
            color: "white"
        }));

        //Add a layer for rendering point data.
        map.layers.add(new atlas.layer.SymbolLayer(dataSource, null, {
            iconOptions: {
                //Hide the icon image.
                image: "none"
            },

            textOptions: {
                textField: "Museum of History & Industry (MOHAI)",
                color: "#005995",
                offset: [0, -2.2]
            },
        }));
    });
}
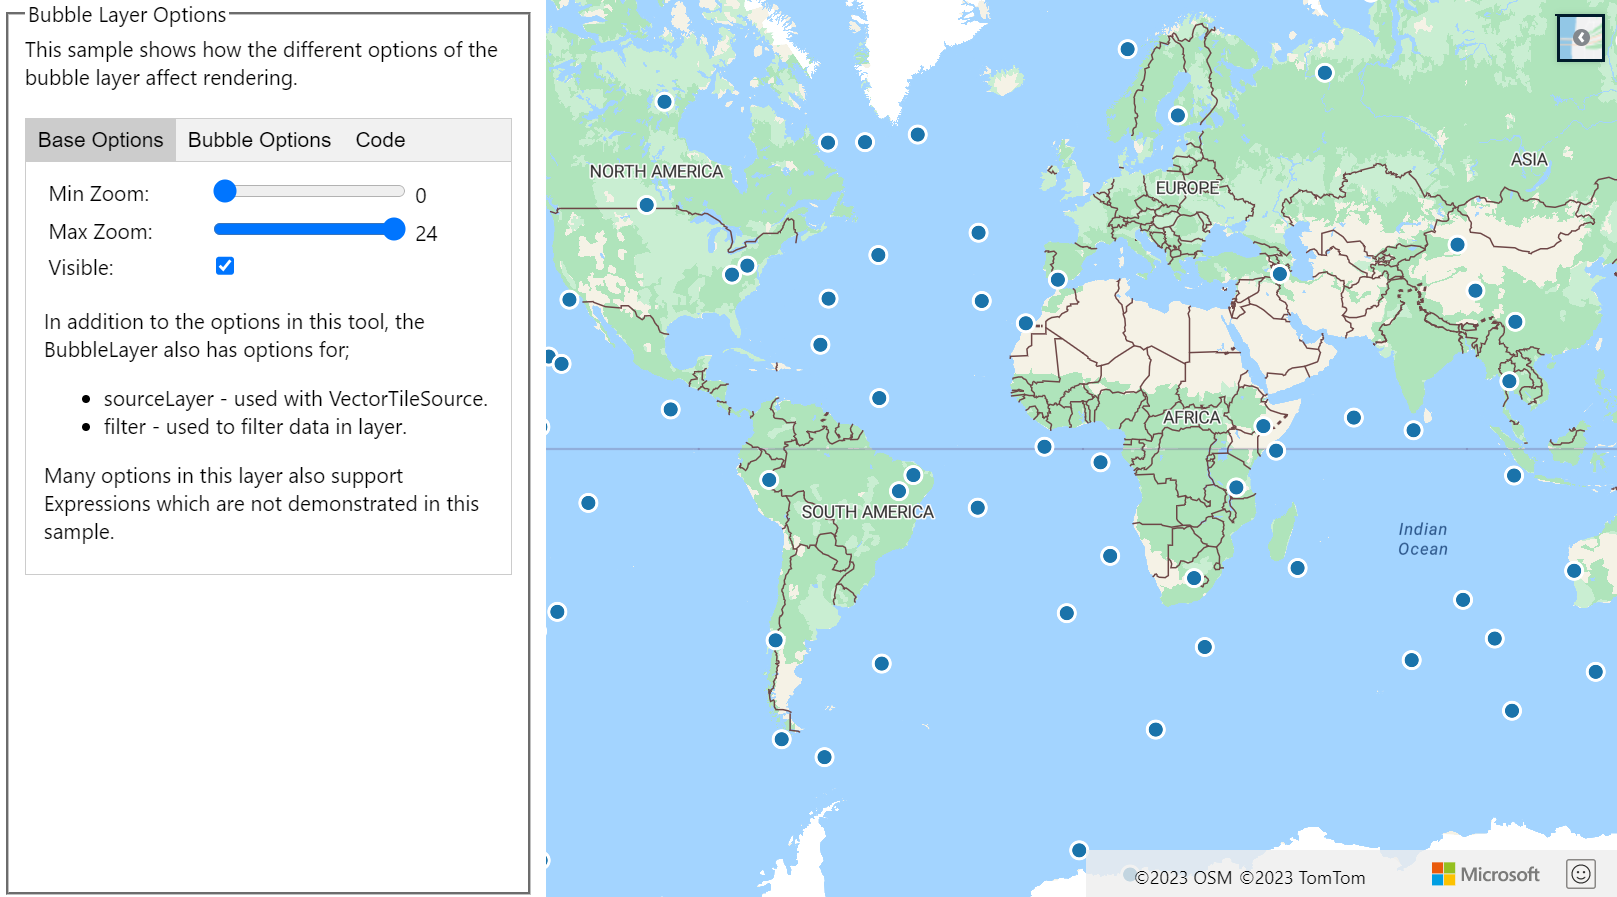
تخصيص الطبقة الفقاعية
تحتوي طبقة الفقاعة على بعض خيارات التصميم فقط. استخدم نموذج خيارات طبقة الفقاعة لتجربتها. للحصول على التعليمات البرمجية المصدر لهذه العينة، راجع التعليمات البرمجية المصدر لخيارات طبقة الفقاعة.
الخطوات التالية
تعرّف على المزيد حول الفئات والأساليب المستخدمة في هذه المقالة:
راجع المقالات التالية للحصول على المزيد من نماذج التعليمات البرمجية لإضافتها إلى الخرائط الخاصة بك:
الملاحظات
قريبًا: خلال عام 2024، سنتخلص تدريجيًا من GitHub Issues بوصفها آلية إرسال ملاحظات للمحتوى ونستبدلها بنظام ملاحظات جديد. لمزيد من المعلومات، راجع https://aka.ms/ContentUserFeedback.
إرسال الملاحظات وعرضها المتعلقة بـ