CSV file upload to Delta table for Power BI reporting
Microsoft Fabric Lakehouse is a data architecture platform for storing, managing, and analyzing structured and unstructured data in a single location.
In this tutorial you learn to:
- Upload a CSV file to a Lakehouse
- Convert the file to a Delta table
- Generate a semantic model and create a Power BI report
Create a Lakehouse and get a CSV file ready
In Microsoft Fabric, select Synapse Data Engineering.
Make sure that you're in your desired workspace, or select or create one.
In the Home page, select Lakehouse.
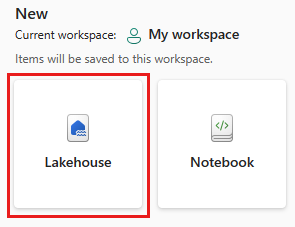
Enter name of your Lakehouse.
Select Create.
Download the "Taxi Zone Lookup Table" CSV file from the TLC Trip Record Data website, and save to a location in your computer.

Upload a CSV file to the Lakehouse
Create the
TaxiDatafolder under theFilessection of your Lakehouse.Upload the file to the folder, by using the Upload file item in the folder contextual menu.
Once uploaded, select the folder to see its content.
Rename the file to remove special characters, in this example, remove the '+' character. To see the full list of special characters, read the Load to Delta Lake tables article.

Load the file to a Delta table
Right-click or use the ellipsis on the CSV file to access the contextual menu. Select Load to Tables and choose the New table option.
The load to tables user interface shows up with the suggested table name. Real time validations on special characters apply during typing.
Select Load to execute the load.
The table now shows up in the lakehouse explorer, expand the table to see the columns and its types. Select the table to see a preview.

Note
If the table already exists, different load mode options are shown. Overwrite will drop and recreate the table. Append will insert all CSV content as new data. For an in-depth guide on the Load to Tables feature, read the Load to Tables article.
Generate a semantic model and create a Power BI report
Select New Power BI semantic model on the Lakehouse ribbon.
Select the table to be added to the semantic model, select the Confirm button.
With semantic model editing, you are able to define relationships between multiple tables, and also apply data types normalization and DAX transformations to the data if desired.
Select New report on the ribbon.
Use the report builder to design a Power BI report.


Related content
الملاحظات
قريبًا: خلال عام 2024، سنتخلص تدريجيًا من GitHub Issues بوصفها آلية إرسال ملاحظات للمحتوى ونستبدلها بنظام ملاحظات جديد. لمزيد من المعلومات، راجع https://aka.ms/ContentUserFeedback.
إرسال الملاحظات وعرضها المتعلقة بـ