How to use Data Wrangler on Spark DataFrames (Preview)
Data Wrangler, a notebook-based tool for exploratory data analysis, now supports both Spark DataFrames and pandas DataFrames, generating PySpark code in addition to Python code. For a general overview of Data Wrangler, which covers how to explore and transform pandas DataFrames, see the the main tutorial. The following tutorial shows how to use Data Wrangler to explore and transform Spark DataFrames.
Important
This feature is in preview.
Prerequisites
Get a Microsoft Fabric subscription. Or, sign up for a free Microsoft Fabric trial.
Sign in to Microsoft Fabric.
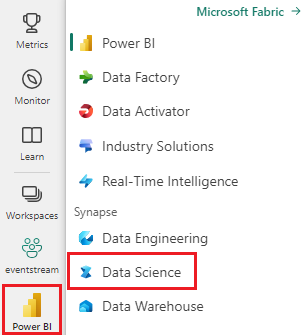
Use the experience switcher on the left side of your home page to switch to the Synapse Data Science experience.
Launching Data Wrangler with a Spark DataFrame
Users can open Spark DataFrames in Data Wrangler directly from a Microsoft Fabric notebook, by navigating to the same dropdown prompt where pandas DataFrames are displayed. A list of active Spark DataFrames appear in the dropdown beneath the list of active pandas variables.
The next code snippet creates a Spark DataFrame with the same sample data used in the pandas Data Wrangler tutorial:
import pandas as pd

# Read a CSV into a Spark DataFrame
df = spark.createDataFrame(pd.read_csv("https://raw.githubusercontent.com/plotly/datasets/master/titanic.csv"))
display(df)
Under the notebook ribbon "Data" tab, use the Data Wrangler dropdown prompt to browse active DataFrames available for editing. Select the one you wish to open in Data Wrangler.
Tip
Data Wrangler cannot be opened while the notebook kernel is busy. An executing cell must finish its execution before Data Wrangler can be launched.

Choosing custom samples
Data Wrangler automatically converts Spark DataFrames to pandas samples for performance reasons. However, all the code generated by the tool is ultimately translated to PySpark when it exports back to the notebook. As with any pandas DataFrame, you can customize the default sample by selecting "Choose custom sample" from the Data Wrangler dropdown menu. Doing so launches a pop-up with options to specify the size of the desired sample (number of rows) and the sampling method (first records, last records, or a random set).


Viewing summary statistics
When Data Wrangler loads, an informational banner above the preview grid reminds you that Spark DataFrames are temporarily converted to pandas samples, but all generated code is ultimately be converted to PySpark. Using Data Wrangler on Spark DataFrames is otherwise no different from using it on pandas DataFrames. A descriptive overview in the Summary panel displays information about the sample's dimensions, missing values, and more. Selecting any column in the Data Wrangler grid prompts the Summary panel to update and display descriptive statistics about that specific column. Quick insights about every column are also available in its header.
Tip
Column-specific statistics and visuals (both in the Summary panel and in the column headers) depend on the column datatype. For instance, a binned histogram of a numeric column will appear in the column header only if the column is cast as a numeric type. Use the Operations panel to recast column types for the most accurate display.

Browsing data-cleaning operations
A searchable list of data-cleaning steps can be found in the Operations panel. (A smaller selection of the same operations is also available in the contextual menu of each column.) From the Operations panel, selecting a data-cleaning step prompts you to provide a target column or columns, along with any necessary parameters to complete the step. For example, the prompt for scaling a column numerically requires a new range of values.

Previewing and applying operations
The results of a selected operation are automatically previewed in the Data Wrangler display grid, and the corresponding code automatically appears in the panel below the grid. To commit the previewed code, select "Apply" in either place. To get rid of the previewed code and try a new operation, select "Discard."

Once an operation is applied, the Data Wrangler display grid and summary statistics update to reflect the results. The code appears in the running list of committed operations, located in the Cleaning steps panel.

Tip
You can always undo the most recently applied step with the trash icon beside it, which appears if you hover your cursor over that step in the Cleaning steps panel.

The following table summarizes the operations that Data Wrangler currently supports for Spark DataFrames:
| Operation | Description |
|---|---|
| Sort | Sort a column in ascending or descending order |
| Filter | Filter rows based on one or more conditions |
| One-hot encode | Create new columns for each unique value in an existing column, indicating the presence or absence of those values per row |
| One-hot encode with delimiter | Split and one-hot encode categorical data using a delimiter |
| Change column type | Change the data type of a column |
| Drop column | Delete one or more columns |
| Select column | Choose one or more columns to keep, and delete the rest |
| Rename column | Rename a column |
| Drop missing values | Remove rows with missing values |
| Drop duplicate rows | Drop all rows that have duplicate values in one or more columns |
| Fill missing values | Replace cells with missing values with a new value |
| Find and replace | Replace cells with an exact matching pattern |
| Group by column and aggregate | Group by column values and aggregate results |
| Strip whitespace | Remove whitespace from the beginning and end of text |
| Split text | Split a column into several columns based on a user-defined delimiter |
| Convert text to lowercase | Convert text to lowercase |
| Convert text to uppercase | Convert text to UPPERCASE |
| Scale min/max values | Scale a numerical column between a minimum and maximum value |
| Flash Fill | Automatically create a new column based on examples derived from an existing column |
Saving and exporting code
The toolbar above the Data Wrangler display grid provides options to save the generated code. You can copy the code to the clipboard or export it to the notebook as a function. For Spark DataFrames, all the code generated on the pandas sample is translated to PySpark before it lands back in the notebook. Before Data Wrangler closes, the tool displays a preview of the translated PySpark code and provide an option to export the intermediate pandas code as well.
Tip
The code generated by Data Wrangler won't be applied until you manually run the new cell, and it will not overwrite your original DataFrame.


Related content
- To get an overview of Data Wrangler, see this companion article.
- To try out Data Wrangler in VS Code, see Data Wrangler in VS Code.
الملاحظات
قريبًا: خلال عام 2024، سنتخلص تدريجيًا من GitHub Issues بوصفها آلية إرسال ملاحظات للمحتوى ونستبدلها بنظام ملاحظات جديد. لمزيد من المعلومات، راجع https://aka.ms/ContentUserFeedback.
إرسال الملاحظات وعرضها المتعلقة بـ