Monitoring status and performance of an eventstream
The Microsoft Fabric event streams feature allows you to easily monitor streaming event data, ingestion status, and ingestion performance. This article explains how to monitor the eventstream status, check logs, errors, and data insights with metrics.
In an eventstream, there are two types of monitoring experiences: Data insights and Runtime logs. You see one or both views, depending on the source or destination you select.
Prerequisites
Before you start, you must have:
- Access to a workspace with Viewer or above permissions where your Eventstream item is located.
- An Azure event hub source or lakehouse destination added to your eventstream.
Data insights
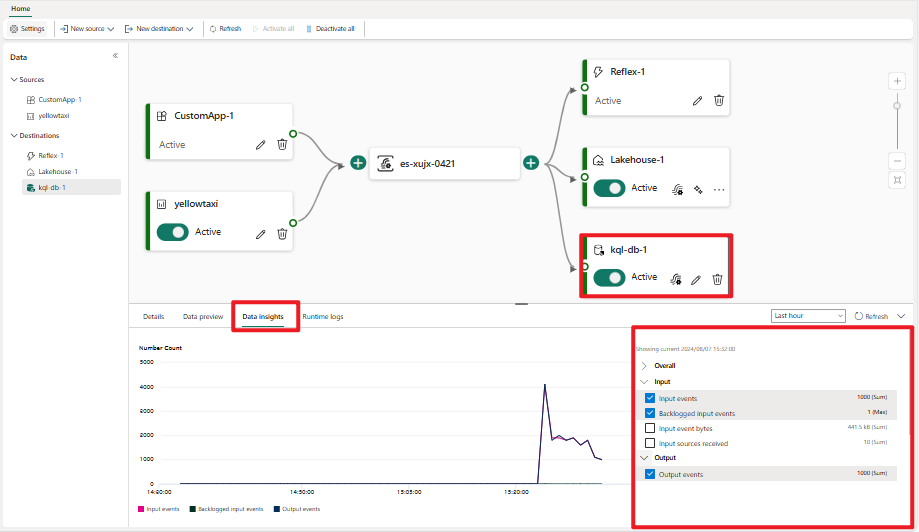
The Data insights tab appears in the lower pane of the main editor. The tab provides metrics that you can use to monitor the status and performance of the eventstream, sources, and destinations. Different sources and destinations have different metrics. When you select a node in the main editor canvas, the metrics for that specific node appear in the Data insights tab.
Data insights in an eventstream node
The following metrics appear for an eventstream node on the Data insights tab:
| Metric | Unit | Description |
|---|---|---|
| IncomingMessages | Count | The number of events or messages sent to an eventstream over a specified period. |
| OutgoingMessages | Count | The number of events or messages outflow from an eventstream over a specified period. |
| IncomingBytes | Bytes | Incoming bytes for an eventstream over a specified period. |
| OutgoingBytes | Bytes | Outgoing bytes for an eventstream over a specified period. |
To view data insights for an eventstream:
Select the eventstream node in the main editor canvas.
In the lower pane, select the Data insights tab.
If there's data within the event stream, the metrics chart appears on the Data insights tab.
On the right side of the tab, select the checkboxes next to the metrics you want to display.
Data insights in Azure event hub, Azure iot hub, lakehouse, Eventhouse, derived stream and Fabric activator nodes
The following metrics are available on the Data insights tab for Azure event hub, Azure iot hub, lakehouse, Eventhouse('Event processing before ingestion' mode), derived stream and Fabric activator nodes:
| Metric | Unit | Description |
|---|---|---|
| Input events | Count | Number of event data that the eventstream engine pulls from an eventstream (in a lakehouse, Eventhouse, derived stream or Fabric activator destination), or from an event source (in an Azure event hub or Azure iot hub source). |
| Input event bytes | Bytes | Amount of event data that the eventstream engine pulls from an eventstream (in a lakehouse, Eventhouse, derived stream or Fabric activator destination), or from an event source (in an Azure event hub or Azure iot hub source). |
| Output events | Count | Number of event data that the eventstream engine sends to a lakehouse or Eventhouse (in a lakehouse, Eventhouse, derived stream or Fabric activator destination), or from an event source (in an Azure event hub or Azure iot hub source). |
| Backlogged input events | Count | Number of input events that are backlogged in the eventstream engine. |
| Runtime errors | Count | Total number of errors related to event processing. |
| Data conversion errors | Count | Number of output events that couldn't be converted to the expected output schema. |
| Deserialization errors | Count | Number of input events that couldn't be deserialized inside the eventstream engine. |
| Watermark delay | Second | Maximum watermark delay across all partitions of all outputs for this source or destination. It's computed as the wall clock time minus the largest watermark. |
To view the data insights for an Azure event hub, Azure iot hub, lakehouse, Eventhouse('Event processing before ingestion' mode), derived stream and Fabric activator:
Select the Azure event hub, Azure iot hub, lakehouse, Eventhouse, derived stream or Fabric activator node in the main editor canvas
In the lower pane, select the Data insights tab.
If there's data inside the Azure event hub, Azure iot hub, lakehouse, Eventhouse, derived stream or Fabric activator, the metrics chart appears on the Data insights tab.
On the right side of the tab, select the checkboxes next to the metrics you want to display.
Data insights in streaming connector source nodes
The streaming connector source nodes include the following sources:
- Azure SQL Database Change Data Capture (CDC)
- Azure Service Bus
- PostgreSQL Database CDC
- MySQL Database CDC
- Azure Cosmos DB CDC
- SQL Server on VM DB (CDC)
- Azure SQL Managed Instance CDC
- Google Cloud Pub/Sub
- Amazon Kinesis Data Streams
- Confluent Cloud Kafka
- Apache Kafka
- Amazon MSK Kafka
The following metrics are available on the Data insights tab for streaming connector source nodes:
| Metric | Unit | Description |
|---|---|---|
| Source Outgoing Events | Count | Number of records outputted from the transformations (if any) and written to eventstream for the task belonging to the named source connector in the worker (since the task was last restarted). |
| Source Incoming Events | Count | Before transformations are applied, this is the number of records produced or polled by the task belonging to the named source connector in the worker (since the task was last restarted). |
| Connector Errors Logged | Count | The number of errors that were logged for this connector task(s). |
| Connector Processing Errors | Count | The number of record processing errors in this connector task(s). |
| Connector Processing Failures | Count | The number of record processing failures in this connector task(s), including retry failures. |
| Connector Events Skipped | Count | The number of records skipped due to errors within this connector task(s). |
To view the data insights for a streaming connector source:
- Select Use external source, then choose a streaming connector source.
- Configure and publish the streaming connector source.
- In the lower pane in live view, select the Data insights tab.
- If there's data inside the streaming connector source, the metrics chart appears on the Data insights tab.
- On the right side of the tab, select the checkboxes next to the metrics you want to display.
Runtime logs
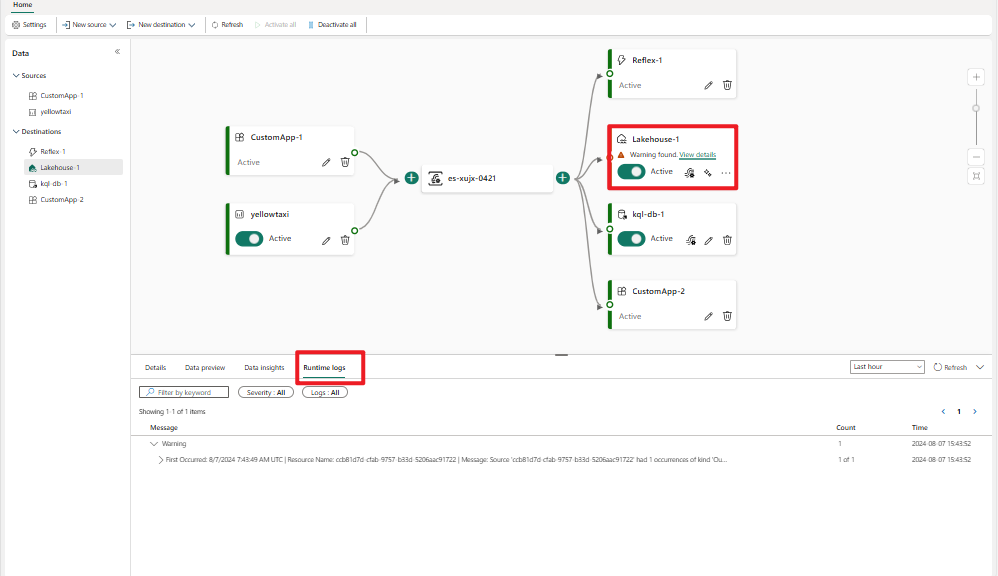
The Runtime logs tab enables you to check the detailed logs that occur in the eventstream engine. Runtime logs have three severity levels: warning, error, and information.
To view the runtime logs for Azure event hub, Azure iot hub, streaming connector source, lakehouse, Eventhouse ('Event processing before ingestion' mode) or Fabric activator:
Select the node in the main editor canvas.
In the lower pane, select the Runtime logs tab.
If there's data inside the Azure event hub, Azure iot hub, streaming connector source, lakehouse, Eventhouse or Fabric activator, the logs appear on the Runtime logs tab.
Search the logs with the Filter by keyword option, or filter the list by changing the severity or type.
To see the most current logs, select Refresh.


