إشعار
يتطلب الوصول إلى هذه الصفحة تخويلاً. يمكنك محاولة تسجيل الدخول أو تغيير الدلائل.
يتطلب الوصول إلى هذه الصفحة تخويلاً. يمكنك محاولة تغيير الدلائل.
This article covers techniques on how a developer can achieve high performance when rendering their custom visuals.
No one wants a visual to take a long time to render. Getting the visual to render as quickly as possible is critical when writing the code.
Note
As we continue to improve and enhance the platform, new versions of the API are constantly being released. In order to get the most out of the Power BI visuals' platform and feature set, we recommend that you keep up-to-date with the most recent version. To find out which version you’re using, check the apiVersion in the pbiviz.json file.
Here are some recommendations for achieving optimal performance for your custom visual.
Reduce plugin size
A smaller custom visual plugin size results in:
- Faster download time
- Faster installation whenever the visual is run
These third party resources can help you decrease your plugin size, by finding ways for you to remove unused code or tree-shaking and code-splitting.
Check render time of the visual
Measure the render time of your visual in various situations to see which, if any, parts of the script need optimization.
Power BI Desktop performance analyzer
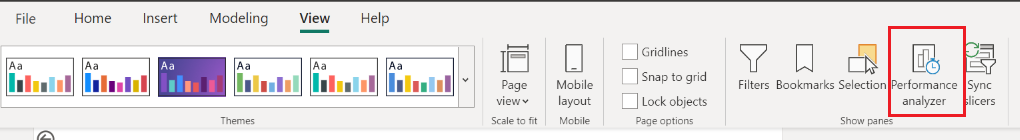
Use the Power BI Desktop performance analyzer (View > Performance Analyzer) to check how your visual renders in the following cases:
- First render of the visual
- Thousands of data points
- A single data point/measure (to determine the visual render overhead)
- Filtering
- Slicing
- Resizing (may not work in the performance analyzer)
If possible, compare these measurements with those of a similar core visual to see if there are parts that can be optimized.
Use the User Timing API
Use the User Timing API to measure your app's JavaScript performance. This API can also help you decide which parts of the script need optimization.
For more information, see the Using the User Timing API.
Other ways to test your custom visual
Code instrumentation - Use the following console tools to gather data about your custom visual's performance (note that these tools link to external third party tools):
The following web developer tools can also help measure your visual's performance, but keep in mind that they profile Power BI as well:
Once you determined which parts of your visual need optimization, check out these tips.
Update messages
When you update the visual:
- Don't rerender the entire visual if only some elements have changed. Render only the necessary elements.
- Store the data view passed on update. Render only the data points that are different from the previous data view. If they haven't changed, there's no need to rerender them.
- Resizing is often done automatically by the browser and doesn't require an update to the visual.
Cache DOM nodes
When a node or list of nodes is retrieved from the DOM, think about whether you can reuse them in later computations (sometimes even the next loop iteration). As long as you don't need to add or delete more nodes in the relevant area, caching them can improve the application's overall efficiency.
To make sure that your code is fast and doesn’t slow down the browser, keep DOM access to a minimum.
For example:
Instead of:
public update(options: VisualUpdateOptions) {
    let axis = $(".axis");
}
Try:
public constructor(options: VisualConstructorOptions) {
    this.$root = $(options.element);
    this.xAxis = this.$root.find(".xAxis");
}

public update(options: VisualUpdateOptions) {
    let axis = this.axis;
}
Avoid DOM manipulation
Limit DOM manipulations as much as possible. Insert operations like prepend(), append(), and after() are time-consuming and should only be used when necessary.
For example:
Instead of:
for (let i=0; i<1000; i++) {
    $('#list').append('<li>'+i+'</li>');
}
Try:
Make the above example faster by using html() and building the list beforehand:
let list = '';
for (let i=0; i<1000; i++) {
    list += '<li>'+i+'</li>';
}

$('#list').html(list);
Reconsider JQuery
Limit JS frameworks and use native JS whenever possible to increase the available bandwidth and lower your processing overhead. Doing this might also decrease compatibility issues with older browsers.
For more information, see youmightnotneedjquery.com for alternative examples for functions such as JQuery's show, hide, addClass, and more.
Animation
Animation options
For repeated use of animations, consider using Canvas or WebGL instead of SVG. Unlike SVG, with these options performance is determined by size rather than content.
Read more about the differences in SVG vs Canvas: How to Choose.
Canvas performance tips
Check out the following third party sites for tips on improving canvas performance.
For example, learn how to avoid unnecessary canvas state changes by rendering by color instead of position.
Animation functions
Use requestAnimationFrame to update your on-screen animations, so your animation functions are called before the browser calls another repaint.
Animation loops
Does the animation loop redraw unchanged elements?
If so, it wastes time drawing elements that don’t change from frame-to-frame.
Solution: Update the frames selectively.
When you're animating static visualizations, it’s tempting to lump all the draw code into one update function and repeatedly call it with new data for each iteration of the animation loop.
Instead, consider using a visual constructor method to draw everything static. Then the update function only needs to draw visualization elements that change.
Tip
Inefficient animation loops are often found in axes and legends.
Common issues
- Text size calculation: When there are a lot of data points, don't waste time calculating text size for each point. Calculate a few points and then estimate.
- If some elements of the visual aren't seen in the display, there's not need to render them.
Related content
Optimization guide for Power BI
More questions? Ask the Power BI Community.