إشعار
يتطلب الوصول إلى هذه الصفحة تخويلاً. يمكنك محاولة تسجيل الدخول أو تغيير الدلائل.
يتطلب الوصول إلى هذه الصفحة تخويلاً. يمكنك محاولة تغيير الدلائل.
مرحبا بك في مرجع واجهة برمجة تطبيقات REST لمدير عمليات مركز النظام.
ينطبق هذا المرجع لواجهة برمجة تطبيقات نقل الحالة التمثيلية (REST) على System Center Operations Manager 1801 والإصدارات الأحدث. يدعم البرنامج مجموعة من عمليات HTTP (الأساليب) لإنشاء الوصول إلى البيانات التشغيلية أو استردادها أو تحديثها أو حذفها باستخدام عنصر واجهة مستخدم لوحة المعلومات المخصصة في وحدة تحكم System Center Operations Manager 1801 Web الجديدة.
تتضمن لوحات المعلومات الجديدة المستندة إلى HTML5 دعما لأداة مخصصة تنفذ تعليمة HTML البرمجية التي تستخدم الأساليب المتوفرة في واجهة برمجة تطبيقات REST هذه لتصور الإخراج المطلوب في مجموعة متنوعة من المرئيات. لمزيد من المعلومات حول لوحات معلومات Operations Manager HTLM5، راجع نظرة عامة على وحدة تحكم الويب ولوحات معلومات HTML5. لمزيد من المعلومات حول كيفية العمل مع عنصر واجهة المستخدم المخصص، راجع كيفية إنشاء لوحة معلومات باستخدام عنصر واجهة المستخدم المخصص في وحدة تحكم الويب.
ملاحظة
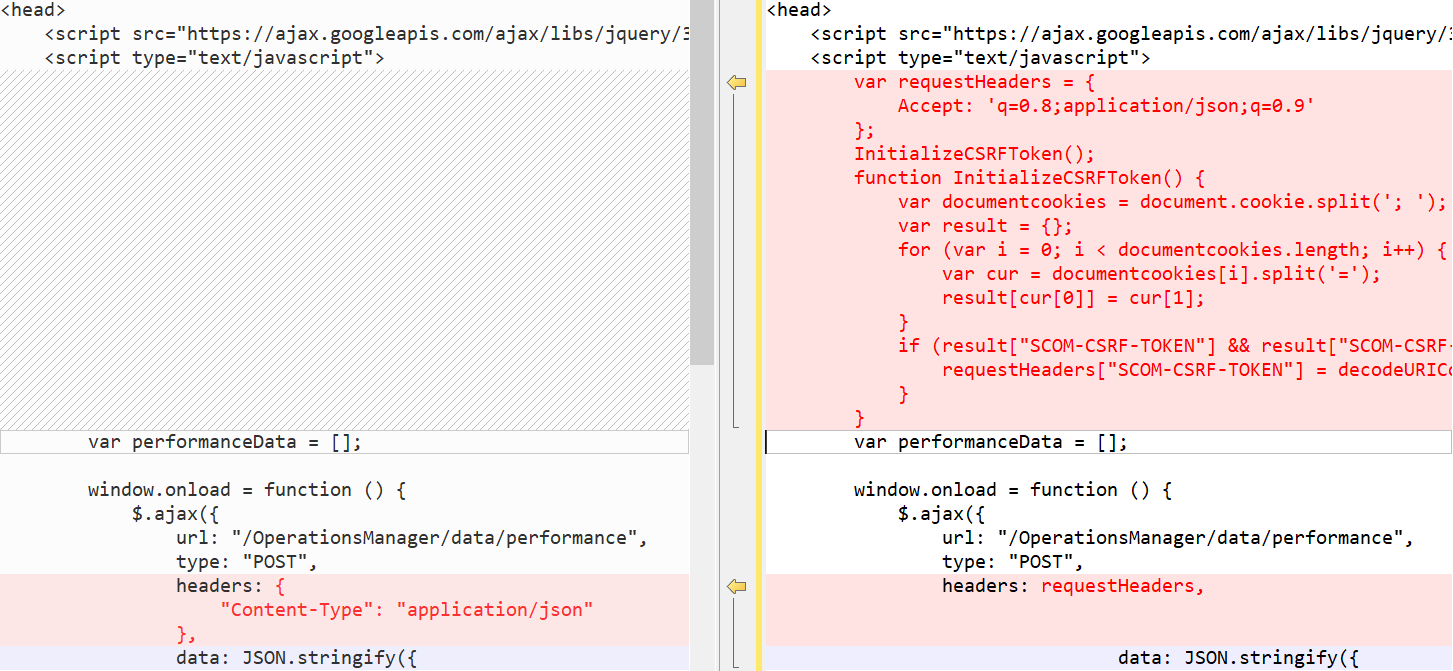
يدعم Operations Manager 2019 UR1 الرموز المميزة لتزوير طلبات المواقع المشتركة (CSRF) لمنع هجمات CSRF. إذا كنت تستخدم Operations Manager 2019 UR1، يجب تهيئة رمز CSRF المميز. لا تعمل برامج HTML النصية إذا لم تتم تهيئة رموز CSRF المميزة.
تهيئة رمز CSRF المميز
الإجراء المطلوب، ينطبق على Operations Manager 2019 UR1.
- في رأس HTML للوحة المعلومات، أضف التعليمات البرمجية التالية:
            Accept: 'q=0.8;application/json;q=0.9',
            "Content-Type": "application/json"
        };
        InitializeCSRFToken();
        function InitializeCSRFToken() {
            var documentcookies = document.cookie.split('; ');
            var result = {};
            for (var i = 0; i < documentcookies.length; i++) {
                var cur = documentcookies[i].split('=');
                result[cur[0]] = cur[1];
            }
            if (result["SCOM-CSRF-TOKEN"] && result["SCOM-CSRF-TOKEN"] != null) {
                requestHeaders["SCOM-CSRF-TOKEN"] = decodeURIComponent(result["SCOM-CSRF-TOKEN"]);
            }
        }
- في الدالة onload ، قم بتغيير قيمة العنوان إلى requestHeaders. إذا لم تكن قيمة العنوان موجودة، أضفها كما هو موضح أدناه:
مثال:
أمثلة
توضح الأمثلة التالية كيفية إجراء مكالمات إلى واجهة برمجة تطبيقات REST لمدير العمليات باستخدام عنصر واجهة المستخدم المخصص.
مخطط شريطي
توضح التعليمات البرمجية HTML التالية عرض مخطط شريطي مع بيانات التنبيه.
<html>

<head>
    <script src="https://ajax.googleapis.com/ajax/libs/jquery/3.2.1/jquery.min.js"></script>
    <script type="text/javascript">
        var criticalCounter = 0;
        var informationCounter = 0;
        var warningCounter = 0;

        window.onload = function () {
            $.ajax({
                url: "/OperationsManager/data/alert",
                type: "POST",
                data: JSON.stringify ({
                    "classId": null,
                    "objectIds": { "3c8ac4f3-475e-44dd-4163-8a97af363705": -1 },
                    "criteria": "((Severity = '0') OR (Severity = '1') OR (Severity = '2') OR (Severity = '3')) AND ((Priority = '2') OR (Priority = '1') OR (Priority = '0')) AND ((ResolutionState = '0') OR (ResolutionState = '247') OR (ResolutionState = '248') OR (ResolutionState = '249') OR (ResolutionState = '250') OR (ResolutionState = '254') OR (ResolutionState = '255'))",
                    "displayColumns":
                    [
                        "severity","monitoringobjectdisplayname","name","age","repeatcount","lastModified"
                    ]
                }),
                success: function (result) {
                    for (var i = 0; i < result.rows.length; i++) {
            switch(result.rows[i].severity)
            {
                case "Error":
                    criticalCounter++;
                    break;
                case "Information":
                    informationCounter++;
                    break;
                case "Warning":
                                    warningCounter++
                    break;
            }
                    }
                    renderChart();
                }
            });
        }

        function renderChart() {
            var chart = new CanvasJS.Chart("chartContainer", {
                title: {
                    text: "Alerts representation in bar chart"
                },
                data: [{
                    type: "column",
                    dataPoints: [
                        { y: criticalCounter, label: "Critical" },
                        { y: warningCounter, label: "Warning" },
                        { y: informationCounter, label: "Information" }
                    ]
                }]
            });
            chart.render();
        }
    </script>
    <script src="https://cdnjs.cloudflare.com/ajax/libs/canvasjs/1.7.0/canvasjs.min.js"></script>
    <title>CanvasJS Example</title>
</head>

<body>
    <div id="chartContainer" style="height: 400px; width: 100%;"></div>
</body>

</html>
مخطط دائري
توضح التعليمات البرمجية HTML التالية عرض مخطط دائري مع بيانات التنبيه.
<html>

<head>
    <script src="https://ajax.googleapis.com/ajax/libs/jquery/3.2.1/jquery.min.js"></script>
    <script type="text/javascript">
        var criticalCounter = 0;
        var informationCounter = 0;
        var warningCounter = 0;

        window.onload = function () {
            $.ajax({
                url: "/OperationsManager/data/alert",
                type: "POST",
                data: JSON.stringify ({
                    "classId": null,
                    "objectIds": { "3c8ac4f3-475e-44dd-4163-8a97af363705": -1 },
                    "criteria": "((Severity = '0') OR (Severity = '1') OR (Severity = '2') OR (Severity = '3')) AND ((Priority = '2') OR (Priority = '1') OR (Priority = '0')) AND ((ResolutionState = '0') OR (ResolutionState = '247') OR (ResolutionState = '248') OR (ResolutionState = '249') OR (ResolutionState = '250') OR (ResolutionState = '254') OR (ResolutionState = '255'))",
                    "displayColumns":
                    [
                        "severity","monitoringobjectdisplayname","name","age","repeatcount","lastModified"
                    ]
                }),
                success: function (result) {
                    for (var i = 0; i < result.rows.length; i++) {
            switch(result.rows[i].severity)
            {
                case "Error":
                    criticalCounter++;
                    break;
                case "Information":
                    informationCounter++;
                    break;
                case "Warning":
                                    warningCounter++
                    break;
            }
                    }
                    renderChart();
                }
            });
        }

        function renderChart() {
            var chart = new CanvasJS.Chart("chartContainer",
                {
                    theme: "theme2",
                    title: {
                        text: "Alerts representation in Pie chart"
                    },
                    data: [
                        {
                            type: "pie",
                            showInLegend: true,
                            toolTipContent: "{y} - #percent %",
                            legendText: "{indexLabel}",
                            dataPoints: [
                                { y: criticalCounter, indexLabel: "Critical" },
                                { y: warningCounter, indexLabel: "Warning" },
                                { y: informationCounter, indexLabel: "Information" }
                            ]
                        }
                    ]
                });
            chart.render();
        }
    </script>
    <script src="https://cdnjs.cloudflare.com/ajax/libs/canvasjs/1.7.0/canvasjs.min.js"></script>
    <title>CanvasJS Example</title>
</head>

<body>
    <div id="chartContainer" style="height: 400px; width: 100%;"></div>
</body>

</html>
مخطط دائري ثلاثي الأبعاد
توضح التعليمات البرمجية HTML التالية عرض مخطط دائري ثلاثي الأبعاد مع بيانات التنبيه.
<html>

<head>
    <script src="https://ajax.googleapis.com/ajax/libs/jquery/3.2.1/jquery.min.js"></script>
    <script type="text/javascript">
        var criticalCounter = 0;
        var informationCounter = 0;
        var warningCounter = 0;

        window.onload = function () {
            $.ajax({
                url: "/OperationsManager/data/alert",
                type: "POST",
                data: JSON.stringify ({
                    "classId": null,
                    "objectIds": { "3c8ac4f3-475e-44dd-4163-8a97af363705": -1 },
                    "criteria": "((Severity = '0') OR (Severity = '1') OR (Severity = '2') OR (Severity = '3')) AND ((Priority = '2') OR (Priority = '1') OR (Priority = '0')) AND ((ResolutionState = '0') OR (ResolutionState = '247') OR (ResolutionState = '248') OR (ResolutionState = '249') OR (ResolutionState = '250') OR (ResolutionState = '254') OR (ResolutionState = '255'))",
                    "displayColumns":
                    [
                        "severity","monitoringobjectdisplayname","name","age","repeatcount","lastModified"
                    ]
                }),
                success: function (result) {
                    for (var i = 0; i < result.rows.length; i++) {
            switch(result.rows[i].severity)
            {
                case "Error":
                    criticalCounter++;
                    break;
                case "Information":
                    informationCounter++;
                    break;
                case "Warning":
                                    warningCounter++
                    break;
            }
                    }
                    renderChart();
                }
            });
        }

        function renderChart() {
            var chart = new Highcharts.chart('container', {
    chart: {
        type: 'pie',
        options3d: {
            enabled: true,
            alpha: 45,
            beta: 0
        }
    },
    title: {
        text: 'Alerts share per severity'
    },
    tooltip: {
        pointFormat: '{series.name}: <b>{point.percentage:.1f}%</b>'
    },
    plotOptions: {
        pie: {
            allowPointSelect: true,
            cursor: 'pointer',
            depth: 35,
            dataLabels: {
                enabled: true,
                format: '{point.name}'
            }
        }
    },
    series: [{
        type: 'pie',
        name: 'Alerts share',
        data: [
            {
                name: 'Critical',
                y: 48,
                sliced: true,
                selected: true
            },
            ['Warning', 39],
            ['Information', 13],
        ]
    }]
});

            chart.render();
        }
    </script>
   <script src="https://code.highcharts.com/highcharts.js"></script>
<script src="https://code.highcharts.com/highcharts-3d.js"></script>
<script src="https://code.highcharts.com/modules/exporting.js"></script>

<div id="container" style="height: 400px"></div>
</head>

<body>
    <div id="chartContainer" style="height: 400px; width: 100%;"></div>
</body>

</html>
مخطط دائري مجوف
توضح التعليمات البرمجية HTML التالية عرض مخطط دائري مجوف مع بيانات التنبيه.
<html>

<head>
    <script src="https://ajax.googleapis.com/ajax/libs/jquery/3.2.1/jquery.min.js"></script>
    <script type="text/javascript">
        var criticalCounter = 0;
        var informationCounter = 0;
        var warningCounter = 0;

        window.onload = function () {
            $.ajax({
                url: "/OperationsManager/data/alert",
                type: "POST",
                data: JSON.stringify ({
                    "classId": null,
                    "objectIds": { "3c8ac4f3-475e-44dd-4163-8a97af363705": -1 },
                    "criteria": "((Severity = '0') OR (Severity = '1') OR (Severity = '2') OR (Severity = '3')) AND ((Priority = '2') OR (Priority = '1') OR (Priority = '0')) AND ((ResolutionState = '0') OR (ResolutionState = '247') OR (ResolutionState = '248') OR (ResolutionState = '249') OR (ResolutionState = '250') OR (ResolutionState = '254') OR (ResolutionState = '255'))",
                    "displayColumns":
                    [
                        "severity","monitoringobjectdisplayname","name","age","repeatcount","lastModified"
                    ]
                }),
                success: function (result) {
                    for (var i = 0; i < result.rows.length; i++) {
            switch(result.rows[i].severity)
            {
                case "Error":
                    criticalCounter++;
                    break;
                case "Information":
                    informationCounter++;
                    break;
                case "Warning":
                                    warningCounter++
                    break;
            }
                    }
                    renderChart();
                }
            });
        }

        function renderChart() {
            var chart = new CanvasJS.Chart("chartContainer",
                {
                    theme: "theme2",
animationEnabled: true,
                    title: {
                        text: "Alerts representation in doughnut"
                    },
                    data: [
                        {
                            type: "doughnut",
                indexLabelFontFamily: "Garamond",
                indexLabelFontSize: 20,
                startAngle:0,
                indexLabelFontColor: "dimgrey",
                indexLabelLineColor: "darkgrey",
                toolTipContent: "{y} %",
                            dataPoints: [
                                { y: criticalCounter, indexLabel: "Critical" },
                                { y: warningCounter, indexLabel: "Warning" },
                                { y: informationCounter, indexLabel: "Information" }
                            ]
                        }
                    ]
                });
            chart.render();
        }
    </script>
    <script src="https://cdnjs.cloudflare.com/ajax/libs/canvasjs/1.7.0/canvasjs.min.js"></script>
    <title>CanvasJS Example</title>
</head>

<body>
    <div id="chartContainer" style="height: 400px; width: 100%;"></div>
</body>

</html>
مخطط دائري مجوف ثلاثي الأبعاد
توضح التعليمات البرمجية HTML التالية عرض مخطط دائري مجوف ثلاثي الأبعاد مع بيانات التنبيه.
<html>

<head>
    <script src="https://ajax.googleapis.com/ajax/libs/jquery/3.2.1/jquery.min.js"></script>
    <script type="text/javascript">
        var criticalCounter = 0;
        var informationCounter = 0;
        var warningCounter = 0;

        window.onload = function () {
            $.ajax({
                url: "/OperationsManager/data/alert",
                type: "POST",
                data: JSON.stringify ({
                    "classId": null,
                    "objectIds": { "3c8ac4f3-475e-44dd-4163-8a97af363705": -1 },
                    "criteria": "((Severity = '0') OR (Severity = '1') OR (Severity = '2') OR (Severity = '3')) AND ((Priority = '2') OR (Priority = '1') OR (Priority = '0')) AND ((ResolutionState = '0') OR (ResolutionState = '247') OR (ResolutionState = '248') OR (ResolutionState = '249') OR (ResolutionState = '250') OR (ResolutionState = '254') OR (ResolutionState = '255'))",
                    "displayColumns":
                    [
                        "severity","monitoringobjectdisplayname","name","age","repeatcount","lastModified"
                    ]
                }),
                success: function (result) {
                    for (var i = 0; i < result.rows.length; i++) {
            switch(result.rows[i].severity)
            {
                case "Error":
                    criticalCounter++;
                    break;
                case "Information":
                    informationCounter++;
                    break;
                case "Warning":
                                    warningCounter++
                    break;
            }
                    }
                    renderChart();
                }
            });
        }

        function renderChart() {
            var chart = Highcharts.chart('container', {
    chart: {
        type: 'pie',
        options3d: {
            enabled: true,
            alpha: 45
        }
    },
    title: {
        text: 'Alerts representation in 3D donut'
    },
    subtitle: {
        text: ''
    },
    plotOptions: {
        pie: {
            innerSize: 100,
            depth: 45
        }
    },
    series: [{
        name: 'Number of alerts',
        data: [
        ['Critical', criticalCounter],
                                ['Warning', warningCounter ],
                                ['Information',  informationCounter]

        ]
    }]
});
            chart.render();
        }
    </script>
    <script src="https://code.highcharts.com/highcharts.js"></script>
<script src="https://code.highcharts.com/highcharts-3d.js"></script>
<script src="https://code.highcharts.com/modules/exporting.js"></script>

<div id="container" style="height: 400px">
</div>
</head>

<body>
    <div id="chartContainer" style="height: 400px; width: 100%;"></div>
</body>

</html>
مخطط تركيبي
توضح التعليمات البرمجية HTML التالية إنشاء مخطط تركيبي لعرض التنبيهات في مخطط دائري ومخطط خطي.
<html>

<head>
    <script src="https://ajax.googleapis.com/ajax/libs/jquery/3.2.1/jquery.min.js"></script>
    <script type="text/javascript">
        var criticalCounter = 0;
        var informationCounter = 0;
        var warningCounter = 0;
var totalCounter =0;

        window.onload = function () {
            $.ajax({
                url: "/OperationsManager/data/alert",
                type: "POST",
                data: JSON.stringify ({
                    "classId": null,
                    "objectIds": { "3c8ac4f3-475e-44dd-4163-8a97af363705": -1 },
                    "criteria": "((Severity = '0') OR (Severity = '1') OR (Severity = '2') OR (Severity = '3')) AND ((Priority = '2') OR (Priority = '1') OR (Priority = '0')) AND ((ResolutionState = '0') OR (ResolutionState = '247') OR (ResolutionState = '248') OR (ResolutionState = '249') OR (ResolutionState = '250') OR (ResolutionState = '254') OR (ResolutionState = '255'))",
                    "displayColumns":
                    [
                        "severity","monitoringobjectdisplayname","name","age","repeatcount","lastModified"
                    ]
                }),
                success: function (result) {
                    for (var i = 0; i < result.rows.length; i++) {
            switch(result.rows[i].severity)
            {
                case "Error":
                    criticalCounter++;
                    break;
                case "Information":
                    informationCounter++;
                    break;
                case "Warning":
                                    warningCounter++
                    break;
            }
                    }
                    renderChart();
                }
            });
        }

        function renderChart() {
            var chart = new Highcharts.chart('container', {
    title: {
        text: 'Alerts representation in combination chart'
    },
    xAxis: {
        categories: ['Critical', 'Warning', 'Information']
    },
    labels: {
        items: [{
            html: 'Total alerts generated',
            style: {
                left: '50px',
                top: '0px',
                color: (Highcharts.theme && Highcharts.theme.textColor) || 'black'
            }
        }]
    },
    series: [{
        type: 'column',
        name: 'Critical',
        data: [criticalCounter, 0, 0]
    }, {
        type: 'column',
        name: 'Warning',
        data: [0, warningCounter, 0]
    }, {
        type: 'column',
        name: 'Information',
        data: [0, 0, informationCounter]
    }, {
        type: 'spline',
        name: 'Spline chart',
        data: [criticalCounter, warningCounter, informationCounter],
        marker: {
            lineWidth: 2,
            lineColor: Highcharts.getOptions().colors[3],
            fillColor: 'white'
        }
    }, {
        type: 'pie',
        name: 'Total consumption',
        data: [{
            name: 'Critical',
            y: criticalCounter,
            color: Highcharts.getOptions().colors[0] // Jane's color
        }, {
            name: 'Warning',
            y: warningCounter,
            color: Highcharts.getOptions().colors[1] // John's color
        }, {
            name: 'Information',
            y: informationCounter,
            color: Highcharts.getOptions().colors[2] // Joe's color
        }],
        center: [150, 100],
        size: 100,
        showInLegend: false,
        dataLabels: {
            enabled: false
        }
    }]
});


            chart.render();
        }
    </script>
    <script src="https://code.highcharts.com/highcharts.js"></script>
<script src="https://code.highcharts.com/modules/exporting.js"></script>

<div id="container" style="min-width: 310px; height: 400px; margin: 0 auto"></div>

</head>

<body>
    <div id="chartContainer" style="height: 400px; width: 100%;"></div>
</body>

</html>