تمرين - تحديد الأجهزة ذات الاستخدام العالي لوحدة المعالجة المركزية
هنا، ستقوم بكتابة استعلامات KQL لاسترداد البيانات وتحويلها من Perf الجدول للحصول على فهم للآلات التي وصلت أو تقترب من سعة الحوسبة الإجمالية الخاصة بها، والأجهزة التي لا تستخدم بشكل كاف.
1. تعيين الأهداف
لمعالجة مشكلات الأداء، والتخفيف من المشكلات المحتملة، وتحديد الفرص للعمل بكفاءة أكبر، تريد تحليل استخدام وحدة المعالجة المركزية (CPU) للأجهزة الظاهرية في بيئة تكنولوجيا المعلومات الخاصة بك.
لتحديد مشكلات الأداء المتعلقة بالمعالج والفرص لتصبح أكثر كفاءة، تحتاج إلى معلومات حول:
- اتجاهات استخدام وحدة المعالجة المركزية لكل جهاز نشط.
- استخدام وحدة المعالجة المركزية للأجهزة في أوقات الذروة والهدوء.
2. تقييم السجلات
يرسل وكلاء Windows وLinux عدادات الأداء لمكونات الأجهزة وأنظمة التشغيل والتطبيقات التي تعمل على الأجهزة المراقبة إلى Perf الجدول في Azure Monitor.
لنقم بتشغيل استعلام بسيط على Perf الجدول لاسترداد السجلات من الساعات ال 24 الماضية والحصول على فكرة عن مخطط الجدول والبيانات التي يحتفظ بها الجدول:
انقر لتشغيل الاستعلام في بيئة العرض التوضيحي ل Log Analytics
Perf  // The table you’re querying
| where TimeGenerated > ago(1d) // Filters for entries generated in the past day

يمكنك أن ترى أن الأعمدة TimeGeneratedInstanceNameComputerObjectNameCounterNameCounterValue و تحتوي على بيانات ذات صلة بتحليلنا.
يسرد ObjectName العمود أسماء جميع الكائنات التي يجمع Azure Monitor البيانات من الأجهزة المراقبة لها. CounterName يحتوي العمود على أسماء عدادات الأداء المختلفة التي يجمعها Azure Monitor. يحتوي كلا العمودين على الكثير من القيم، يظهر العديد منها عدة مرات. لمشاهدة القيم المميزة في هذه الأعمدة بوضوح وتحديد العدادات ذات الصلة بالتحليل الحالي، دعنا نشغل هذا الاستعلام:
انقر لتشغيل الاستعلام في بيئة العرض التوضيحي ل Log Analytics
Perf // The table you’re querying
| distinct ObjectName,CounterName // Lists distinct combinations of ObjectName and CounterName values
تظهر لقطة الشاشة هذه المجموعات ObjectName CounterName والقيم المميزة CounterName في العمود في ال 24 ساعة الماضية:

يمنحك العداد % Processor Time فهما لاستخدام المعالج أو وحدة المعالجة المركزية (CPU). هذه هي المعلومات التي تحتاج إليها!
دعونا نقيم كيف يمكننا استخدام هذه البيانات، وعمليات KQL التي يمكن أن تساعد في استخراج البيانات وتحويلها:
| العمود | الوصف | هدف التحليل | عمليات KQL ذات الصلة |
|---|---|---|---|
TimeGenerated |
يشير إلى وقت إنشاء الجهاز الظاهري لكل سجل. | حدد النطاق الزمني للتحليل. | where TimeGenerated > ago(1d) لمزيد من المعلومات، راجع ago()، حيث عامل التشغيل، وعوامل التشغيل الرقمية. |
Computer |
الكمبيوتر الذي تم جمع الحدث منه. | إقران استخدام وحدة المعالجة المركزية بجهاز كمبيوتر معين. | summarize... by Computer لمزيد من المعلومات، راجع تلخيص عامل التشغيل. |
ObjectName |
يحمل أسماء كافة الكائنات التي يحتوي الجدول على بيانات الأداء لها. | مراقبة أداء المعالج. | where ObjectName == "Processor" لمزيد من المعلومات، راجع عامل التشغيل == (يساوي). |
CounterName |
يحمل أسماء جميع عدادات الأداء في الجدول. | % Processor Time مراقبة عداد الأداء. |
where CounterName == "% Processor Time" لمزيد من المعلومات، راجع مكان عامل التشغيل وعامل التشغيل == (يساوي). |
InstanceName |
يسرد المثيلات المراقبة للكائن المراقب. | مراقبة جميع نوى المعالج. | where InstanceName == "_Total" لمزيد من المعلومات، راجع مكان عامل التشغيل وعامل التشغيل == (يساوي). |
CounterValue |
القياس الذي تم جمعه للعداد. | استرداد قياسات الأداء لعداد % Processor Time الأداء. |
summarize min(CounterValue), avg(CounterValue), max(CounterValue), percentiles(CounterValue, 90,99) لمزيد من المعلومات، راجع عامل التلخيص، ودالات التجميع min()وmax()وavg()و percentiles(). |
3. كتابة الاستعلام
اكتب استعلاما يلخص متوسط الحد الأدنى والحد الأقصى لاستخدام وحدة المعالجة المركزية لجميع الأجهزة خلال اليوم الماضي.
استرداد جميع السجلات التي تم إنشاؤها في اليوم الماضي التي أبلغت عن
% Processor Timeعداد الأداء:انقر لتشغيل الاستعلام في بيئة العرض التوضيحي ل Log Analytics.
Perf  // The table you’re querying
| where TimeGenerated > ago(1d) and ObjectName == "Processor" and CounterName == "% Processor Time" and InstanceName == "_Total" // Filters for entries generated in the past day related to total processor time measurements
يسترد هذا الاستعلام جميع السجلات المتعلقة بإجمالي قياسات وقت المعالج من اليوم الماضي.

ابحث عن الحد الأدنى والحد الأقصى ومتوسط قيم العداد، واحسب قيم عداد النسبة المئوية 90 و99 لكل كمبيوتر:
انقر لتشغيل الاستعلام في بيئة العرض التوضيحي ل Log Analytics
Perf  // The table you’re querying
| where TimeGenerated > ago(1d) and ObjectName == "Processor" and CounterName == "% Processor Time" and InstanceName == "_Total" // Filters for entries generated in the past day related to total processor time measurements
| summarize min(CounterValue), avg(CounterValue), max(CounterValue), percentiles(CounterValue, 90,99) by Computer // Presents the minimum, maximum, average, 90th and 99th percentile counter values for each computer
تعرض مجموعة نتائج هذا الاستعلام قيم عداد النسبة
% Processor Timeالمئوية الدنيا والحد الأقصى والمتوسط والتسعين والتسعين لكل كمبيوتر توجد بيانات له في مساحة عمل Log Analytics.
تصفية نتائج الاستعلام للإدخالات حيث تكون قيمة العداد
% Processor Timeأعلى من 80 في النطاق المئوية 90 و99:انقر لتشغيل الاستعلام في بيئة العرض التوضيحي ل Log Analytics
Perf  // The table you’re querying
| where TimeGenerated > ago(1d) and ObjectName == "Processor" and CounterName == "% Processor Time" and InstanceName == "_Total" // Filters for entries generated in the past day related to total processor time measurements
| summarize min(CounterValue), avg(CounterValue), max(CounterValue), percentiles(CounterValue, 90,99) by Computer // Presents the minimum, maximum, average, 90th and 99th percentile counter values for each computer
| where percentile_CounterValue_90 > 80 and percentile_CounterValue_99 > 80 // Filters previous query results for instances where the 90th and 99th percentile counters are higher than 80
تتكون مجموعة نتائج هذا الاستعلام من جميع أجهزة الكمبيوتر التي تزيد قيمها عن 10٪ و15٪
% Processor Timeعلى 80.


التحدي: إضافة معلومات نظام التشغيل من جدول Heartbeat إلى نتائج الاستعلام
يمكنك غالبا فهم نتائج الاستعلام بشكل أفضل عن طريق ربط المعلومات من جدول مختلف بنتائج الاستعلام باستخدام join عامل التشغيل . لمزيد من المعلومات، راجع عامل تشغيل الانضمام.
هل يمكنك استخدام join عامل التشغيل لإضافة معلومات حول نظام التشغيل الذي يعمل على كل كمبيوتر، والذي يتوفر في Heartbeat الجدول، كما رأينا في التمرين الأول؟
الحل:
أضف معلومات من
Heartbeatالجدول حول نظام التشغيل الذي يعمل على كل جهاز من أجهزة الكمبيوتر في نتائج الاستعلام:انقر لتشغيل الاستعلام في بيئة العرض التوضيحي ل Log Analytics
Perf  // The table you’re querying
| where TimeGenerated > ago(1d) and ObjectName == "Processor" and CounterName == "% Processor Time" and InstanceName == "_Total" // Filters for entries generated in the past day related to total processor time measurements
| summarize min(CounterValue), avg(CounterValue), max(CounterValue), percentiles(CounterValue, 90,99) by Computer // Presents the minimum, maximum, average, 90th and 99th percentile counter values for each computer
| where percentile_CounterValue_90 > 80 and percentile_CounterValue_99 > 80 // Filters previous query results for instances where the 90th and 99th percentile counters are higher than 50
| join kind=inner (Heartbeat // Introduces data from the "Heartbeat" table to the previous query results
| where TimeGenerated > ago(1d) // Time range for the data added from the "Heartbeat" table
| distinct Computer, OSType) on Computer // Adds distinct combinations of computer and operating system
يضيف تكرار الاستعلام هذا العمودين
ComputerوOSTypeمنHeartbeatالجدول إلى نتائج الاستعلام السابقة.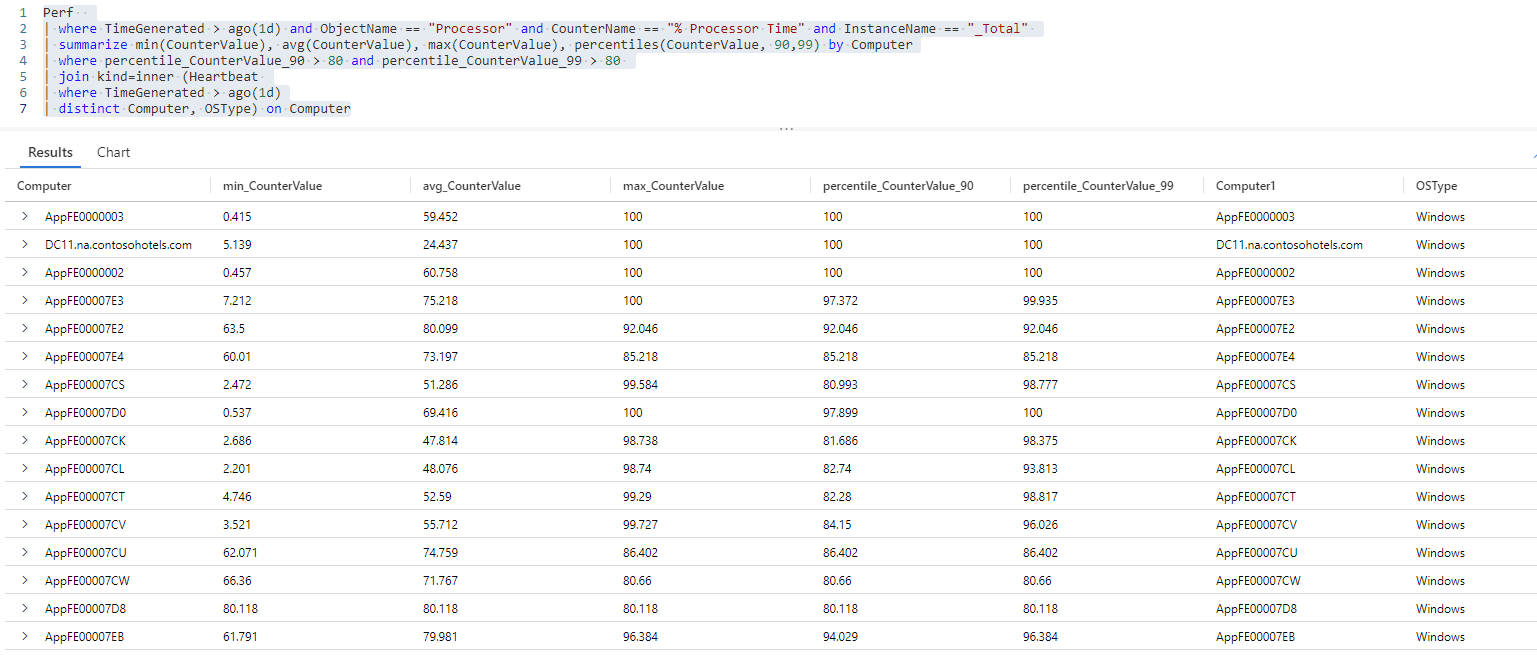
Computerيظهر العمود الآن مرتين في نتائج الاستعلام - مرة من الاستعلام علىPerfالجدول ومرة من الاستعلام علىHeartbeatالجدول.Computerتمت إعادة تسميةComputer1العمود منHeartbeatالجدول ، ولكن الجدولين يحتويان على بيانات متطابقة. يتيح وجود كلا العمودين ربط النتائج من الجدولين، ولكن يمكنك الآن تصفية العمود المكرر.Computer1إزالة العمود من نتائج الاستعلام:انقر لتشغيل الاستعلام في بيئة العرض التوضيحي ل Log Analytics
Perf  // The table you’re querying
| where TimeGenerated > ago(1d) and ObjectName == "Processor" and CounterName == "% Processor Time" and InstanceName == "_Total" // Filters for entries generated in the past day related to total processor time measurements
| summarize min(CounterValue), avg(CounterValue), max(CounterValue), percentiles(CounterValue, 90,99) by Computer // Presents the minimum, maximum, average, 90th and 99th percentile counter values for each computer
| where percentile_CounterValue_90 > 80 and percentile_CounterValue_99 > 80 // Filters previous query results for instances where the 90th and 99th percentile counters are higher than 50
| join kind=inner (Heartbeat // Introduces data from the "Heartbeat" table to the previous query results
| where TimeGenerated > ago(1d) // Time range for the data added from the "Heartbeat" table
| distinct Computer, OSType) on Computer // Adds distinct combinations of computer and operating system
| project-away Computer1 // Removes the "Computer1" column from the query results
تسرد مجموعة نتائج هذا الاستعلام جميع أجهزة الكمبيوتر التي وصلت إلى سعة وحدة المعالجة المركزية الكاملة ونظام التشغيل الذي يعمل على كل كمبيوتر، والتي ستكون مفيدة لمزيد من التحليل.


