 Visual Studio 2022 Preview release notes
We're excited to announce the availability of Visual Studio 2022 v17.12. This update focuses on providing fantastic developer experiences for working with .NET 9 projects and new AI productivity features, along with continuous improvements all-around.
Features
All the new features in the latest preview release.
Productivity
Copy from the Error List 📣
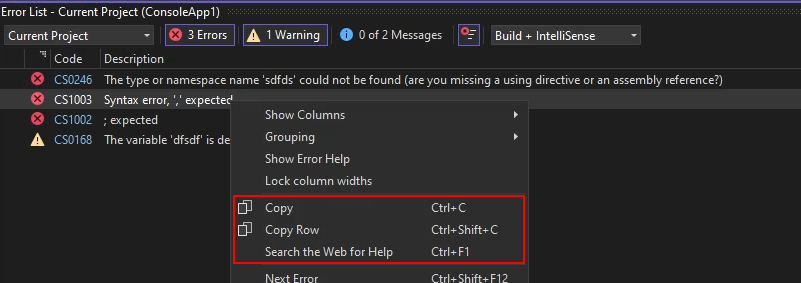
You see an error in the Error List that you don't know how to fix. So, you select it and hit
Ctrl+Cto copy the description for a web search. After you've pasted it into the search engine, you realize it copied all column headers and row values instead of just the description. Now you must delete everything except the error description before you can perform the web search. This is cumbersome, but now we have a fix!
When you copy an error from the Error List using
Ctrl+C, only the description is copied to the clipboard. This makes it easier to search for the error online or share it with others.You can still copy the entire row by right-clicking the error and selecting Copy Row from the context menu or hitting
Ctrl+Shift+C.If what you wanted to do with the error description was to do a web search, then just hit
Ctrl+F1to search for information about the error online.📣 See feature ticket to share your feedback and continue the conversation.
Go to line anywhere in Code Search 📣
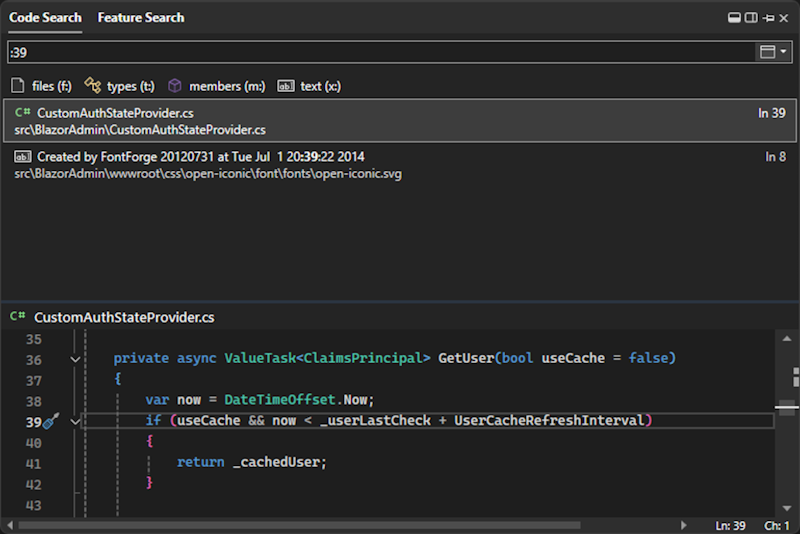
Sometimes you know that there's an issue on a certain line in your code and you want to get to it quickly. Maybe you were told about an error being thrown on line 43 of some file, or you want to get to the bottom of a specific file.
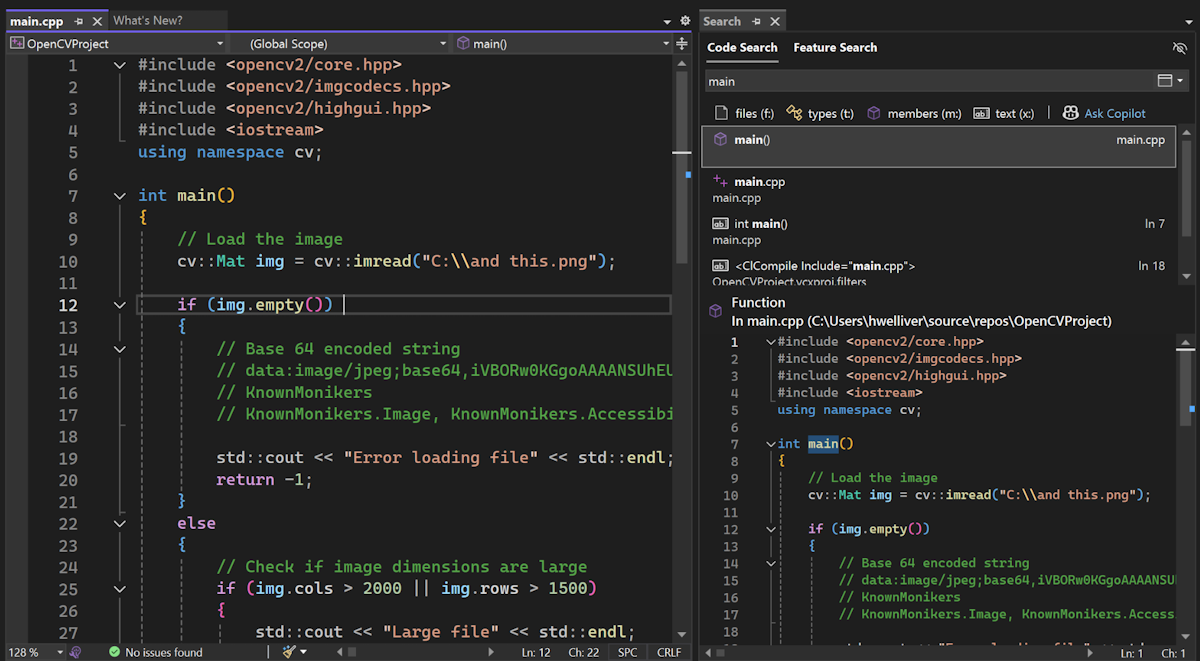
Code Search now supports quick navigation to a specific line in your code.
Open Code Search and go to a line in the current document by using colon + line number. For example,
:39will navigate to line 39 in the active file.
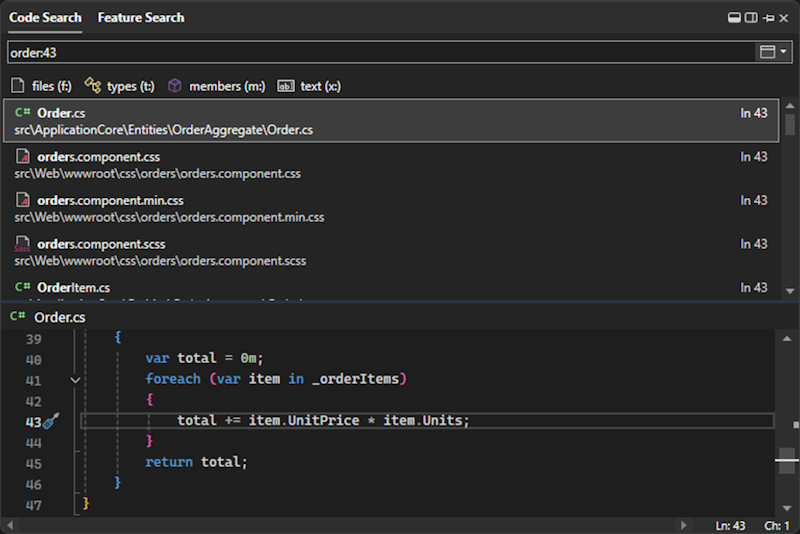
You can also go to a line in a different document by using file name + colon + line number. For example,
Order:43will navigate to line 43 in Order.cs. If you don't specify the exact file name, then the search will try to find the best match.
📣 See feature ticket to share your feedback and continue the conversation.
Dock the Code Search window 📣
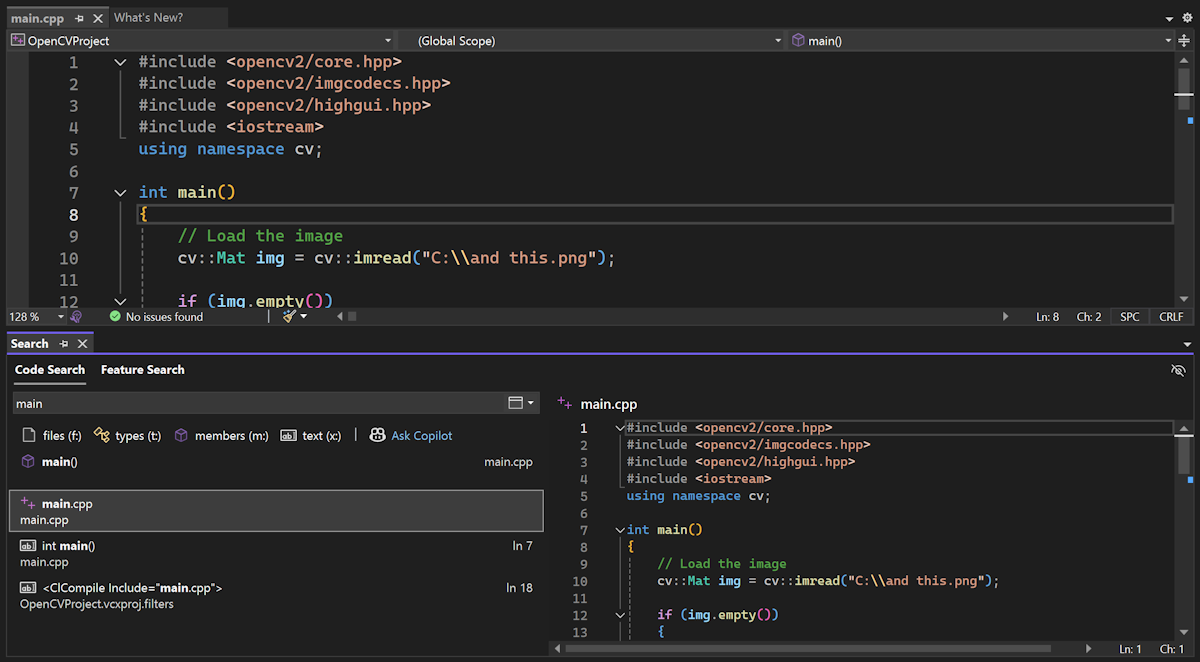
If you need Code or Feature Search to stay out of your way, you now have more control over the behavior of the search window.
You can now dock the search window and perform tool window actions with it, like Solution Explorer and others.
After opening Code Search or Feature Search, click on the box icon at the top right to convert it into a tool window. You may choose to dock it elsewhere, pop it out, auto-hide, etc. You can revert to the dismissible window by closing the tool window and reopening search.
We've also simplified and cleaned up the previewing experience in search. There is now one button, indicated with an eye icon, to toggle the preview on and off.
The position of the preview panel will also adjust based on the dimensions of the search window.
📣 See feature ticket to share your feedback and continue the conversation.
Customize collapsed text indicator 📣
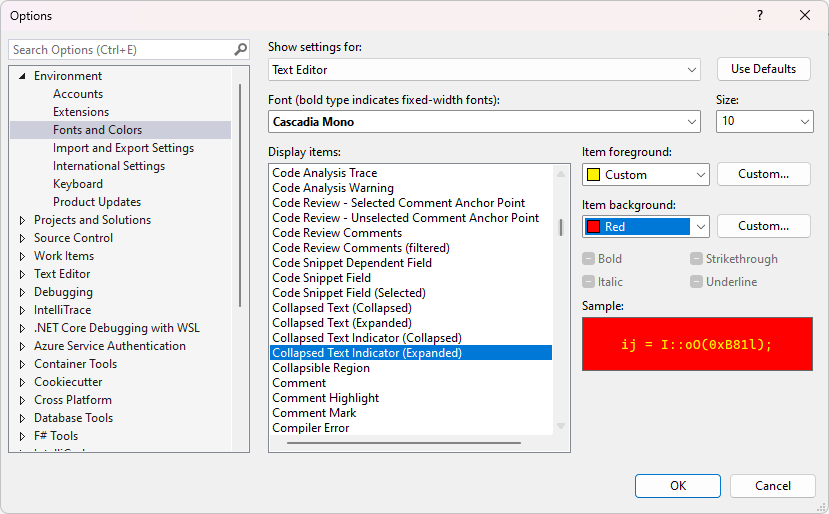
You can now customize your editor experience even further with new options for customizing the collapsed text indicator:
To try it out and set custom foreground and background colors for each, navigate to Tools > Options > Environment > Fonts and Colors.
There, you'll find two new items for customization:
- Collapsed Text Indicator (Collapsed)
- Collapsed Text Indicator (Expanded)
You can set the colors for the collapsed and expanded indicators independently from one another using predefined colors or custom colors of your choosing.
📣 See feature ticket to share your feedback and continue the conversation.
Refresh your Find results 📣
We heard from a lot of users that it's frustrating having to reopen the Find window and go through the motions of redoing a search to get updated results. Maybe you just refactored some code and want to confirm everything has been changed as expected, or you pulled some recent changes and need your recent Find operation to reflect those updates.
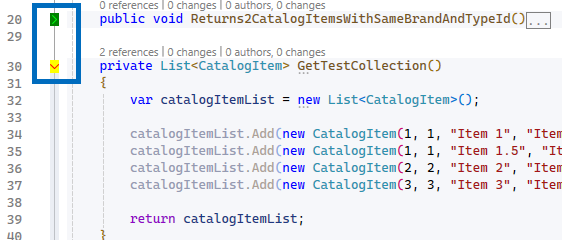
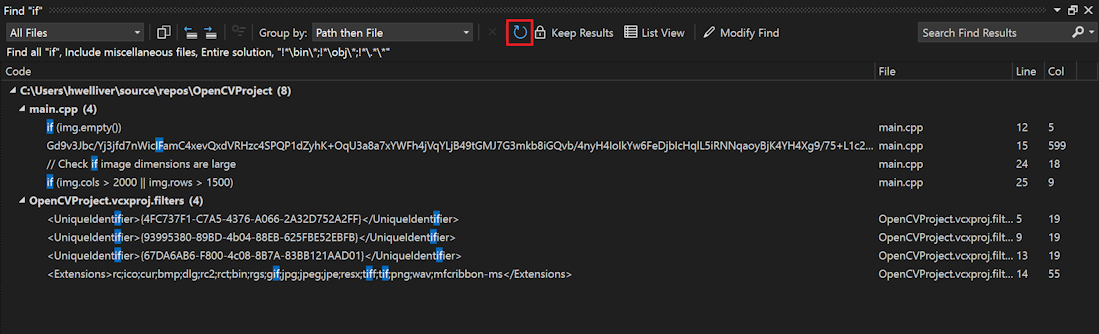
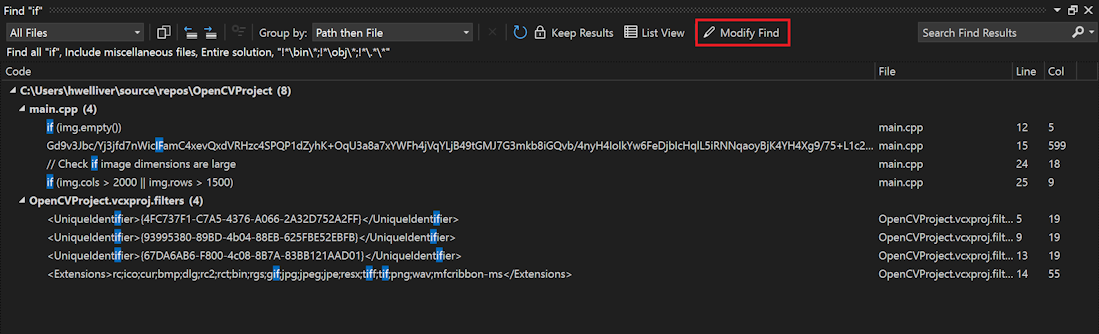
After completing Find in Files, you will now have the option to Refresh the Find results in the window. You'll get your updated results without having to redo the search.
We've also redesigned the former Repeat Find option to distinguish it from Refresh. It is now represented as Modify Find with a pencil icon. This button will still reopen Find in Files with the same search criteria you used for that results window.
📣 See feature ticket to share your feedback and continue the conversation.
More space for horizontal scrollbar 📣
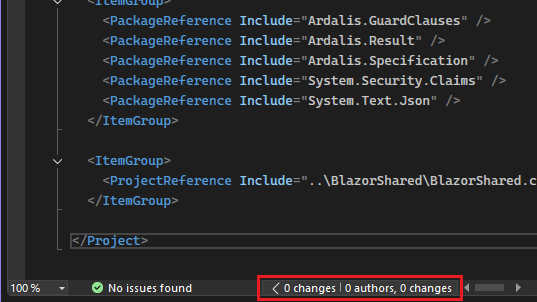
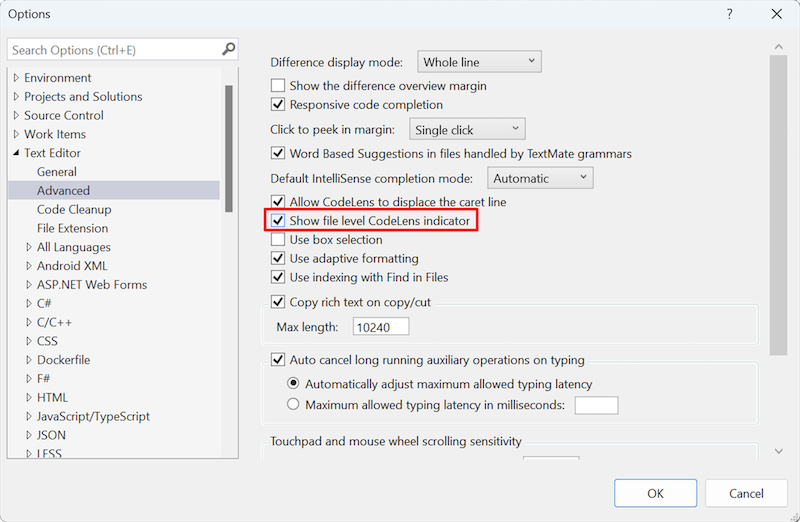
The area with the horizontal scrollbar can get pretty cluttered up in Visual Studio. We're helping make it easier to clean it up by turning off the file level indicators in CodeLens by default.
If you do want the option on, you can find the Show file level CodeLens indicator option under Tools > Options > Text Editor > Advanced. This option affects visibility for file types that have the file level CodeLens control in the bottom editor margin such as XAML, HTML, and CSS, and does not affect files that contain inline CodeLens.
📣 See feature ticket to share your feedback and continue the conversation.
Non-blocking Code Cleanup on save
Previously when a Code Cleanup is run on Save, you can't perform any actions in the IDE. We've now enhanced this to operate in a non-blocking manner.
The cleanup process will run in the background and can be automatically canceled if you resume typing, ensuring a smoother and more responsive coding experience.
GitHub Copilot
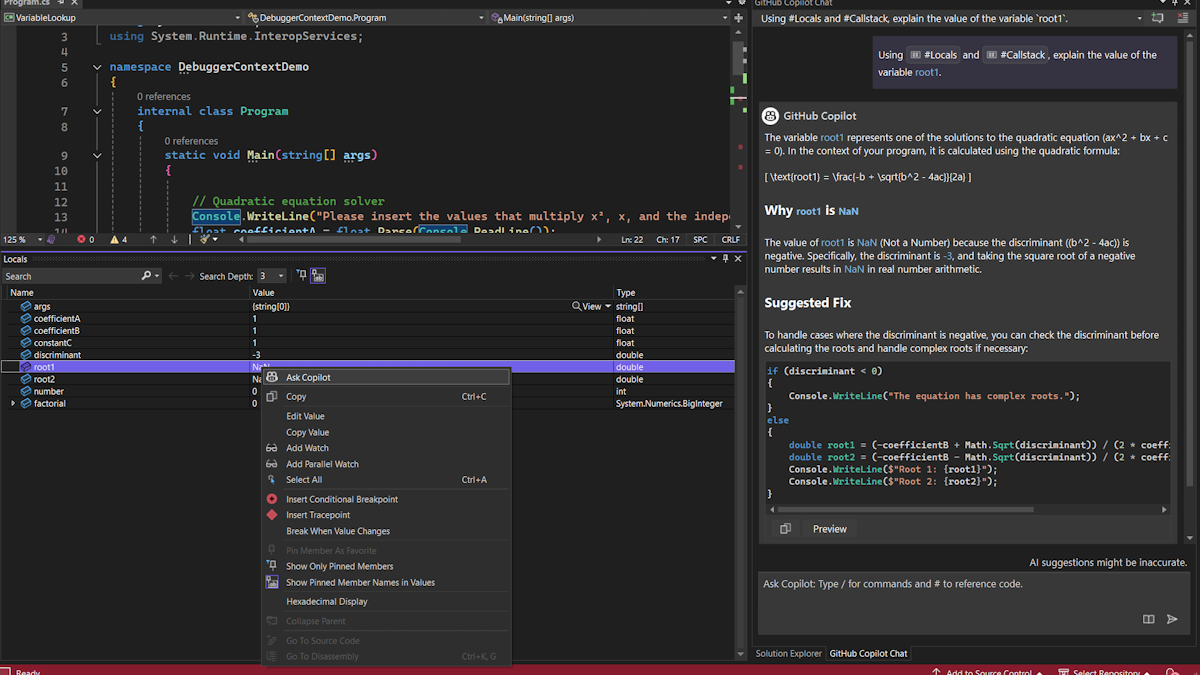
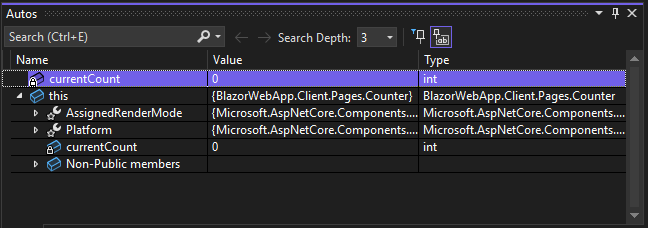
AI smart variable inspection
Inspecting and analyzing values from Locals, Autos, and DataTips has never been easier with Ask GitHub Copilot in Visual Studio. Simply right-click on any value to get detailed AI-driven insights on errors, unexpected outcomes, or anomalies - all without ever leaving your IDE.
This feature will significantly enhance your troubleshooting speed by analyzing variables in real-time within your IDE whenever unexpected values arise.
Important
To use this feature, make sure to activate GitHub Copilot
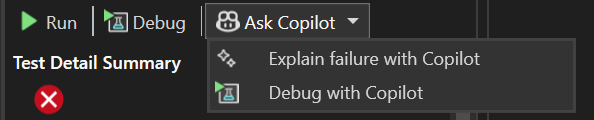
Debug tests with GitHub Copilot
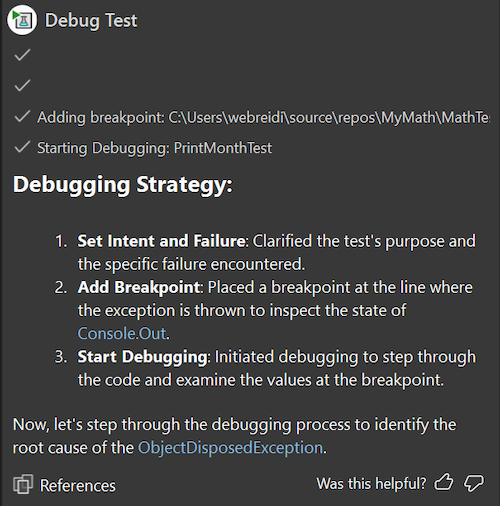
Need help debugging your failing unit tests. Now GitHub Copilot can help by providing you with a debug plan and guiding you through debugging the failed test to get you closer to passing by clicking on the Debug with Copilot button in Test Explorer.
Once you launch the feature, GitHub Copilot will provide you with a debug plan, set appropriate breakpoints and watch variables and launch the debug session. When it hits the breakpoint, it provides GitHub Copilot with values for the watched variables and determines your next step, continue debugging or fix the problem code. You can continue with this converation until you have a passing test.
Important
To use this feature, make sure to activate GitHub Copilot
AI-Powered IEnumerable Visualizer
We have enhanced the editable expression feature in the IEnumerable visualizer with AI assistance. The new Ask Copilot feature allows users to leverage AI directly within the editable expression textbox to craft complex LINQ expressions.
To access the GitHub Copilot chat, simply click the GitHub Copilot icon located in the bottom right corner of the editable expression section. In the chat, you'll find sample LINQ syntax examples. Additionally, you can describe your query in natural language, and GitHub Copilot will generate the corresponding LINQ query. To apply LINQ query filtering to the visualizer, use the Show in Visualizer button in the chat.
It provides instant feedback and guidance, making the process of creating complex filters and transformations more intuitive and efficient.
Important
To use this feature, make sure to activate GitHub Copilot
Debugging & diagnostics
Blazor WebAssembly debugging 📣
Visual Studio now offers an improved debugging experience for Blazor WebAssembly apps targeting .NET 9 or later:
- Data types shown in the debugger now match the expected .NET data types.
- Type members and member visibility use expected icons.
- The displayed call stack is cleaned up to only shows the .NET call stack and correctly honors the Just My Code setting.
- The modules window is now supported.
- Expression evaluation support in the Immediate window and for watches and conditional breakpoints is expanded and improved.
To enable the new preview debugging experience:
- Enable the Enable new .NET 9+ Mono debugger setting.
- Install the latest .NET 9 SDK.
- Update your Blazor app to target .NET 9.
📣 See feature ticket to share your feedback and continue the conversation.
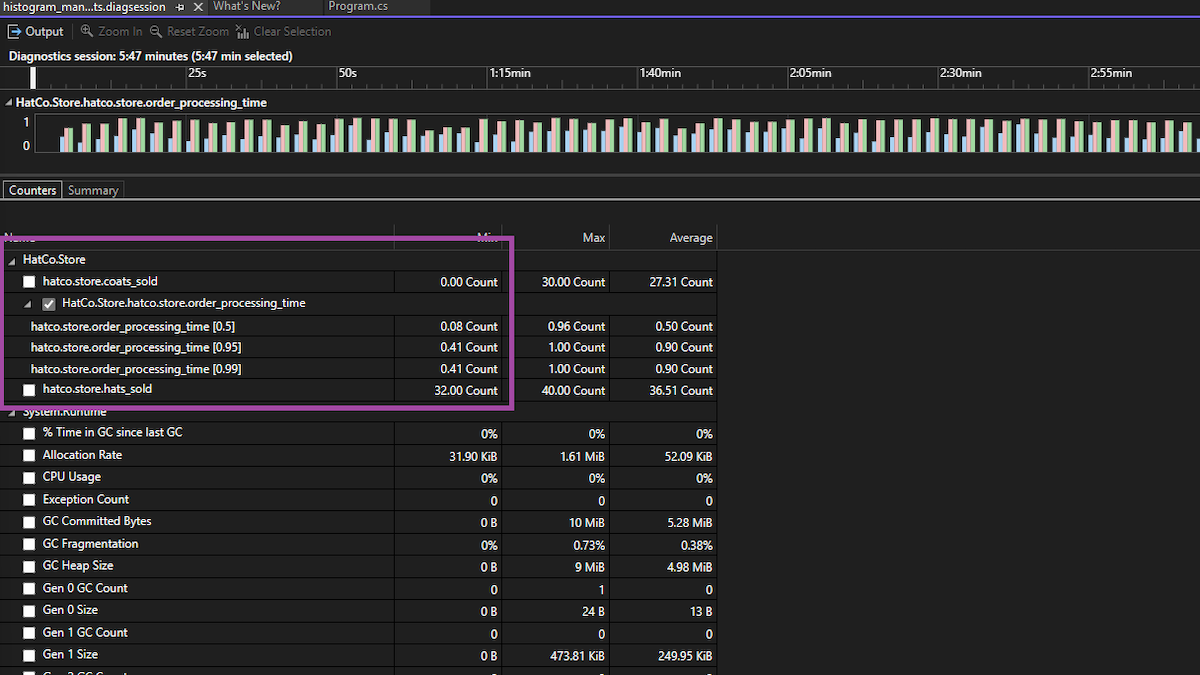
Meter Histogram in Profiler Counter Tool
The recent enhancement to Visual Studio's performance profiling suite introduces the Meter Histogram feature. This tool allows you to identify and analyze histogram data generated by histogram instruments. When recording data from these instruments, the histogram results are visualized, providing a clear representation of data distribution.
Additionally, the swimlane graph offers a detailed, segmented view of performance metrics, enhancing your ability to pinpoint and address performance issues effectively.
Git tooling
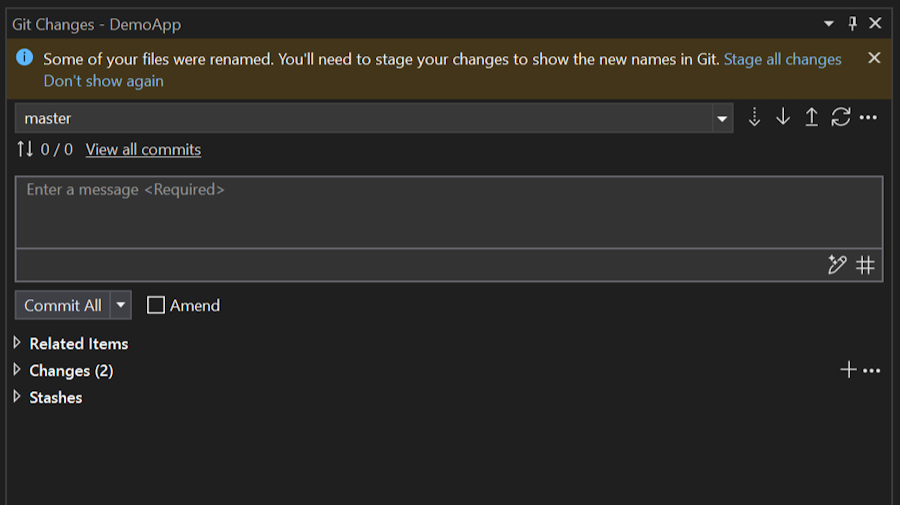
Manage file renaming with Git 📣
When you rename files from solution explorer, you'll be reminded to stage your changes to see the renames in Git. This boosts your confidence that Git is recognizing your file change and tracking it correctly. We found this to be a point of confusion for many customers, so we worked with folks in the Developer Community to produce a new notification.
📣 See feature ticket to share your feedback and continue the conversation.
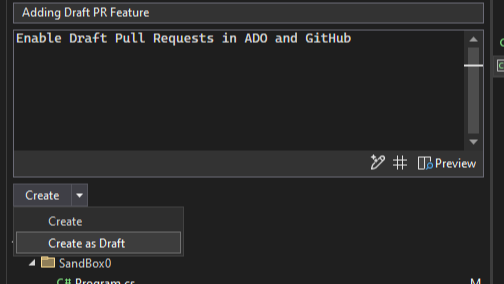
Pull requests using drafts and templates 📣
You can now create pull request drafts and start your descriptions with GitHub templates in Visual Studio. These were the two top requests for the create a pull request experience.
Draft PRs
Use the drop-down menu on the Create button to Create as Draft.
PR Templates
Your default PR template will be used when creating a new PR for both GitHub and Azure DevOps. Learn more about how to add a PR template to your repository in the GitHub documentation and Azure DevOps documentation.
📣 See feature ticket to share your feedback and continue the conversation. And take this survey to help make the feature even better.
Note
This feature must be enabled under Tools -> Manage Preview Features
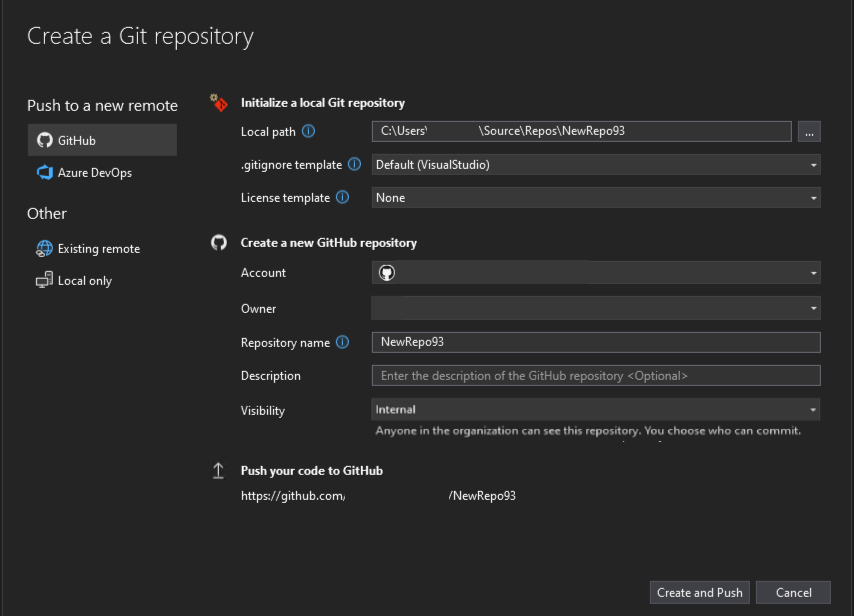
Create internal GitHub repos 📣
Visual Studio now supports internal repos for your GitHub organizations. We also included guidance for each type of repository to give you more clarity on the visibility of the new project depending on which account you're using.
📣 See feature ticket to share your feedback and continue the conversation.
Copy Git link 📣
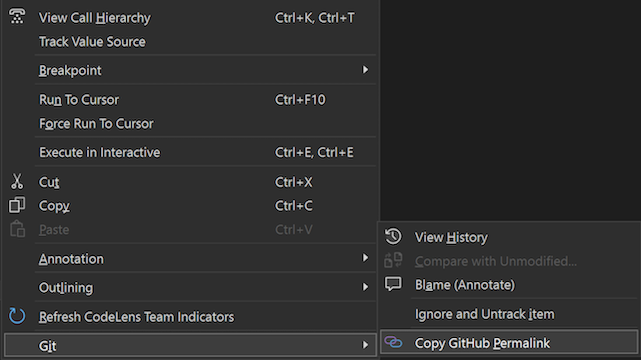
Whenever you share a few lines of code with a colleague, it can often be useful for them to get extra context from your repository. However, if they're working on something else it can take too long and disrupt their work to checkout your branch.
Now, you can highlight the code you want to share in your editor, open the context menu with a right click, and under the Git submenu get a shareable link to your code in GitHub or Azure DevOps. This makes it simple and easy to collaborate, and it smooths the flow between the IDE and your remote repos on the web.
📣 See feature ticket to share your feedback and continue the conversation.
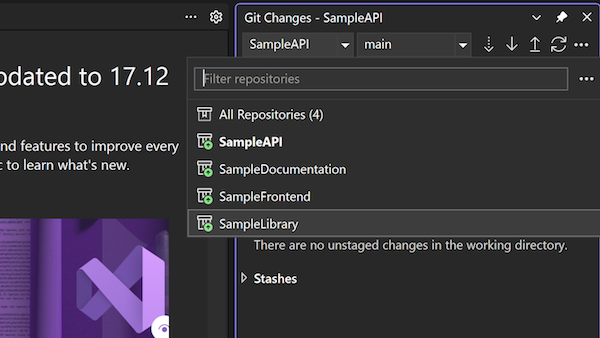
Multi-repo for GitHub and Azure DevOps 📣
You can now create pull requests and link work items in multi-repo scenarios. For both GitHub and Azure DevOps, we support your integrations when you use the repository picker to focus on a particular repository in your multi-repo scenarios.
📣 See feature ticket to share your feedback and continue the conversation.
IDE
Multi-Project Launch Configuration 📣
The Multi-Project Launch Configuration feature allows you to set up and save profiles for launching specific projects within a multi-project solution in predefined states for debugging.
This simplifies the process of working with complex solutions, improves debugging efficiency, and enables easy sharing of configurations among team members.
📣 See feature ticket to share your feedback and continue the conversation.
Note
This feature must be enabled under Tools -> Manage Preview Features
MotW security warnings
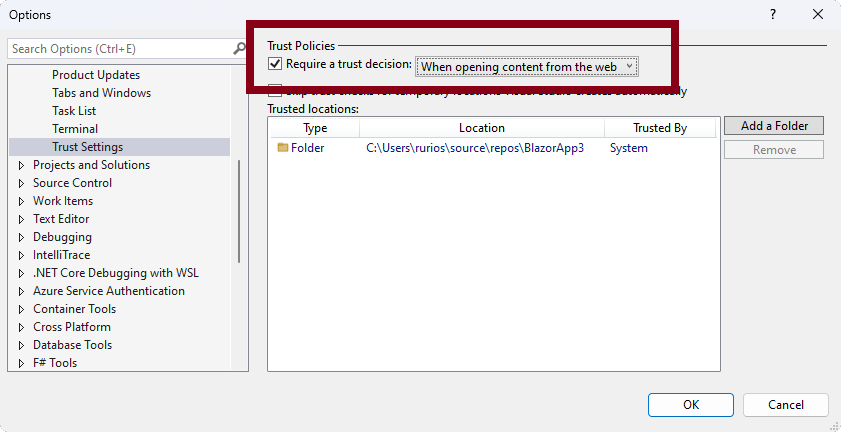
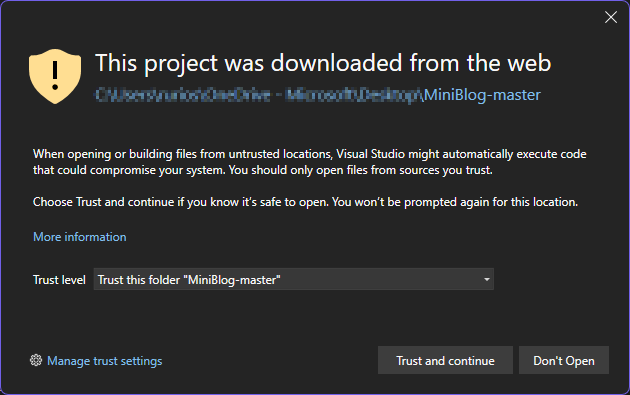
Visual Studio will show a security warning when it detects that you're attempting to open content tagged with the Mark of the Web (MotW) identifier.
This new trust-related warning conveys the risks of opening content from potentially unsafe sources like internet downloads.
You can modify the default trust experience by going to the Trust Settings under Tools > Options > Environment.
Preserve font across theme changes 📣
We understand that the fonts developers select when coding is a personal choice, influenced by preferences for readability, accessibility, or aesthetics. Visual Studio themes primarily focus on presentation colors and are independent of your preferred fonts.
With this update, we've introduced functionality to retain your font face and size choices when switching themes. You can now set your font preferences once and switch themes in Visual Studio without needing to reconfigure your font settings every time. Note that the colors of your fonts remain linked to the theme, as that is the purpose of themes, but your font selections will be preserved.
This feature will be enabled by default for all users. If you prefer the previous behavior, go to Tools > Manage Preview Features and find the option Separate font settings from color theme selection. If this option is checked, your font preferences will be maintained regardless of theme changes. Uncheck the box to reinstate the previous behavior which ties font choices to theme.
📣 See feature ticket to share your feedback and continue the conversation.
New Teams Toolkit AI bot templates
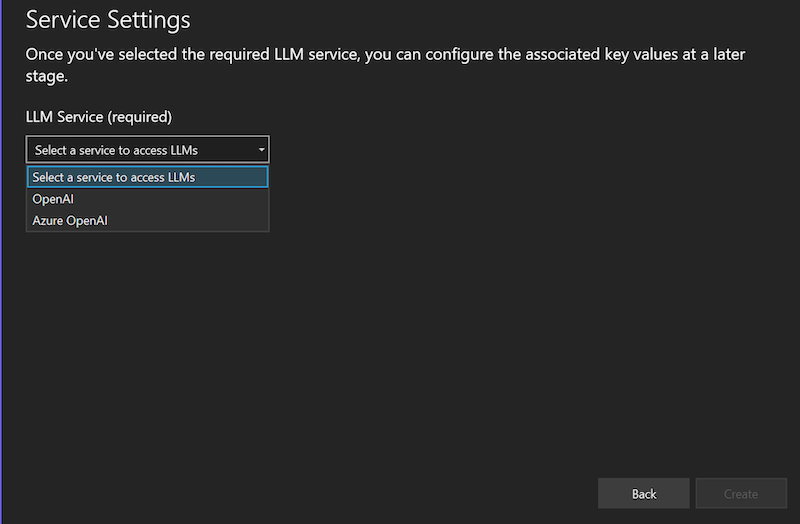
Teams Toolkit updated two Teams AI Bot templates:
The AI ChatBot template has been updated to enable developers to connect either Azure OpenAI service or Open AI service as LLM backend.
The AI ChatBot template and AI assistant Bot template (Preview) have been updated with the latest Teams AI library v1.5.*.
Cloud
Azure App Service publish security updates
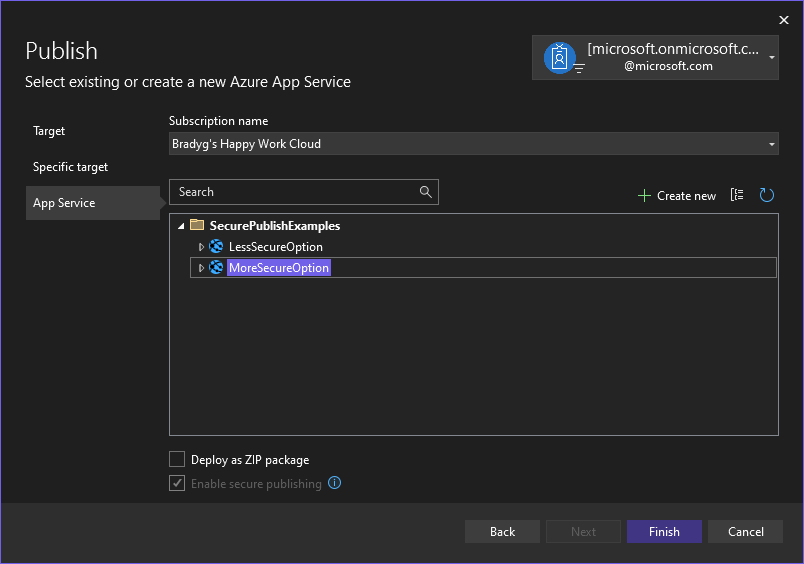
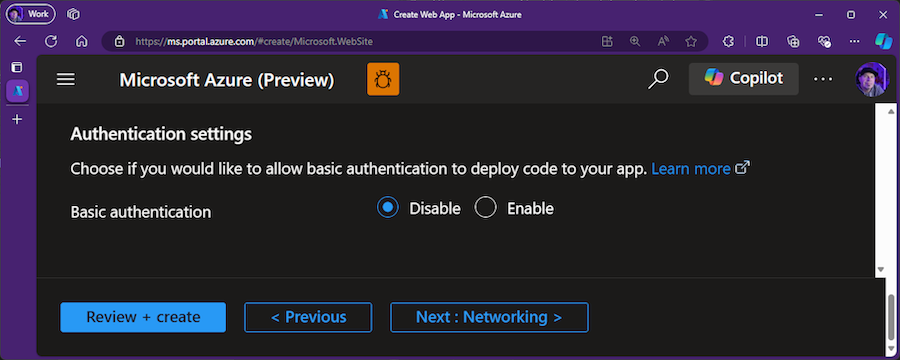
Azure App Service's publishing guidance advises customers to disable Basic Authentication and enable publishing via integrated authentication.
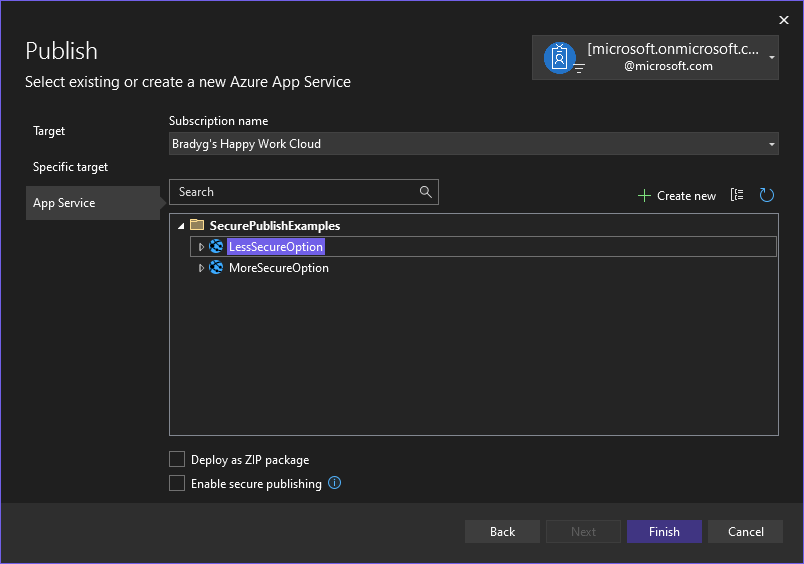
We've shipped updates to the right-click publish features in Visual Studio that adhere to this guidance by default. When you publish to Azure App Service, you'll now see a new option to use Enable secure publishing. This option will disable Basic Authentication and enable integrated security for publishing.
Toggling this option will update your Azure App Service settings to use integrated security for publishing. Once enabled with this option, you won't be able to revert to Basic Authentication from within Visual Studio, as we're defaulting to the more secure option to provide customers with the most secure publishing experience possible.
Desktop
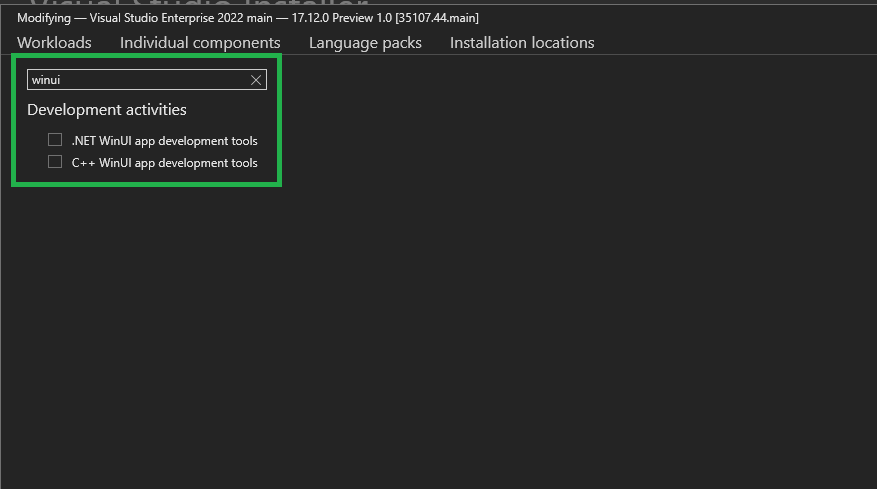
Enhanced WinUI components search
Streamline your WinUI project setup further with our latest Visual Studio installer update! Developers can now quickly locate WinUI-related components, eliminating the previous frustration of navigating through an empty search result. This enhancement simplifies the development environment configuration, allowing for a more intuitive and efficient user experience.
Open the Visual Studio Installer, go to individual components tab and search for WinUI related keywords (WinUI, WinRT)!
Web
Request variables in HTTP files 📣
When working with HTTP files, a common scenario is calling an endpoint, taking a value from the response, and sending in a subsequent request. For example, you may call an endpoint to authenticate a user and then on later calls you can pass the token that was returned from the login endpoint. Prior to this release this was not possible in Visual Studio. In the snippet below you can see an example of how this works in an HTTP file.
# @name login
POST {{TodoApi_HostAddress}}/users/token
Content-Type: application/json

{
  "username": "{{myusername}}",
  "password": "{{mypassword}}"
}

###

GET {{TodoApi_HostAddress}}/todos
Authorization: Bearer {{login.response.body.$.token}}

###
In the above snippet there are two requests, the first calling into the
/users/tokenendpoint to authenticate the user. Immediately above the request line, you'll see the comment# @name login. This syntax gives the request a name (loginin this case) and configures it as a Request Variable. When the request is sent you can access values from the response, or request, in any future request that is sent from that HTTP file. Since this is a request to login, you should be careful to secure your secrets. In Visual Studio we have support for accessing secrets in a secure manner. See this section on the docs for more info on handling secrets.The second request calls into an authenticated endpoint,
/todos, which will return thetodoitems for that user. In the request the token is passed in as a header with the line.Authorization: Bearer {{login.response.body.$.token}}The
/users/tokenendpoint returns a response in JSON. The token is extracted with a JSON Path expression,$.token, on the body of the response. If you are using an endpoint that returns XML, instead of a JSON Path expression you can pass in an XPath expression. The support in Visual Studio has been inspired by the existing OSS extension for REST Client that is available for Visual Studio Code. You can learn more about Request Variables there. We will be adding documentation soon to discuss this support in much more detail.📣 See feature ticket to share your feedback and continue the conversation.
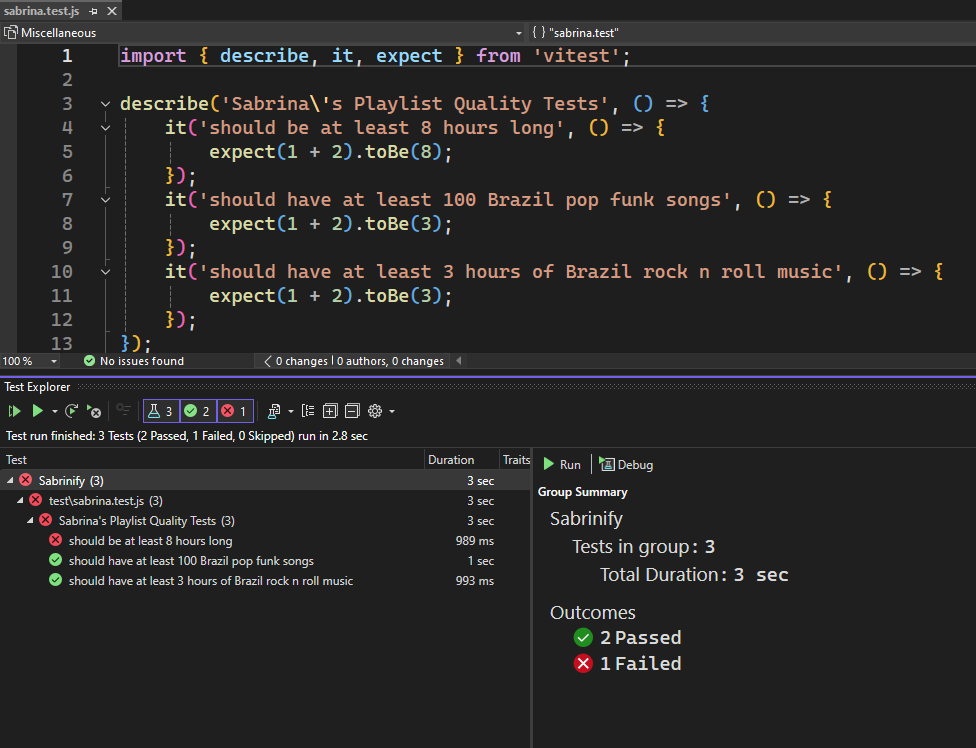
Vitest support in JavaScript and TypeScript 📣
In JavaScript and TypeScript projects (JSTS), projects that have the extension .esproj, we have added support to discover and run tests authored with Vitest. To get started with Vitest tests, in a JSTS project add the vitest package using the npm in the Solution Explorer and then modify the project file to have the following properties declared.
    <JavaScriptTestRoot>test\</JavaScriptTestRoot>
    <JavaScriptTestFramework>Vitest</JavaScriptTestFramework>
Ensure that the value for
JavaScriptTestRoothas the correct relative path to where your test files are located.Add your tests to the correct folder and build the project/solution. After that, you should see the test cases in the Test Explorer.
In the Test Explorer you can see the different test cases that are discovered and execute the test cases.
We have not yet added support for debugging, but we will be adding that support soon. Another known issue is when you double click on a test case in Test Explorer, it will take you to the first line of the file where the test case is defined. We will be improving this experience as well.
📣 See feature ticket to share your feedback and continue the conversation.
Inlay Hints support for more languages 📣
Inlay hints show additional information about source code that is rendered inline. This is usually used to show inferred types, parameter names, and other implicit information from your code directly in your editor.
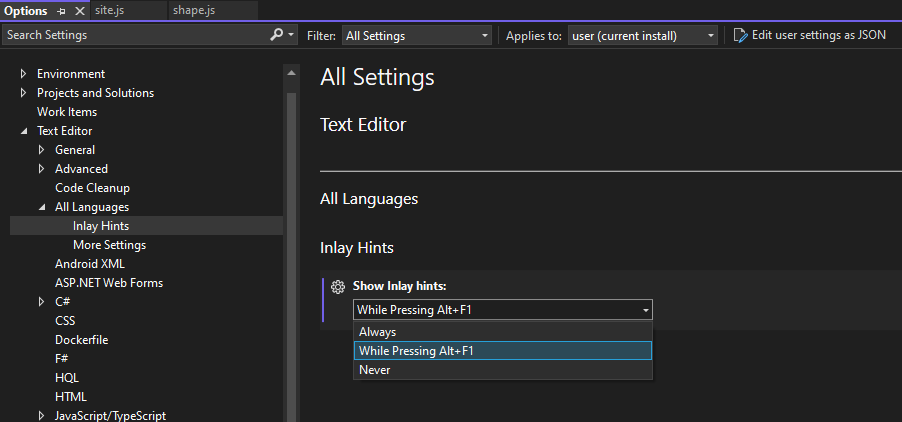
We have added support to show Inlay Hints in JavaScript, TypeScript, Razor, and Python. We have also added a new setting so that you can customize the behavior of hints across these languages. This setting doesn't apply to C# and C++ yet. To enable Inlay Hints for these languages you can use the new setting at Tools > Options > Text Editor > All Languages > Inlay Hints. You can see the new option in the following image.
There are three different values for Inlay Hints.
- Always: Always show the Inlay Hints.
- While Pressing
Alt+F1: Only shows Inlay Hints while Alt and F1 are pressed. This is the default value.- Never: Inlay Hints are never shown.
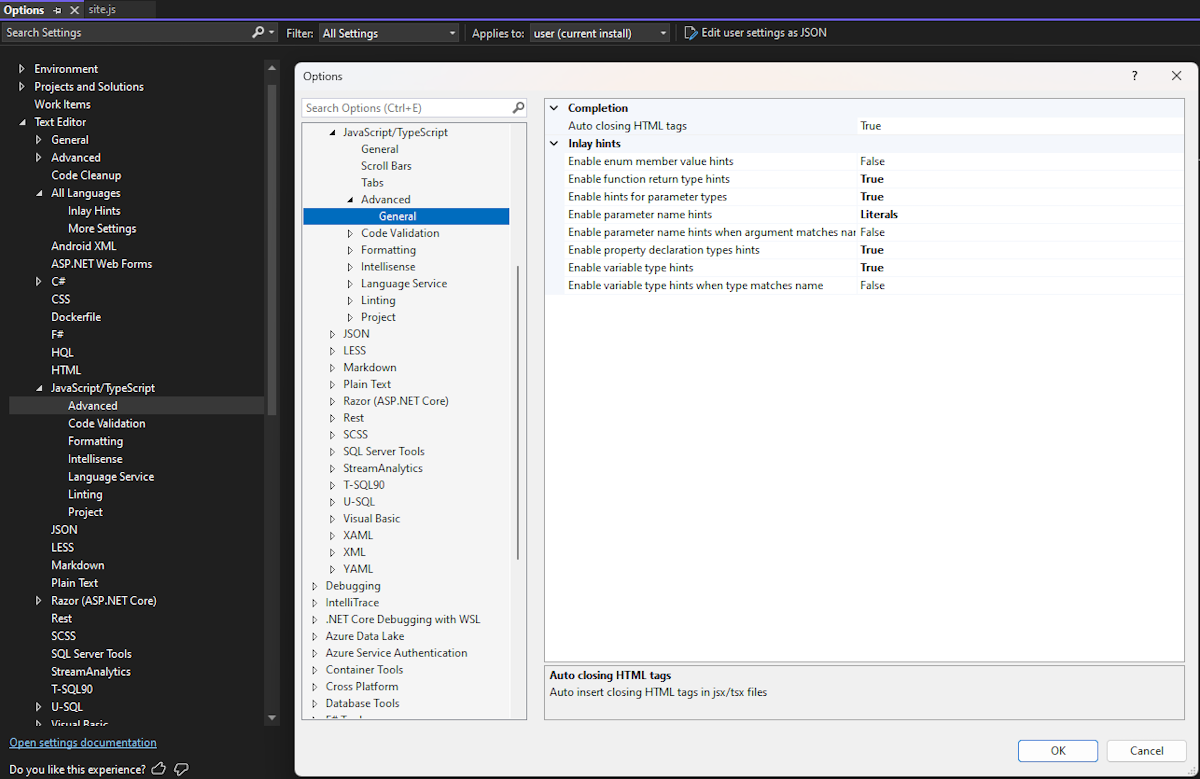
For JavaScript and TypeScript, there is an additional options page to configure the behavior of Inlay Hints. This can be found at Tools > Options > Text Editor > JavaScript/TypeScript > Advanced > General.
Those options are shown in the image that follows.
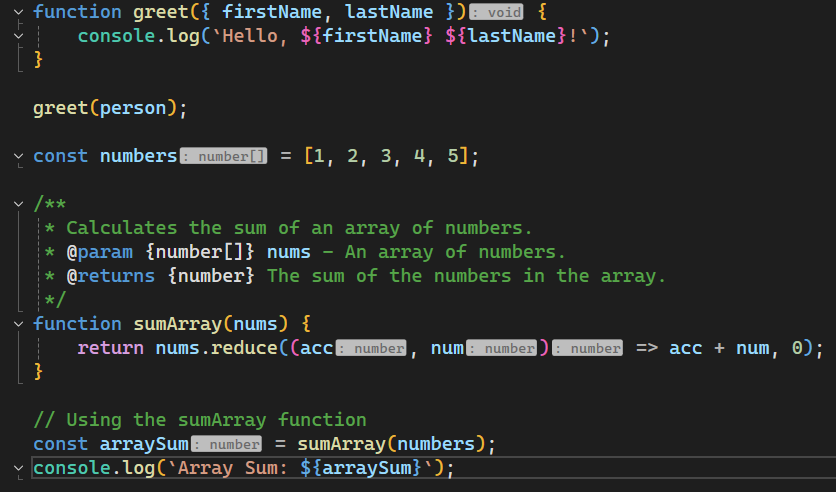
By default, all these options are disabled, you should enable the hints that you are interested in viewing for JavaScript and TypeScript files. In a future update we may change the default values for these options. In the image below you can see a JavaScript file that shows Inlay Hints.
In the previous image the Inlay Hints that are shown are the gray boxes with
: numberto indicate the type of the variable.📣 See feature ticket to share your feedback and continue the conversation.
HTTP files shared environment 📣
When using HTTP files in Visual Studio you can define environments so that you can create different settings for API testing. Previously, sharing a variable across these environments wasn't possible. We have added support for a new entry,
$shared, in the environment file which enables you define default values for variables which are available across all environments.For example, consider the environment file (http-client.env.json) below.
{
    "$shared": {
        "HostAddress": "https://localhost:7293"
    },
    "dev": {
        "username": "sayedha"
    },
    "dev2": {
        "username": "madsk"
    },
    "staging": {
        "username": "staginuser",
        "HostAddress": "https://sayedrest.example.com"
    }
}
We have defined the shared values in
$sharedabove which consists of theHostAddressvariable which is set tolocalhost:7293.Of the three environments defined, neither dev environment has specified the value for
HostAddressbut staging has a value for it.When you use either the
devordev2environment the value forHostAddresswill come from$sharedsince those environments don't have a value forHostAddress. When using the staging environment, the value forHostAddresswill be set tohttps://sayedrest.example.com.📣 See feature ticket to share your feedback and continue the conversation.
Data
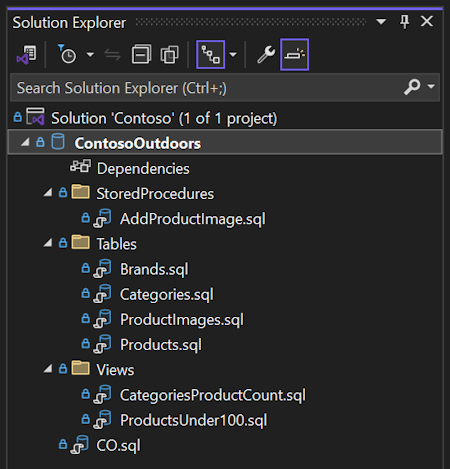
SDK-style SQL projects in SSDT 📣
This update adds SQL projects based on the Microsoft.Build.Sql SDK, which brings cross-platform support and improved package references to SQL Server Data Tools (SSDT) projects. With less verbose project files and database references to NuGet packages, teams can more efficiently collaborate on large databases in a single project or compile multiple sets of objects from several projects.
Database deployments from a Microsoft.Build.Sql project can be automated in Windows and Linux environments where the Microsoft.SqlPackage dotnet tool publishes the build artifact (.dacpac) from the SQL project. Learn more about the preview of SDK-style SQL projects and DevOps for SQL.
The Microsoft.Build.Sql project SDK is open source and developed on GitHub.
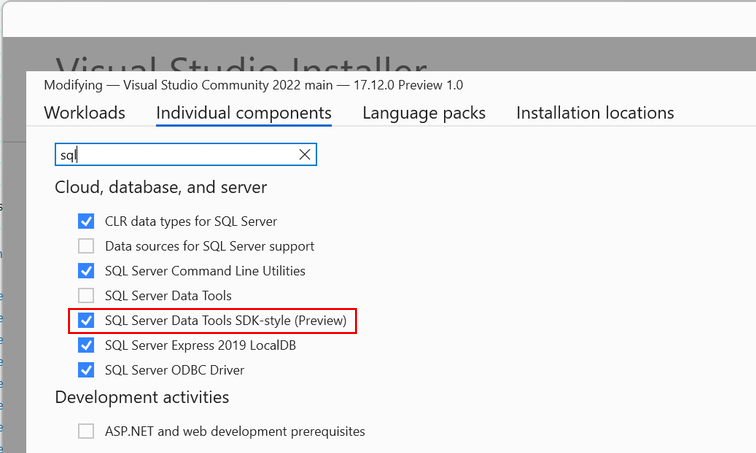
Make sure to install the latest SSDT preview component in the Visual Studio installer to use the SDK-style SQL projects in your solution.
📣 See feature ticket to share your feedback and continue the conversation.
.NET
Achieve more with .NET 9 📣
.NET 9 elevates cloud-native and intelligent app development, focusing on productivity enhancements, streamlined deployments, and accelerated AI integration, providing superior performance across a wide range of applications. With full support for .NET 9 in Visual Studio 17.12, you can easily leverage all the latest improvements. For more details on what's new, visit What's new in .NET 9
Additionally, you'll find updates to features around the IDE that make working with .NET and ASP.NET more productive than ever.
📣 See feature ticket to share your feedback and continue the conversation.

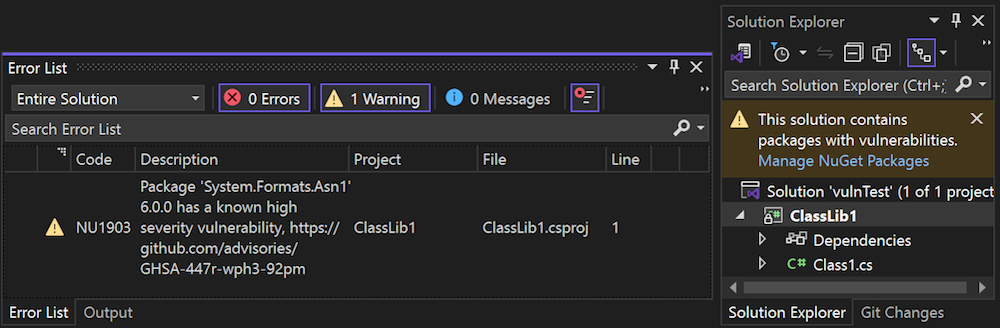
NuGet audits transitive packages 📣
NuGet Audit, first added in Visual Studio 17.8 (and .NET 8), provides warnings during restore if any packages used by your project have known vulnerabilities.
For more information on NuGet Audit, including all configuration options, see the documentation on NuGet Audit.
In this release, NuGet Audit defaults for NuGetAuditMode have changed. Previously, only direct package references were being reported by default (
<NuGetAuditMode>direct</NuGetAuditMode>). Now, by default it will warn on both direct and transitive packages (<NuGetAuditMode>all</NuGetAuditMode>) with known vulnerabilities. To retain the previous defaults, you can explicitly set your preferred value of NuGetAuditMode in your project or Directory.Build.props file.Alternatively, you can set SdkAnalysisLevel to a version number lower than 9.0.100 but be aware this will affect all features that use SdkAnalysisLevel.
NuGet Audit requires a package source that provides a vulnerability database. NuGet.org provides vulnerabilities from the GitHub Advisories Database.
Starting with Visual Studio 17.12, it's now possible to specify audit sources in NuGet.Config files, so it's no longer required to use nuget.org as a package source.
If you're not using nuget.org as a package source and wish to use NuGet Audit for vulnerable package reporting during restore, add the following to a NuGet.Config file in your solution directory:
<confiuration>
  <!-- any existing config, including <packageSources> -->
  <auditSources>
    <add key="nuget.org" value="https://api.nuget.org/v3/index.json" />
  </auditSources>
</configuration>
📣 See feature ticket to share your feedback and continue the conversation.
C++
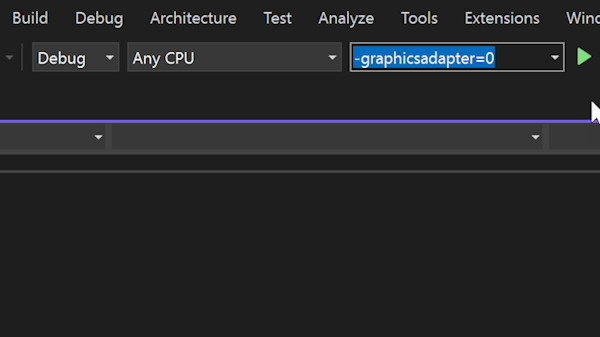
Set C++ Command Line Arguments
Quickly set your command line arguments for your C++ project with the new Set Arguments toolbar item. This combo box allows you to set your command line arguments right from the toolbar, so you can quickly change your arguments. When you run your project, any arguments entered in the box will be passed.
This toolbar component will show up by default if you have Game development with C++ workload installed. If you don't see it, you can add it by right-clicking on the toolbar and selecting Set Arguments.
Note: This feature is currently available for Unreal Engine projects only. General C++ projects will be supported in future releases.
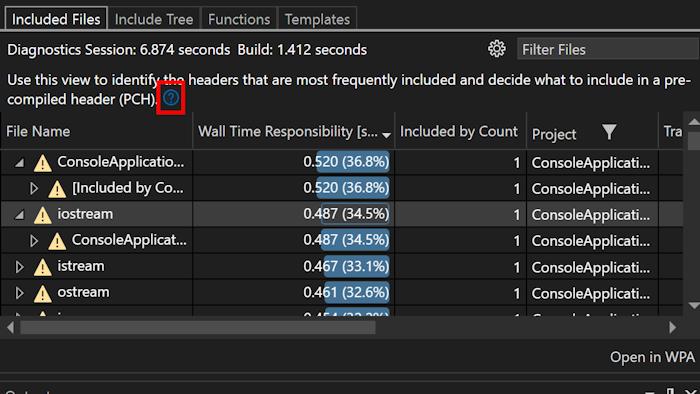
Build Insights view explanations
You can now see a short description on how each tab of Build Insights can be used, along with a link to the documentation for a detailed explanation.
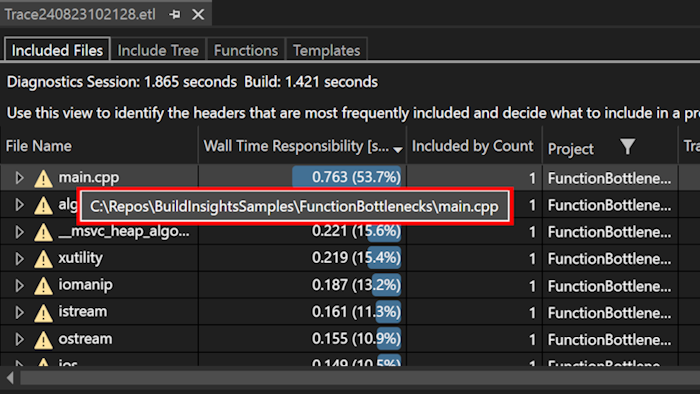
Build Insights path adjustments
We have hidden full and relative paths to reduce clutter. To see full paths, simply hover over the file. You will also see a new Filename column for both files and Translation Units, displayed by default to help you quickly identify files without parsing lengthy paths.
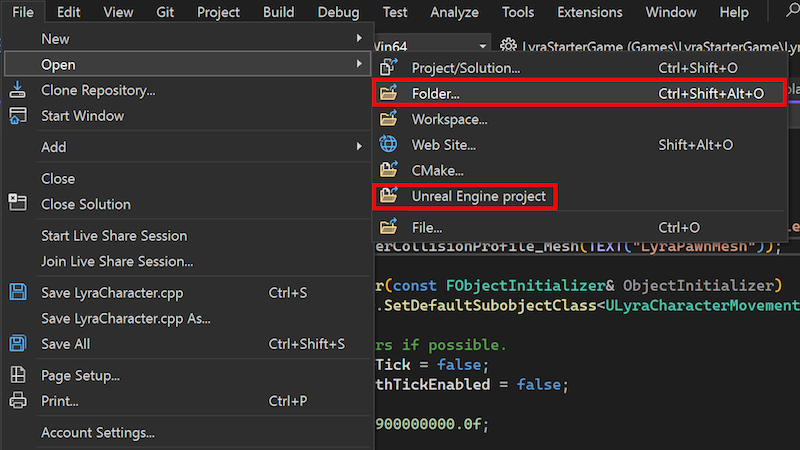
Open Folder for Unreal Engine uproject
We have added an additional entry point to open your Unreal Engine uproject with Visual Studio's uproject support. You can now open your uproject directly from the File menu by selecting Open > Folder.... This will open your Unreal Engine project in Visual Studio.
For more information on how to use this feature, see Directly Editing .uproject in Visual Studio.
Change signature improved
We have made enhancements to the Change Signature feature for C++. The user interface has been updated, allowing you to manage parameters by adding, removing, and rearranging them in the top box. You can also change their order through a drag-and-drop interface.
The access methods remain the same: press
Ctrl+.to trigger the Quick Actions and Refactorings menu and select Change Signature..
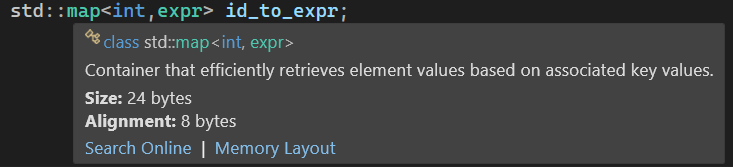
STL documentation tooltips
We are announcing a new feature in our C++ development environment. We have started adding documentation comments for Standard Template Library (STL) types.
When you hover over an STL type in your code, tooltips will display a brief description of the type and its functionality.
This feature aims to provide immediate, context-sensitive information directly within the editor. You can expect to see more of these documentation comments being added over time, making it easier to understand and use STL types.
Top user-reported bug fixes
- C# Editor cannot find controls defined in xaml file
- GIT command (sync, pull, push) and branch list missing from status bar
- VSSDK/CPS/Extensibility: Image Loading in VS Extensions via .imagemanifest is Broken in VS2022
- Backspace etc sometimes stop working
- Resource explorer cannot open resx files
- Reset all settings always results in an error
- VS2022 17.10.0 Preview 7: Internal compiler error
- CMake cache generation on a remote Linux host fails on a ctest query
- Error in Azure DevOps pipelines with VSTest@2
Note
This update may include new Microsoft or third-party software that is licensed separately, as set out in the 3rd Party Notices or in its accompanying license.
From all of us on the team, thank you for choosing Visual Studio. If you have any questions, please reach us on Twitter or Developer Community.
Happy coding!
The Visual Studio team