Syslog collection with Container Insights

Container Insights offers the ability to collect Syslog events from Linux nodes in your Azure Kubernetes Service (AKS) clusters. This includes the ability to collect logs from control plane components like kubelet. Customers can also use Syslog for monitoring security and health events, typically by ingesting syslog into a SIEM system like Microsoft Sentinel.

Prerequisites

How to enable Syslog

From the Azure portal

Navigate to your cluster. Open the Insights tab for your cluster. Open the Monitor Settings panel. Click on Edit collection settings, then check the box for Enable Syslog collection

Screen recording of syslog being enabled from the Azure portal through the Monitor Settings panel in Container Insights.

Using Azure CLI commands

Use the following command in Azure CLI to enable syslog collection when you create a new AKS cluster.

az aks create -g syslog-rg -n new-cluster --enable-managed-identity --node-count 1 --enable-addons monitoring --enable-msi-auth-for-monitoring --enable-syslog --generate-ssh-key

Use the following command in Azure CLI to enable syslog collection on an existing AKS cluster.

az aks enable-addons -a monitoring --enable-msi-auth-for-monitoring --enable-syslog -g syslog-rg -n existing-cluster

Using ARM templates

You can also use ARM templates for enabling syslog collection

  1. Download the template in the GitHub content file and save it as existingClusterOnboarding.json.

  2. Download the parameter file in the GitHub content file and save it as existingClusterParam.json.

  3. Edit the values in the parameter file:

    • aksResourceId: Use the values on the AKS Overview page for the AKS cluster.
    • aksResourceLocation: Use the values on the AKS Overview page for the AKS cluster.
    • workspaceResourceId: Use the resource ID of your Log Analytics workspace.
    • resourceTagValues: Match the existing tag values specified for the existing Container insights extension data collection rule (DCR) of the cluster and the name of the DCR. The name will be MSCI-<clusterName>-<clusterRegion> and this resource created in an AKS clusters resource group. If this is the first time onboarding, you can set the arbitrary tag values.
    • enableSyslog: Set to true
    • syslogLevels: Array of syslog levels to collect. Default collects all levels.
    • syslogFacilities: Array of syslog facilities to collect. Default collects all facilities

Note

Syslog level and facilities customization is currently only available via ARM templates.

Deploy the template

Deploy the template with the parameter file by using any valid method for deploying Resource Manager templates. For examples of different methods, see Deploy the sample templates.

Deploy with Azure PowerShell

New-AzResourceGroupDeployment -Name OnboardCluster -ResourceGroupName <ResourceGroupName> -TemplateFile .\existingClusterOnboarding.json -TemplateParameterFile .\existingClusterParam.json

The configuration change can take a few minutes to complete. When it's finished, a message similar to the following example includes this result:

provisioningState       : Succeeded

Deploy with Azure CLI

az login
az account set --subscription "Subscription Name"
az deployment group create --resource-group <ResourceGroupName> --template-file ./existingClusterOnboarding.json --parameters @./existingClusterParam.json

The configuration change can take a few minutes to complete. When it's finished, a message similar to the following example includes this result:

provisioningState       : Succeeded

How to access Syslog data

Access using built-in workbooks

To get a quick snapshot of your syslog data, customers can use our built-in Syslog workbook. There are two ways to access the built-in workbook.

Option 1 - The Reports tab in Container Insights. Navigate to your cluster. Open the Insights tab for your cluster. Open the Reports tab and look for the Syslog workbook.

Video of Syslog workbook being accessed from Container Insights Reports tab.

Option 2 - The Workbooks tab in AKS Navigate to your cluster. Open the Workbooks tab for your cluster and look for the Syslog workbook.

Video of Syslog workbook being accessed from cluster workbooks tab.

Access using a Grafana dashboard

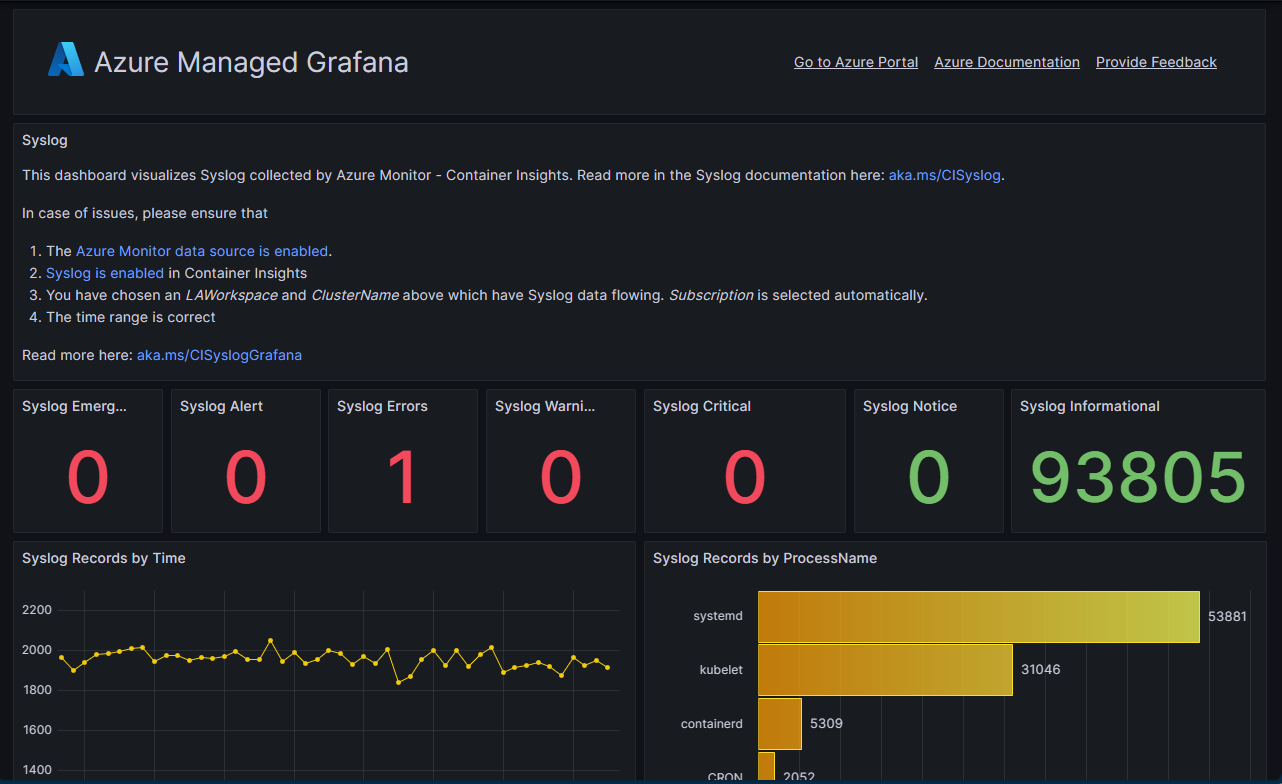
Customers can use our Syslog dashboard for Grafana to get an overview of their Syslog data. Customers who create a new Azure-managed Grafana instance will have this dashboard available by default. Customers with existing instances or those running their own instance can import the Syslog dashboard from the Grafana marketplace.

Note

You will need to have the Monitoring Reader role on the Subscription containing the Azure Managed Grafana instance to access syslog from Container Insights.

Screenshot of Syslog Grafana dashboard.

Access using log queries

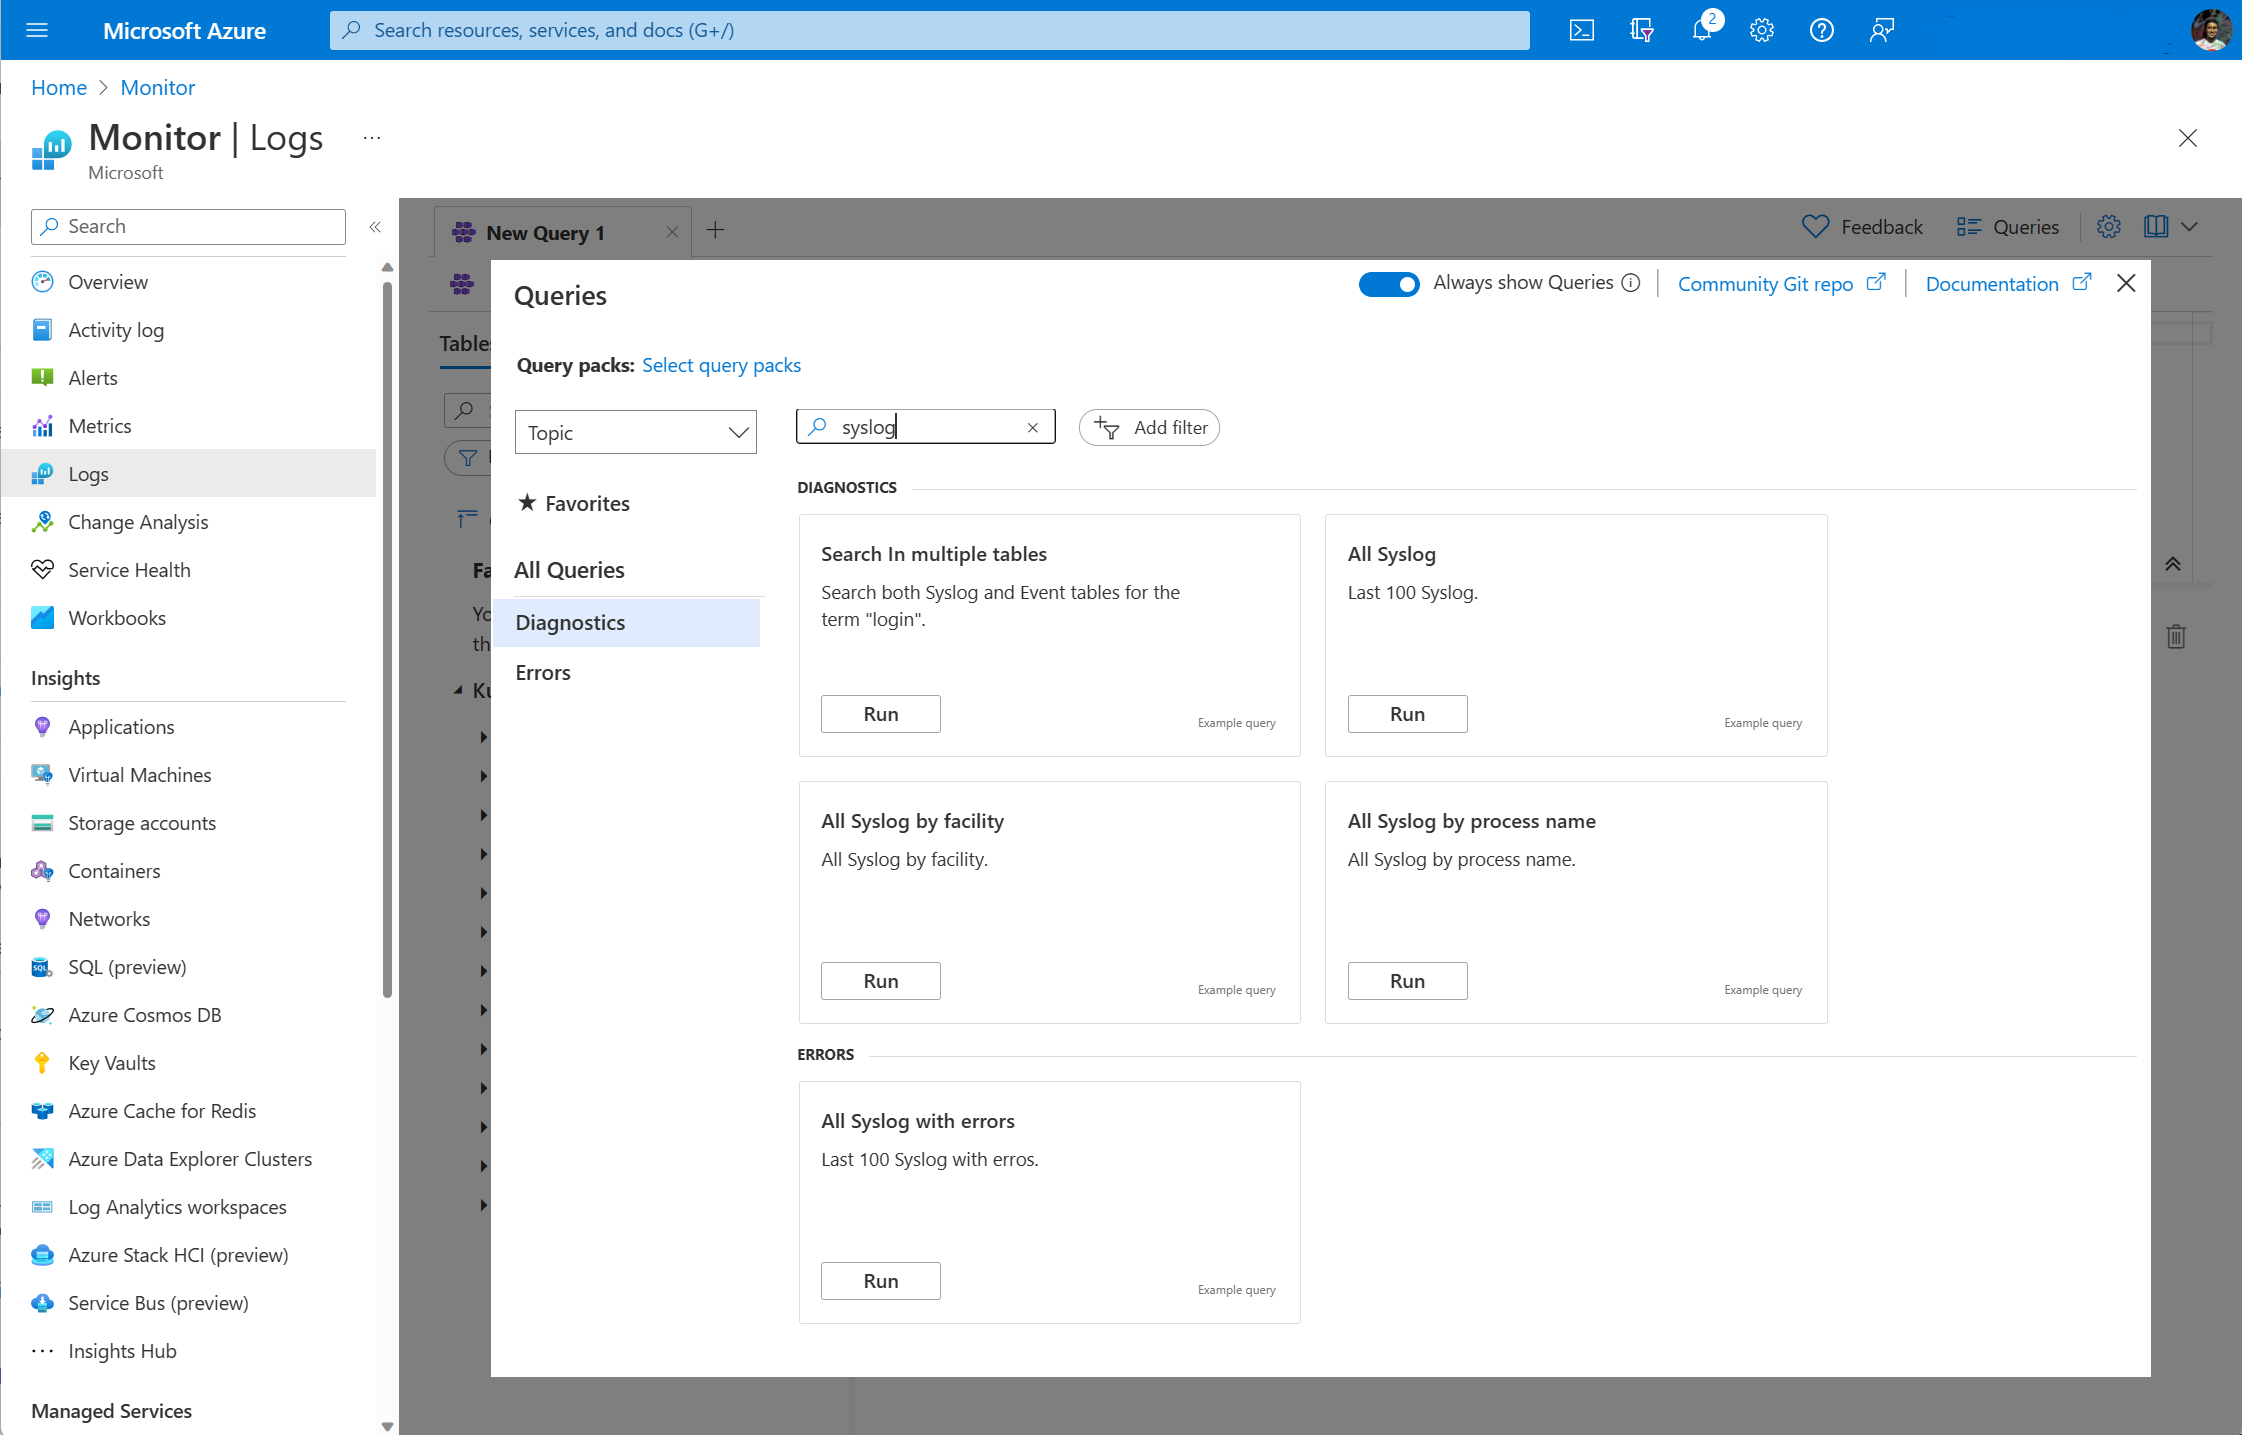
Syslog data is stored in the Syslog table in your Log Analytics workspace. You can create your own log queries in Log Analytics to analyze this data or use any of the prebuilt queries.

Screenshot of Syslog query loaded in the query editor in the Azure Monitor Portal UI.

You can open Log Analytics from the Logs menu in the Monitor menu to access Syslog data for all clusters or from the AKs cluster's menu to access Syslog data for only that cluster.

Screenshot of Query editor with Syslog query.

Sample queries

The following table provides different examples of log queries that retrieve Syslog records.

Query Description
Syslog All Syslogs
Syslog | where SeverityLevel == "error" All Syslog records with severity of error
Syslog | summarize AggregatedValue = count() by Computer Count of Syslog records by computer
Syslog | summarize AggregatedValue = count() by Facility Count of Syslog records by facility
Syslog | where ProcessName == "kubelet" All Syslog records from the kubelet process
Syslog | where ProcessName == "kubelet" and SeverityLevel == "error" Syslog records from kubelet process with errors

Editing your Syslog collection settings

To modify the configuration for your Syslog collection, you modify the data collection rule (DCR) that was created when you enabled it.

Select Data Collection Rules from the Monitor menu in the Azure portal.

Screenshot of Data Collection Rules tab in the Azure Monitor portal UI.

Select your DCR and then View data sources. Select the Linux Syslog data source to view the Syslog collection details.

Note

A DCR is created automatically when you enable syslog. The DCR follows the naming convention MSCI-<WorkspaceRegion>-<ClusterName>.

Screenshot of Data Sources tab for Syslog data collection rule.

Select the minimum log level for each facility that you want to collect.

Screenshot of Configuration panel for Syslog data collection rule.

Next steps

Once setup customers can start sending Syslog data to the tools of their choice

Read more

Share your feedback for this feature here: https://forms.office.com/r/BBvCjjDLTS