Quickstart: Create a database watcher to monitor Azure SQL (preview)
This article shows you how to create a new database watcher to monitor an Azure SQL database, elastic pool, or SQL managed instance. For an introduction to database watcher, see Monitor Azure SQL workloads with database watcher. For a detailed description of database watcher setup and configuration, see Create and configure a database watcher.
Follow the steps to create a database watcher and start monitoring your Azure SQL resources in minutes. The watcher you create uses Microsoft Entra authentication and private connectivity to the monitoring targets.
Note
Database watcher is currently in preview. Preview features are released with limited capabilities, but are made available on a preview basis so customers can get early access and provide feedback. Preview features are subject to separate supplemental preview terms, and aren't subject to SLAs. Support is provided as best effort in certain cases. However, Microsoft Support is eager to get your feedback on the preview functionality, and might provide best effort support in certain cases. Preview features might have limited or restricted functionality, and might be available only in selected geographic areas.
Prerequisites
This quickstart requires the prerequisites for creating and configuring a database watcher.
Create a watcher
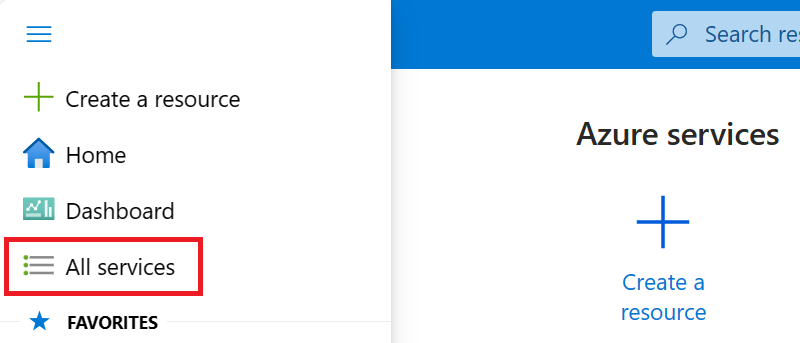
In Azure portal, in the resource menu, select All services.
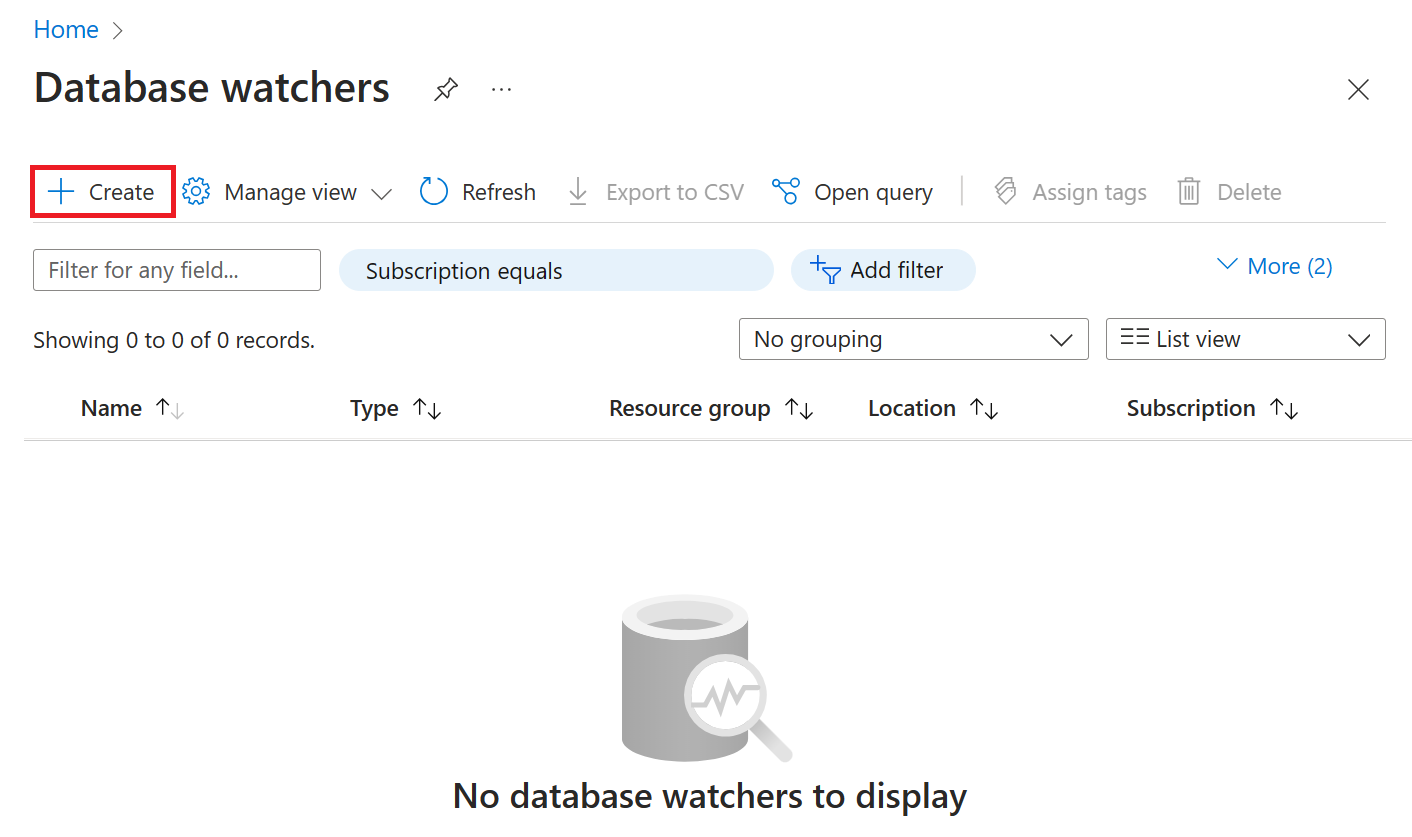
Select Monitor as the category. Under Monitoring tools, select Database watchers. In the Database watchers view, select Create.
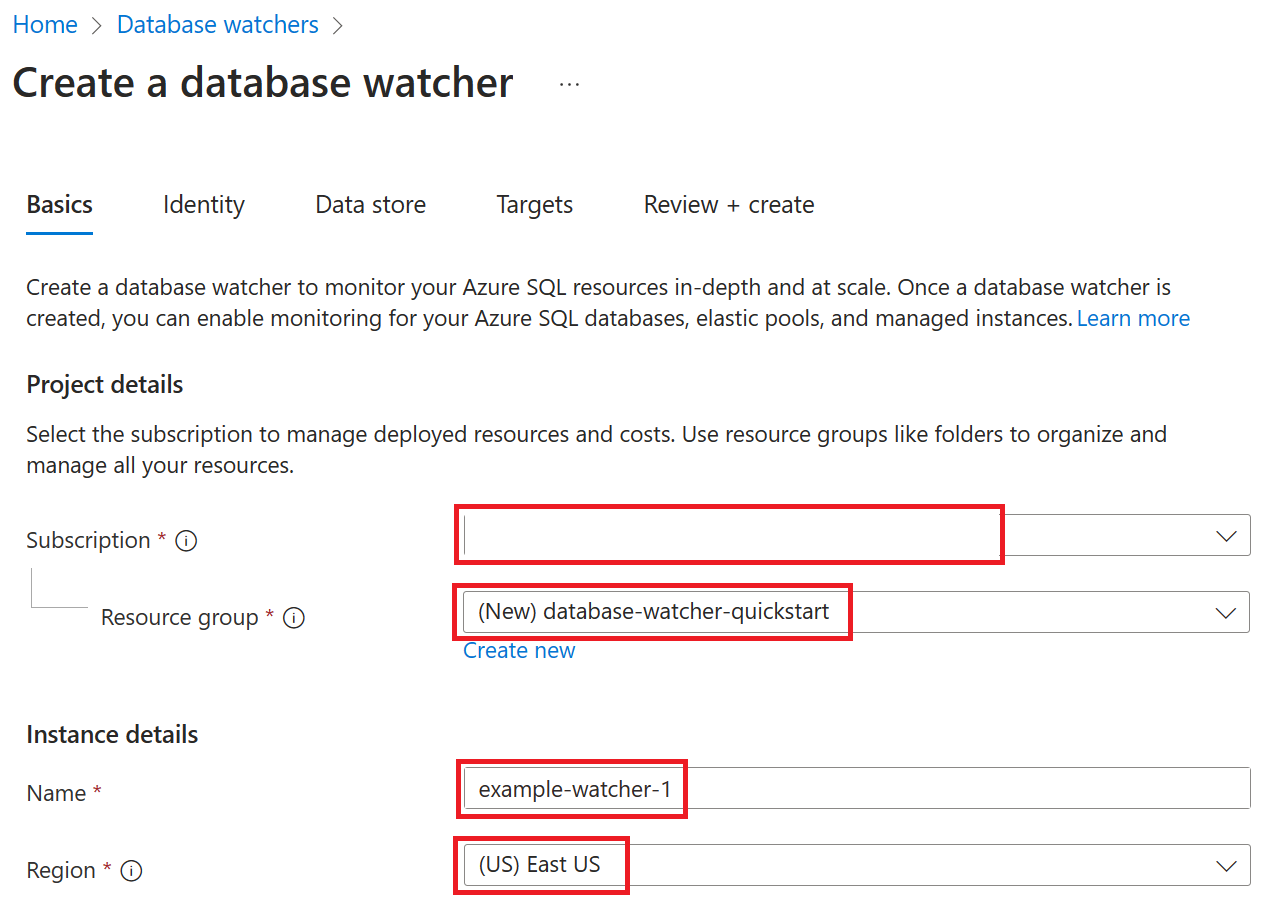
On the Basics tab, select the subscription and resource group for the watcher, enter the name of the watcher, and select an Azure region where you want to create the watcher.
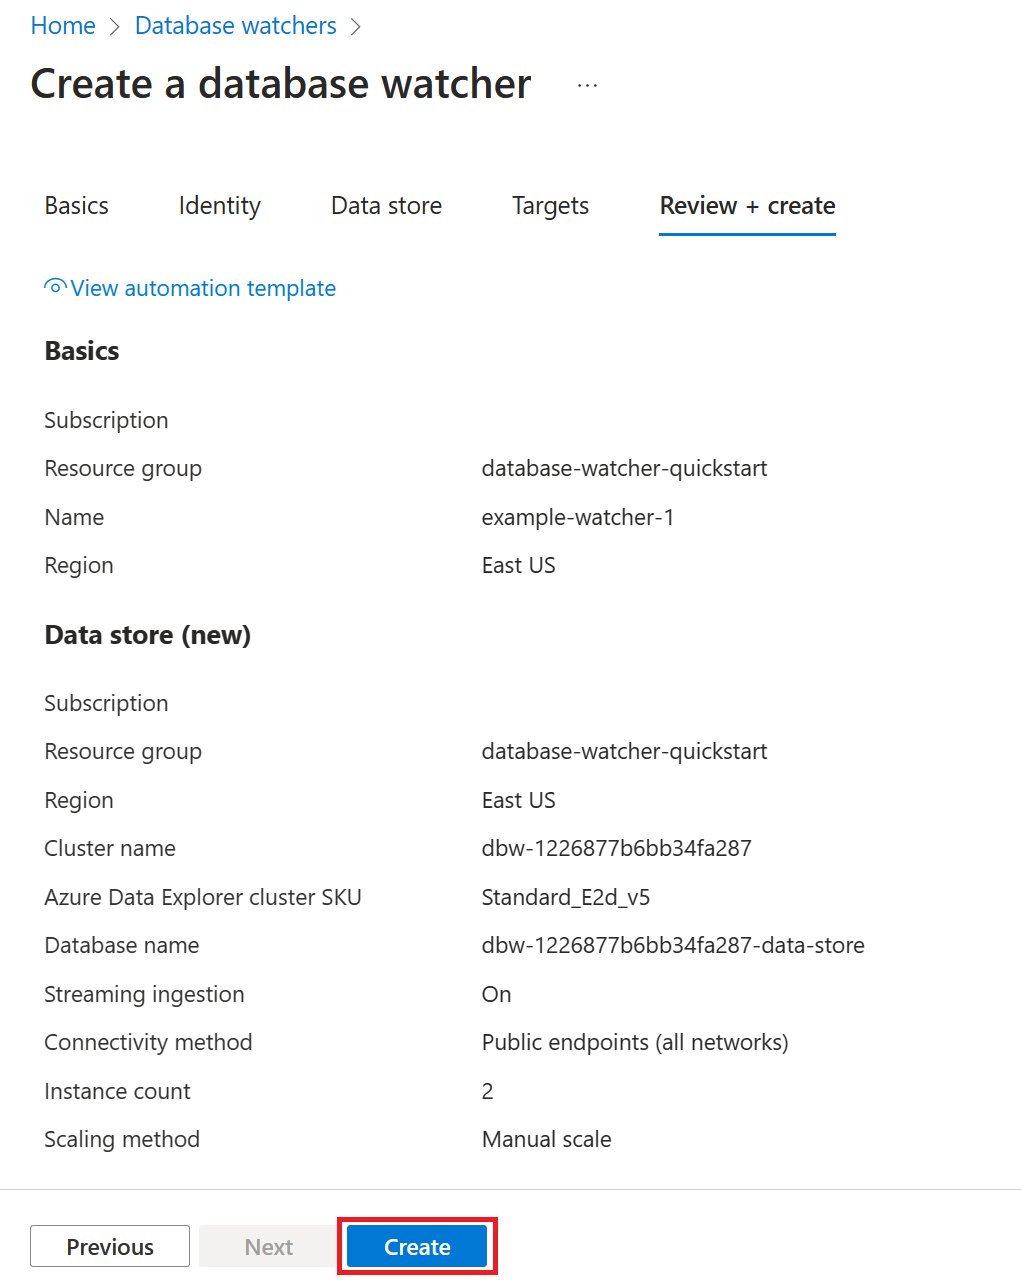
Select Review + create, review the watcher and data store configuration. Select Create.
This step creates a database watcher, an Azure Data Explorer cluster, and a database on the cluster. Collected monitoring data is stored in this database.


Add a SQL target and grant access
Once the deployment completes, select Go to resource to open the new database watcher in Azure portal.
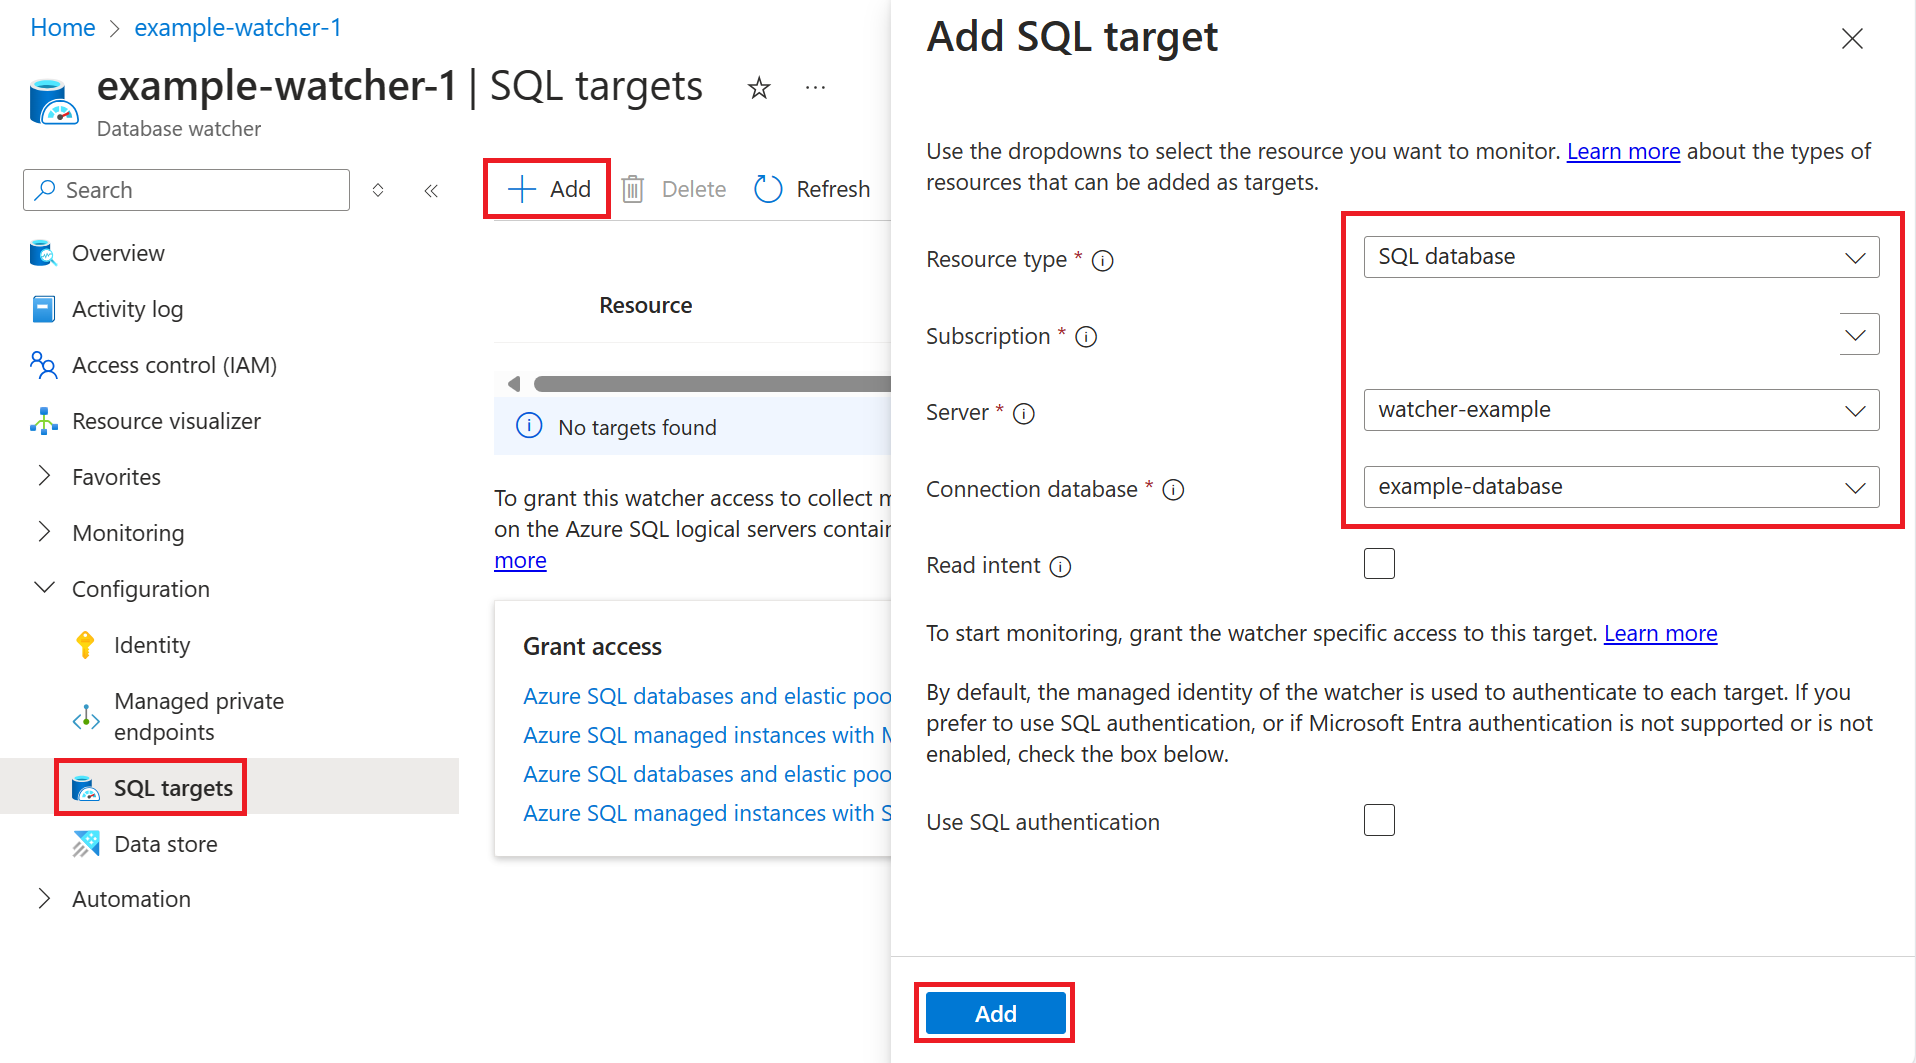
Select SQL Targets, Add. Use the dropdowns to select the Azure SQL resource that you want to monitor, and select Add. You can select an Azure SQL database, an elastic pool, or a SQL managed instance. In this example, an Azure SQL database is selected.
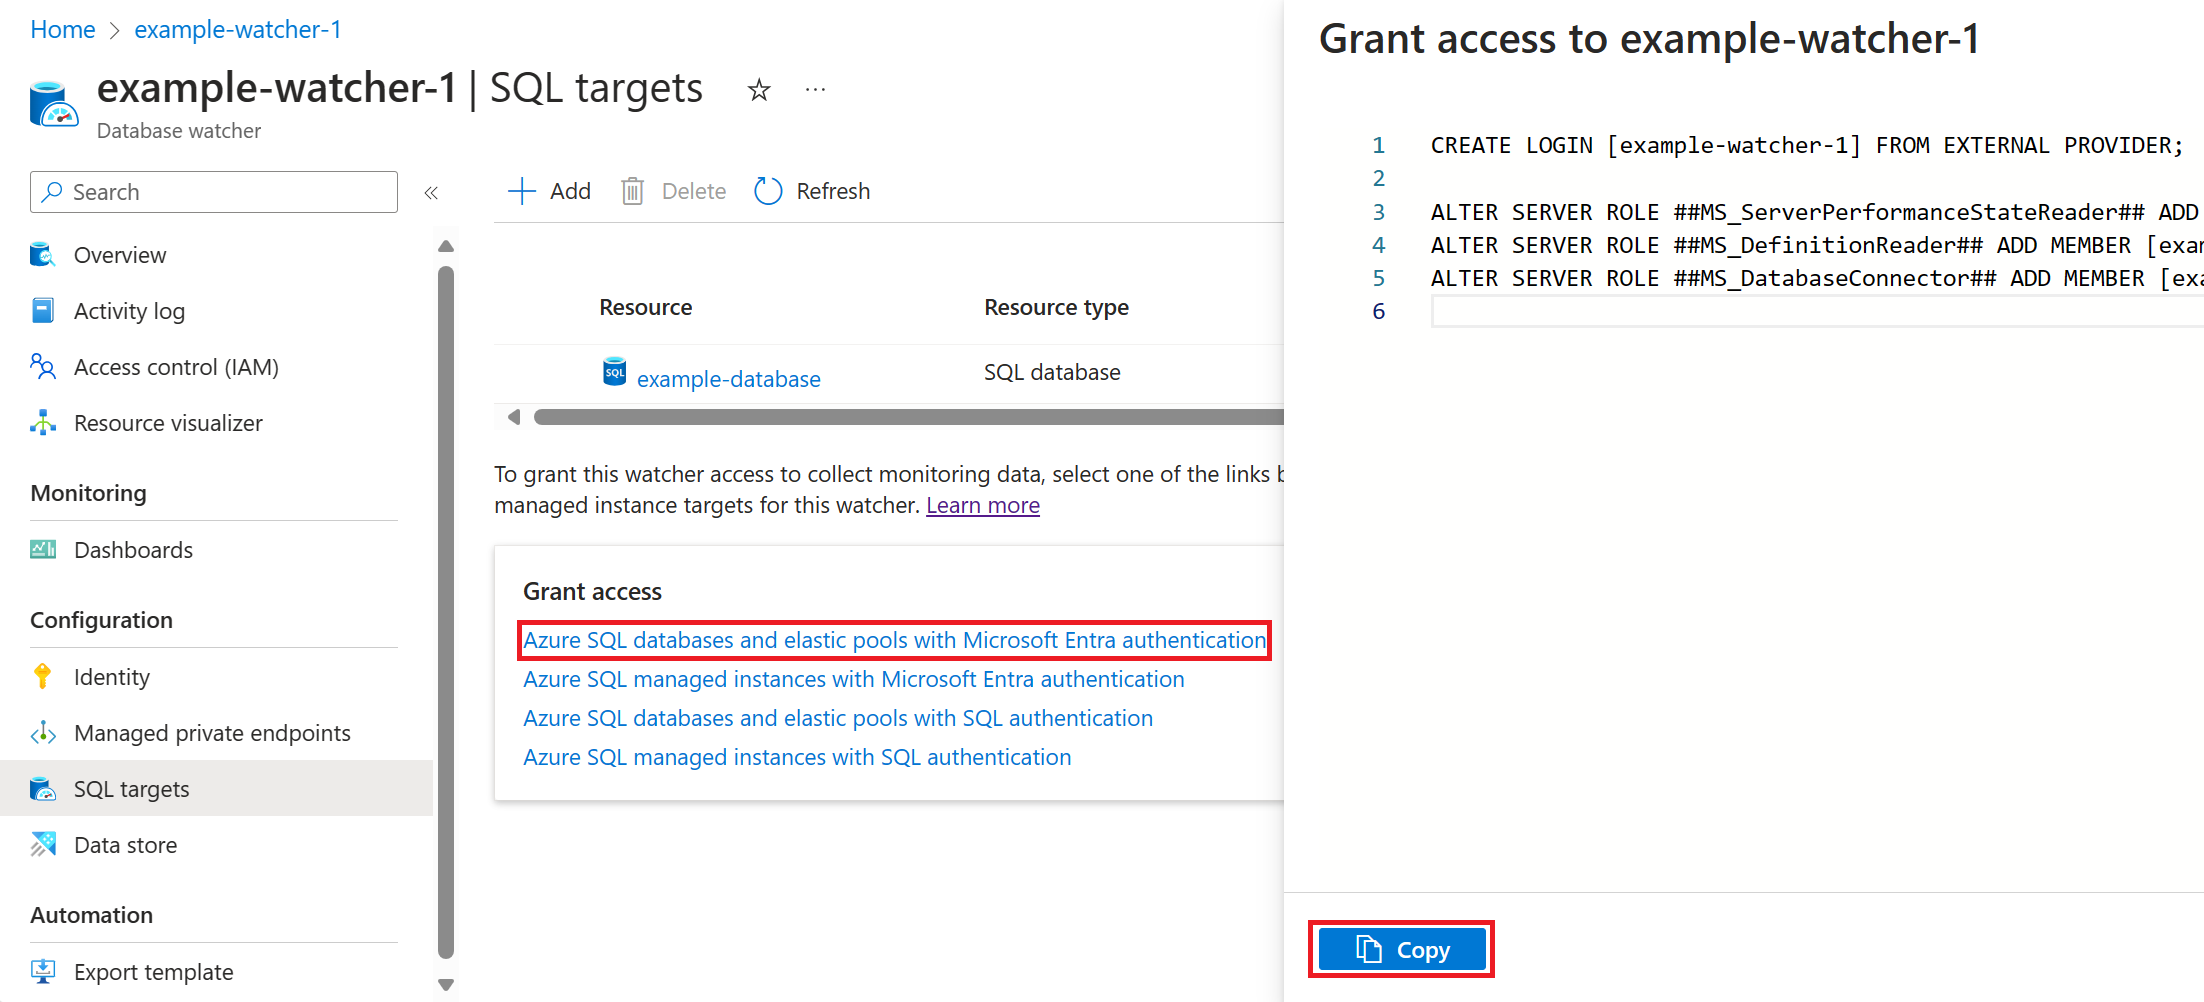
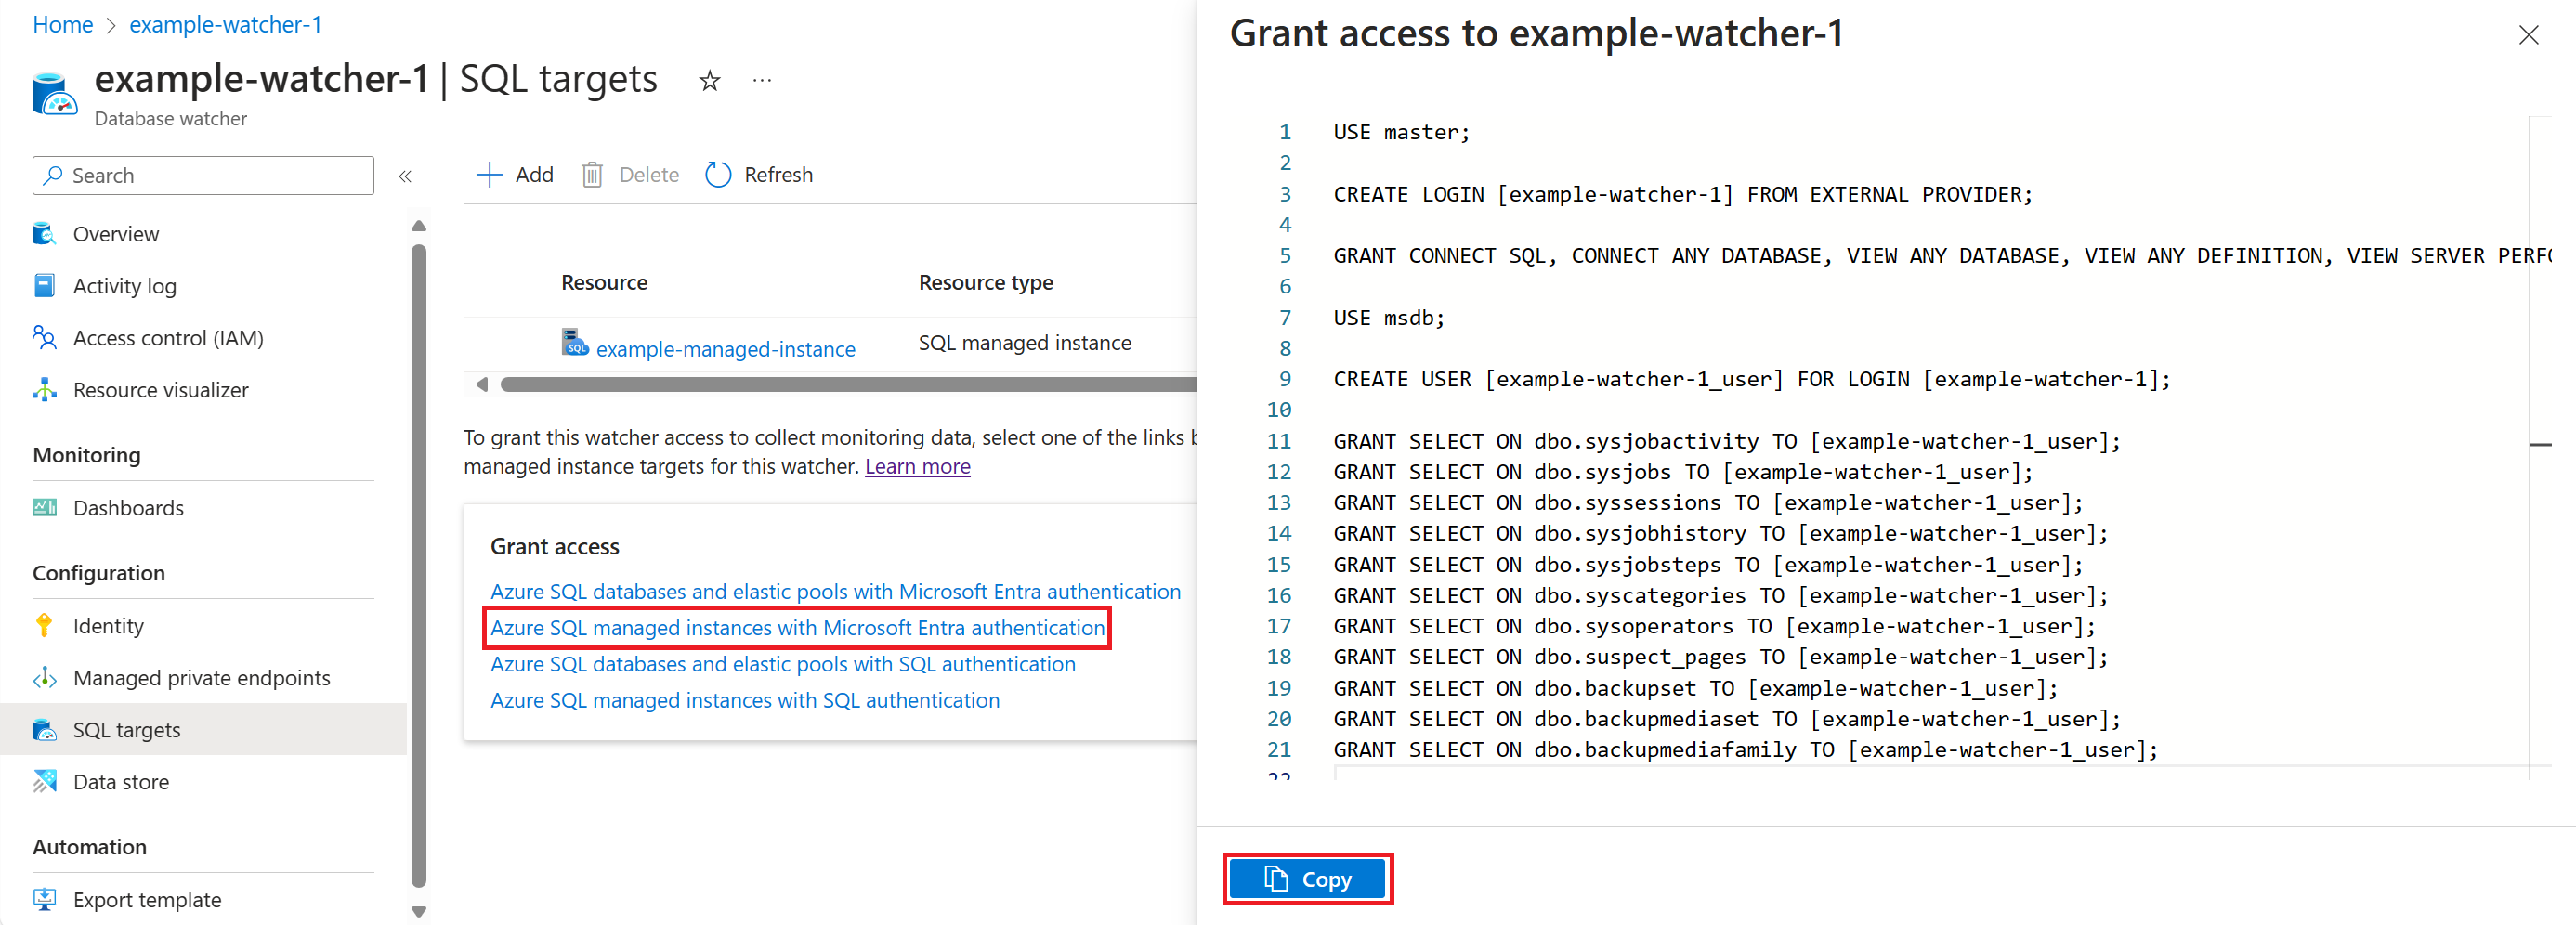
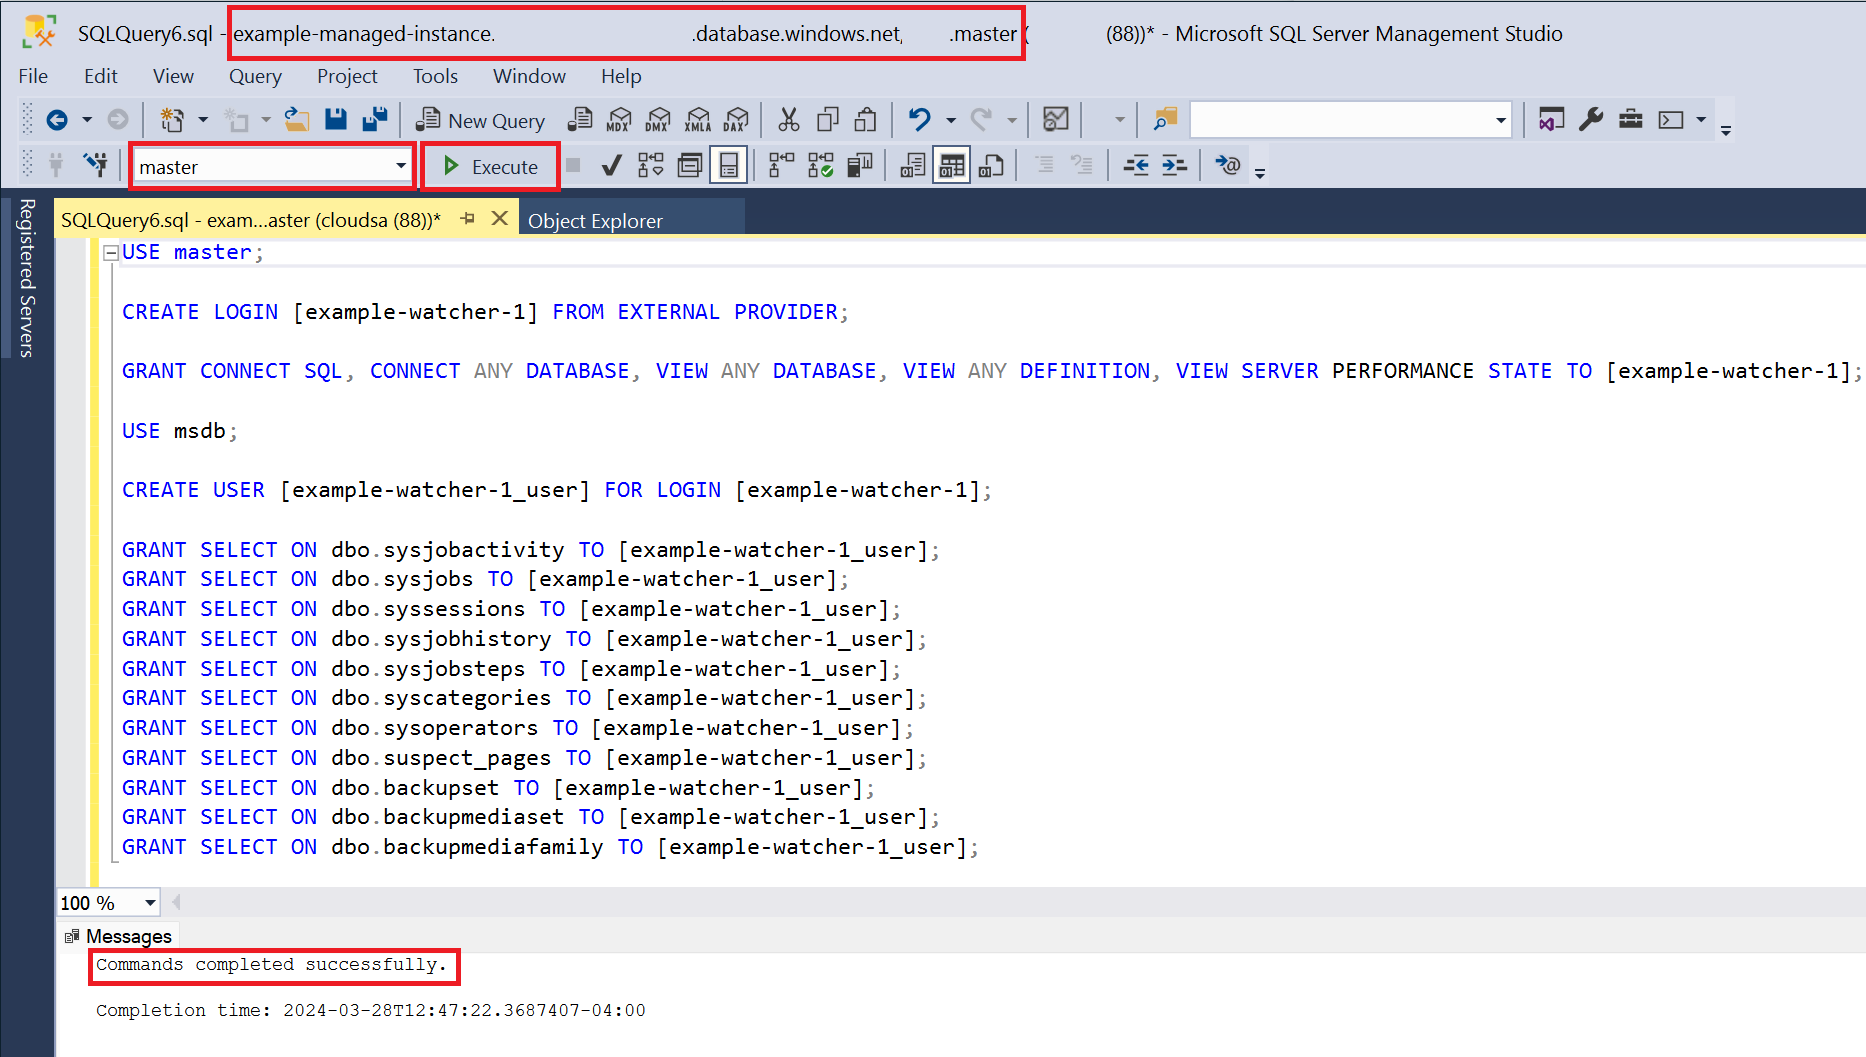
In the Grant access card, select a Microsoft Entra authentication link matching your target type. Copy the T-SQL script that grants the watcher limited, specific access to collect monitoring data from the selected target.
The following screenshot shows the T-SQL script for Azure SQL databases and elastic pools.
The following screenshot shows the T-SQL script for Azure SQL managed instances.
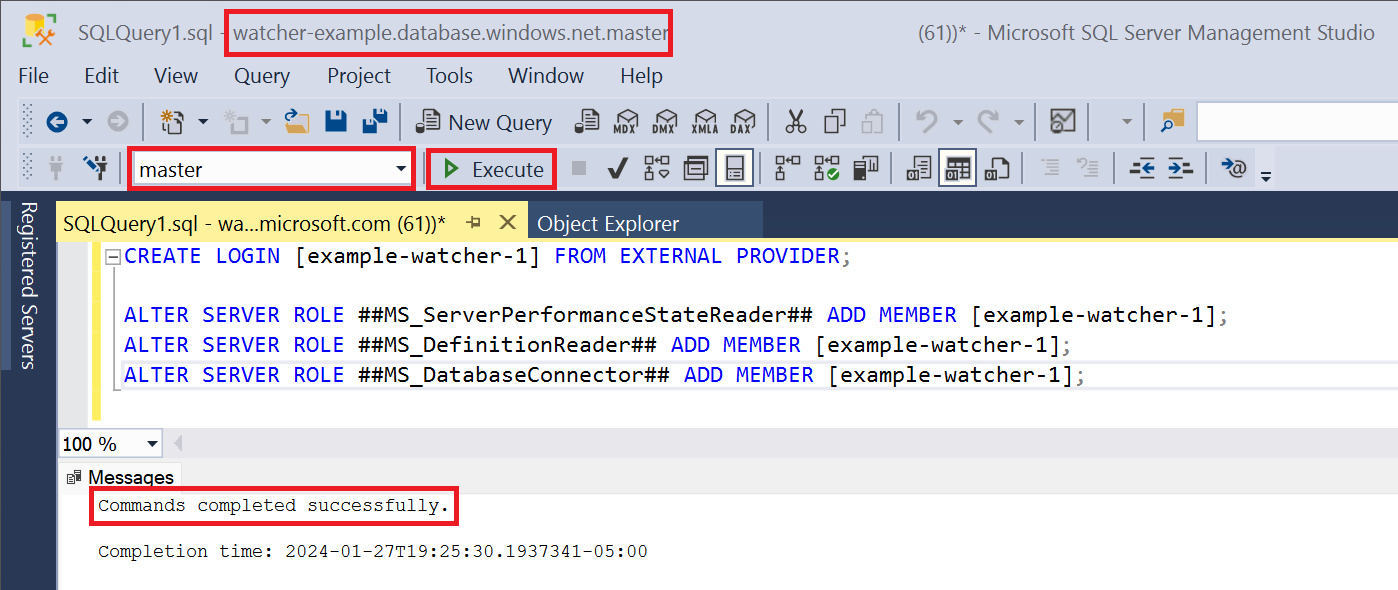
Open a new query window in SQL Server Management Studio or Azure Data Studio. Connect to the
masterdatabase on the Azure SQL logical server or SQL managed instance you selected. Paste the T-SQL script, and select Execute.The following screenshot shows the T-SQL script for Azure SQL databases and elastic pools.
The following screenshot shows the T-SQL script for Azure SQL managed instances.


Create and approve a managed private endpoint
On the Managed private endpoints page of the watcher, select Add.
Enter the private endpoint name, select the subscription for your Azure SQL target, the resource type, and the same logical server or SQL managed instance that you selected when adding the target.
For resource type, use
Microsoft.Sql/serversfor a logical server, andMicrosoft.Sql/managedInstancesfor a SQL managed instance.For target sub-resource, use
sqlServerfor a logical server, andmanagedInstancefor a SQL managed instance.Select Create.
In this example, a private endpoint for an Azure SQL logical server named
watcher-exampleis ready to be created. Creating a private endpoint might take one or two minutes.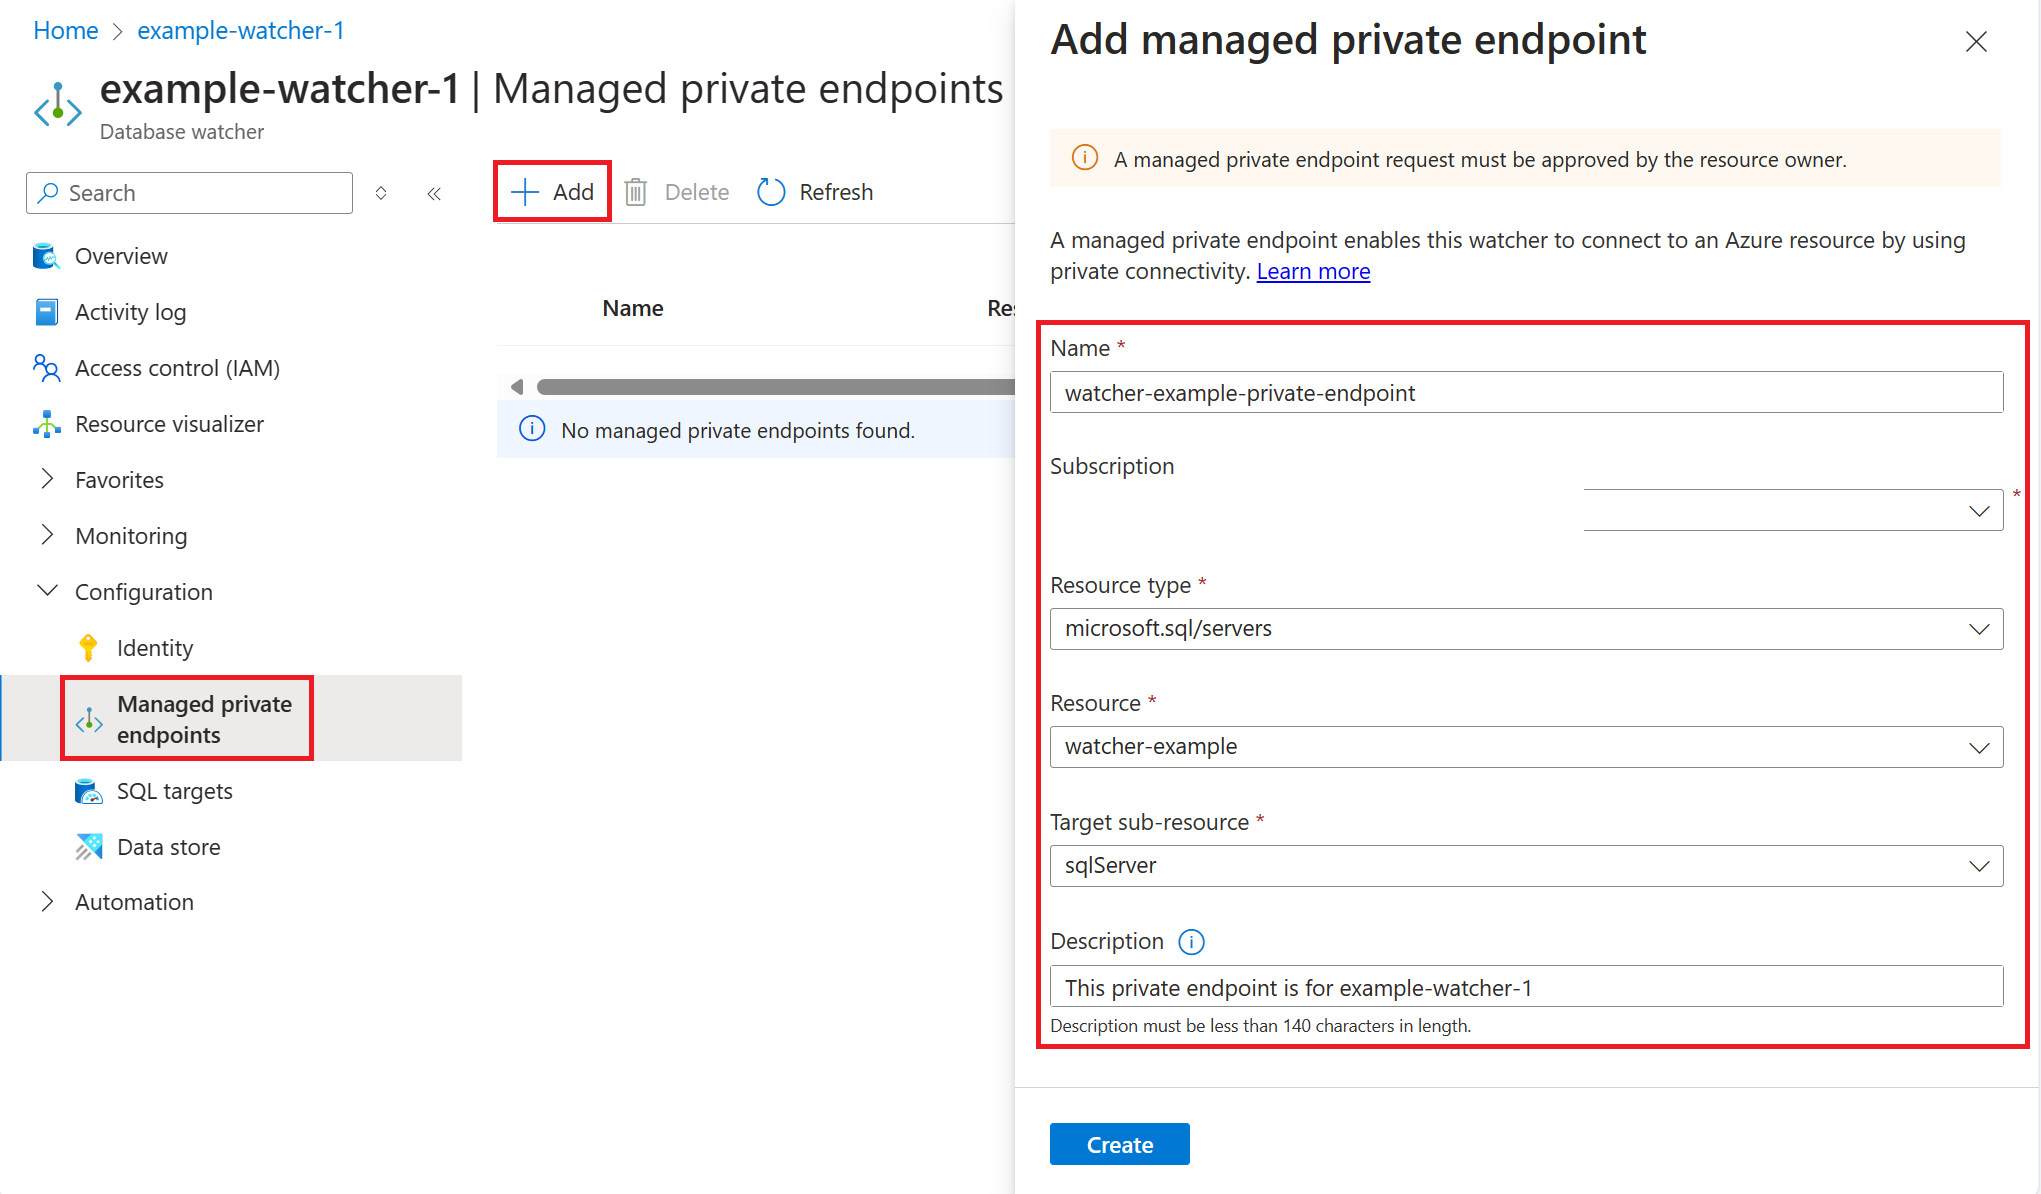
In the Azure portal, search for Private endpoints. Under Pending connections, find the private endpoint you created, and select Approve.


Start monitoring
On the watcher Overview page, select Start.
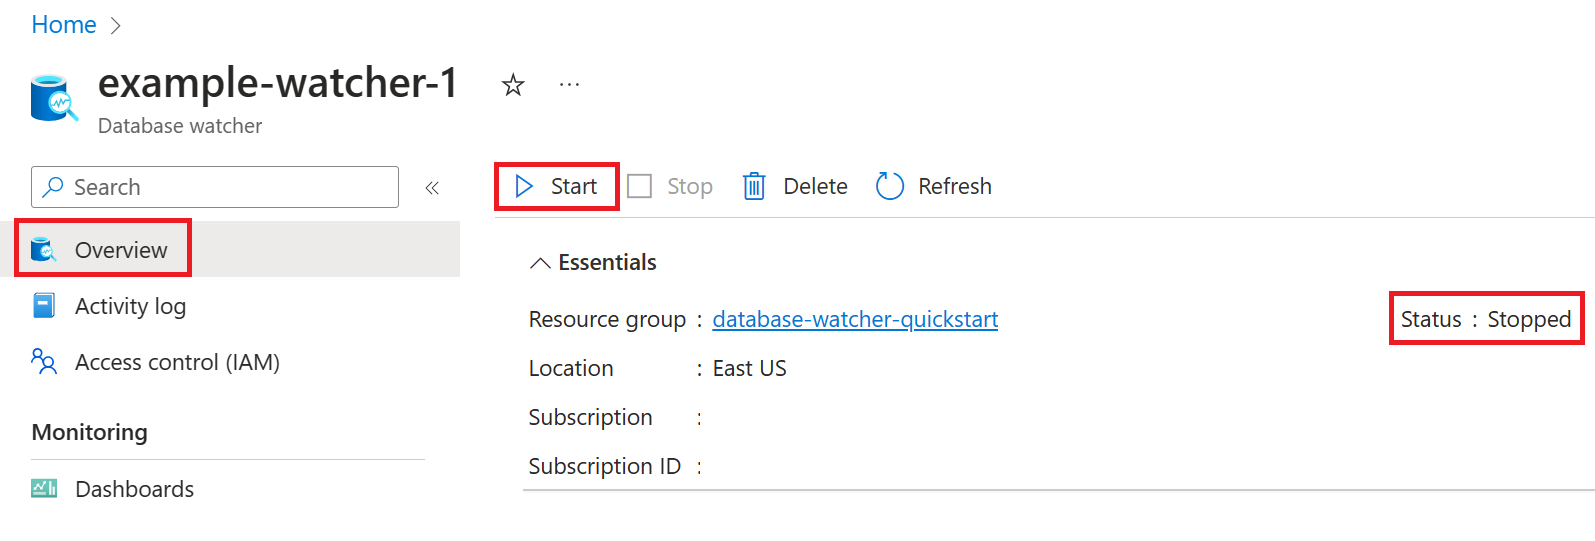
The watcher status changes from Stopped to Running. It takes a few minutes for data collection to start.
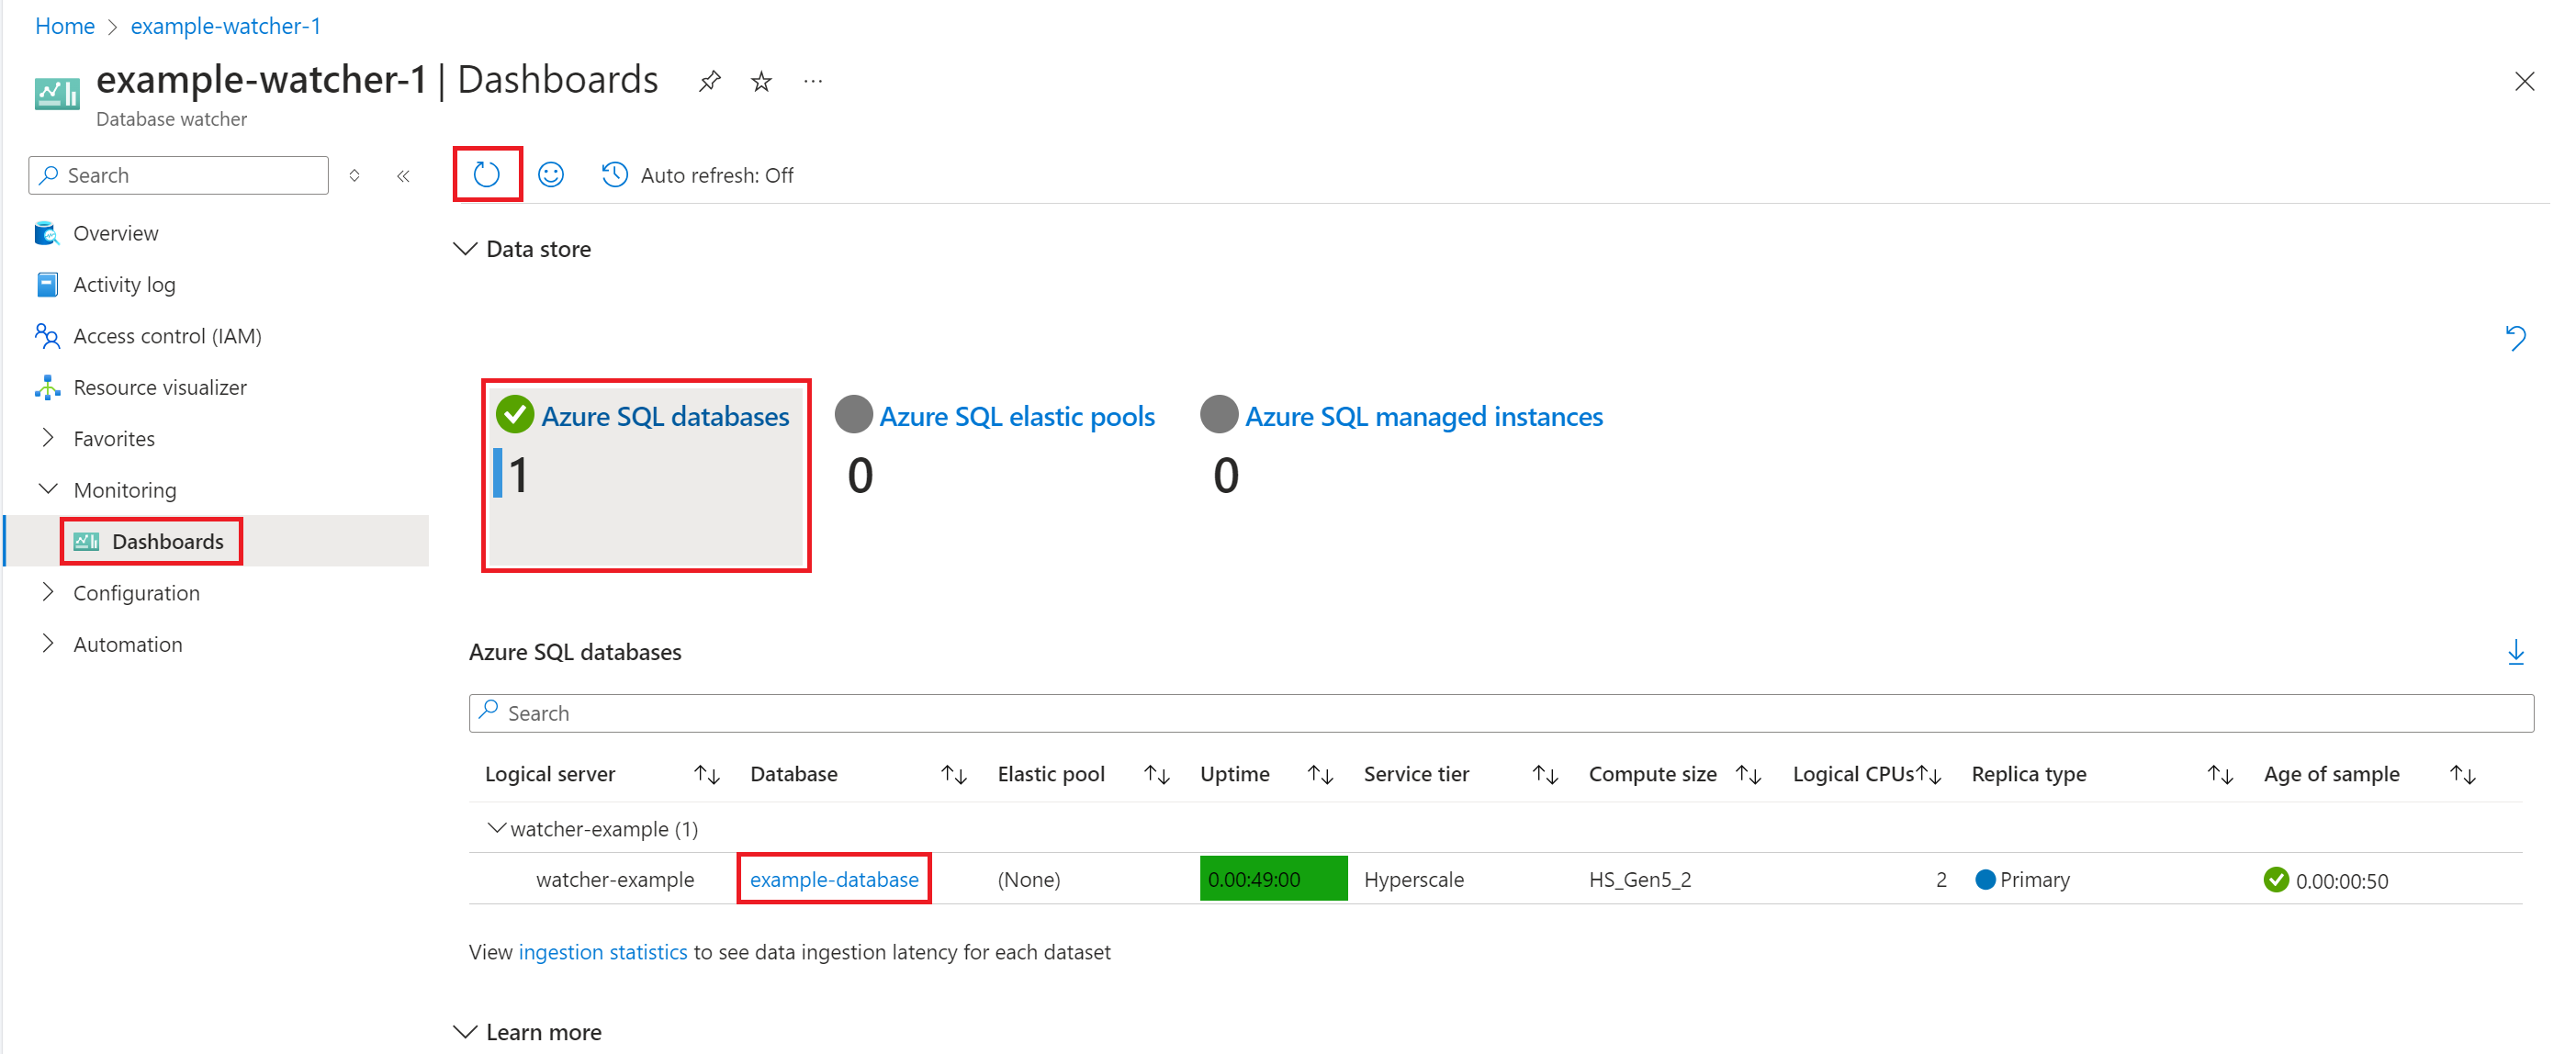
Select Dashboards. Refresh the dashboard if the resources do not appear yet.
Once the SQL target appears on the corresponding tile, select the tile, and select the link to the database, elastic pool, or SQL managed instance to open its monitoring dashboard. You can also select the link on the tile to open the estate dashboard that shows all monitored Azure SQL resources.


For a more detailed description of database watcher setup and configuration, see Create and configure a database watcher. You'll learn how to use a database on an existing Azure Data Explorer cluster, on a free Azure Data Explorer cluster, or in Real-Time Analytics in Microsoft Fabric, how to use SQL authentication, how to manage watcher access to SQL targets and the data store, and how to scale and manage your Azure Data Explorer cluster over time.
Related content
Feedback
Coming soon: Throughout 2024 we will be phasing out GitHub Issues as the feedback mechanism for content and replacing it with a new feedback system. For more information see: https://aka.ms/ContentUserFeedback.
Submit and view feedback for