Configure the self-hosted integration runtime (SHIR) for log analytics collection
APPLIES TO:  Azure Data Factory
Azure Synapse Analytics
Azure Data Factory
Azure Synapse Analytics
Tip
Try out Data Factory in Microsoft Fabric, an all-in-one analytics solution for enterprises. Microsoft Fabric covers everything from data movement to data science, real-time analytics, business intelligence, and reporting. Learn how to start a new trial for free!
Prerequisites
An available Log Analytics workspace is required for this approach. We recommended you note down the workspace ID and authentication Key of your Log Analytics workspace as you might need it for certain scenarios. This solution will increase the data that will be sent to the Log Analytics workspace and will have a small impact on overall cost. Read on for details on how to keep the amount of data to a minimum.
Objectives and scenarios
Centralize the events and the performance counter data to your Log Analytics workspace, first the virtual machine hosting the SHIR must be appropriately instrumented. Choose between two main scenarios below.
Instrumenting on-premises virtual machines
The article Install Log Analytics agent on Windows computers describes how to install the client on a virtual machine typically hosted on-premises. This can be either a physical server or a virtual machine hosted on a customer managed hypervisor. As mentioned in the prerequisite section, when installing the Log Analytics agent, you'll have to provide the Log Analytics workspace ID and Workspace Key to finalize the connection.
Instrument Azure virtual machines
The recommended approach to instrument an Azure virtual machine based SHIR is to use virtual machine insights as described in the article Enable VM insights overview. There are multiple ways to configure the Log Analytics agent when the SHIR is hosted in an Azure virtual machine. All the options are described in the article Log Analytics agent overview.
Configure event log and performance counter capture
This step will highlight how to configure both Event viewer logs and performance counters to be sent to Log Analytics. The steps described below are common regardless of how the agent was deployed.
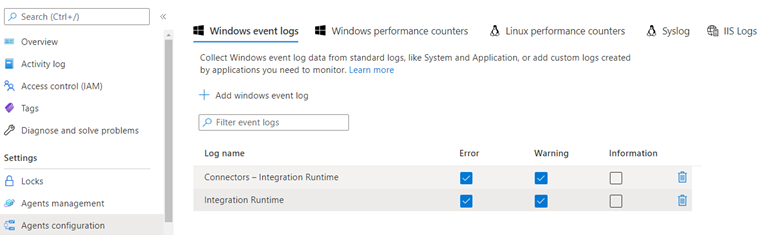
Select event viewer journals
First you must collect event viewer journals relevant to the SHIR as described in the article Collect Windows event log data sources with Log Analytics agent in Azure Monitor.
It's important to note that when choosing the event logs using the interface, it's normal that you won't see all journals that can possibly exist on a machine. So, the two journals that we need for SHIR monitoring won't show up in this list. If you type the journal name exactly as it appears on the local virtual machine, it will be captured and sent to your Log analytics workspace.
The event journal name we must configure are:
- Connectors - Integration Runtime
- Integration Runtime
Important
Leaving the Information level checked will increase the volume of data significantly if you have many SHIR hosts deployed and a larger number of scans. We strongly suggest you keep only Error and Warning.
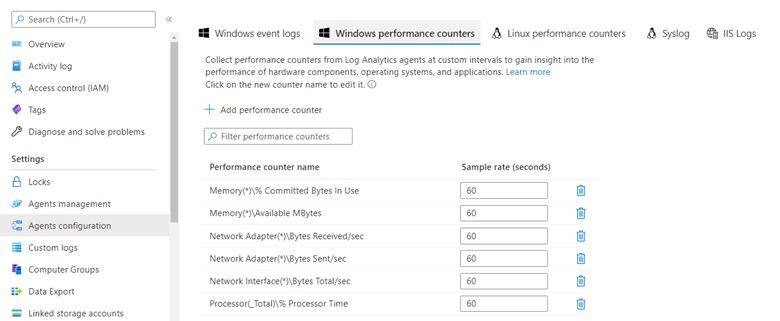
Select Performance counters
In the same configuration pane, you can click on Windows Performance Counters to select individual performance counters to send up to log analytics.
Important
Keep in mind that performance counters are, by their nature, a continuous data stream. Therefore, it’s crucial that you consider the impact of data collection on the total cost of your Azure Monitor/Log Analytics deployment. Unless an allowed data ingestion budget has been granted and a constant ingestion of data has been allowed and budgeted for, gathering performance counters should only be configured for a defined period to establish a performance baseline.
In the interface, when first configuring it, a suggested counter set will be recommended. Select those that apply to the type of performance analysis you want to perform. %CPU and Available memory are commonly monitored counters but others like Network bandwidth consumption can be useful in scenarios where the data volume is large, and bandwidth or execution time are constrained.
View Events and Performance counter data in Log Analytics
Consult this tutorial on How to query data in Log Analytics. The two tables where the telemetry is saved are called Perf and Event respectively. The following query will check the row count to see if we have data flowing in. This would confirm if the instrumentation described above is working.
Sample KQL queries
Check row counts
(
        Event
        | extend TableName = "Event"
        | summarize count() by TableName
)
| union
(
        Perf
        | extend TableName = "Perf"
        | summarize count() by TableName
)
Query events
Retrieve the first 10 event rows
Event
| take 10
Retrieve the event count by message severity
Event
| summarize count() by EventLevelName
Render a pie chart of count by message severity
Event
| summarize count() by EventLevelName
| render piechart
Retrieve all errors with a particular text string
Here we are searching for all messages that have the word disconnected in them.
Event
| where RenderedDescription has "disconnected"
Multi-table search for a keyword without knowing the schema
The search command is useful when one does not know which column the information is contained in. This query returns all rows from the specified tables that have at least one column that contains the search term. The word is disconnected in this example.
search in (Perf, Event) "disconnected"
Retrieve all events from one specific log journal
In this example we’re narrowing the query to the log journal called Connectors - Integration Runtime.
Event
| where EventLog == "Connectors - Integration Runtime"
Use timespans to restrict query results
This query uses the same query as above but restricts results to those occurring 2 days ago or more recently.
Event
| where EventLog      == "Connectors - Integration Runtime"
  and   TimeGenerated >= ago(2d)
Query performance counter data
Retrieve the first 10 performance counter readings
Perf
| take 10
Retrieve a specific counter with time constraints
Perf
| where     TimeGenerated >= ago(24h)
        and ObjectName    == "Network Adapter"
        and InstanceName  == "Mellanox ConnectX-4 Lx Virtual Ethernet Adapter"
        and CounterName   == "Bytes Received/sec"
Performance counters are hierarchical in nature, so be mindful to have enough where predicates in your query to select only the specific counter you need.
Retrieve 95th percentile for a given counter binned by 30 minute slices of the last 24 hours
This example is all the counters for a specific network adapter.
Perf
| where     TimeGenerated >= ago(24h)
        and ObjectName    == "Network Adapter"
        and InstanceName  == "Mellanox ConnectX-4 Lx Virtual Ethernet Adapter"
| project TimeGenerated, Computer, ObjectName, InstanceName, CounterName, CounterValue
| summarize percentile(CounterValue, 95) by bin(TimeGenerated, 30m), Computer, ObjectName, InstanceName, CounterName
Use variables for code reusability
Here we are making the object name and counter name a variable so we do not have to change the KQL query body to make changes to those selections later.
let pObjectName  = "Memory"; // Required to select the right counter
let pCounterName = "Available MBytes"; // Required to select the right counter
Perf
| where Type == "Perf" and ObjectName == pObjectName and CounterName == pCounterName
| project TimeGenerated, Computer, CounterName, CounterValue
| order by TimeGenerated asc
| summarize Value=max(CounterValue) by CounterName, TimeStamps=TimeGenerated
Related content
Feedback
Coming soon: Throughout 2024 we will be phasing out GitHub Issues as the feedback mechanism for content and replacing it with a new feedback system. For more information see: https://aka.ms/ContentUserFeedback.
Submit and view feedback for