Note
Access to this page requires authorization. You can try signing in or changing directories.
Access to this page requires authorization. You can try changing directories.
The following AI/BI features and improvements were released in 2025.
Note
Releases are staged. Your Azure Databricks account might not be updated until a week or more after the initial release date.
December 2025
Dashboard enhancements and fixes
December 18, 2025
- Boolean alias formatting: Boolean values now support alias formatting, allowing users to replace "true" and "false" with custom strings.
- Compact global filters: Reduced the size of global filters to save space.
- Relative date range options: Relative date range filters now include yesterday, last week, last month, and last year.
- Filter widget background fix: Fixed an issue where a gray background appeared on some filter widgets.
- Filter reset button fix: Fixed an issue where the "Reset to default" button appeared on the active filter bar when all filters showed default values.
- Custom chart labels: You can now choose a custom field for chart labels. See Value labels.
- Sortable filter dropdown options: Authors can now sort filter dropdown options by another field.
- Multi-select filter paste: Viewers can now copy a column of values from a spreadsheet and paste them into a multi-select filter.
- Chart tooltip overflow indicator: Chart tooltips with many series now indicate when there are more series.
- Axis label spacing fix: Fixed an issue where long axis labels took up too much plotting area.
- Agent-created widget consistency: Agent-created widgets now work consistently across edit and published dashboards.
- Mark label angle fix: Fixed mark label angle for charts with multiple Y axes without an X axis.
Genie enhancements and fixes
December 18, 2025
- Numeric column formatting: Numeric columns in tables are now formatted more effectively, including IDs, ZIP codes, and currency.
- File upload fix for CAN MANAGE users: Fixed an issue where CAN MANAGE users couldn't use the upload file feature.
- Entity matching indexing improvements: Entity matching (previously value dictionaries) now scans up to 100 million rows (previously 100,000 rows) to detect up to 1024 unique values. This significantly improves unique-value coverage and better matches user prompts.
Dashboard visualization enhancements and fixes
December 11, 2025
- Sort by hidden measure fields: Users can now sort charts by a different measure field that does not visually appear on the bar chart. See Format axis settings.
- Map legend position control: Authors can now change map legend positions.
- Safari cross-filtering fix: Fixed an issue where cross-filtering was not working in Safari.
- Counter visualization text: Removed automatic "vs" text from counter visualizations.
- Range filter spacing: Added spacing between minimum and maximum values in range filters when the slider bar is hidden.
- Dashboard subscriptions to Microsoft Teams channels (Public Preview): AI/BI dashboards now support sending scheduled snapshots to Microsoft Teams channels. Teams can receive dashboard updates directly in their Teams workspace, including a PNG image snapshot, a direct link to open the dashboard in Azure Databricks, and a PDF attachment. See Configure Microsoft Teams notifications.
Genie enhancements and fixes
December 11, 2025
- Service Principal monitoring display: The user column in the Monitoring page now shows the Service Principal ID when a service principal is used, instead of displaying as empty.
- Genie API suggested questions fix: Fixed an issue where messages sent through the API didn't return suggested questions.
- Genie Research Agent (Beta) architecture update: Research Agent (Beta) now has a single reasoning agent that generates hypotheses and SQL. This helps Research Agent follow instructions more effectively, produce more concise reports, and deliver answers with lower latency.
Dashboard visualization enhancements and fixes
December 4, 2025
- Individual series labels: You can now enable labels for individual series, instead of all series on the dashboard at once.
- Fixed download format options: Resolved an issue where dashboard downloads only showed PNG format instead of multiple file formats (CSV, TSV, and Excel).
Genie Research Agent, benchmark, and answer improvements
December 4, 2025
- Improved clarifying questions: Genie's ability to ask clarifying questions in cases of semantic ambiguity in the user's prompt has been improved.
- Streamlined Research Agent: The Research Agent (Beta) experience has been streamlined by simplifying the thinking trace and moving hypothesis evaluations into a sidebar for easier review.
- Benchmark error explanations: Benchmarks now include an LLM explanation of what was incorrect in the Genie generated answer.
- Improved answer readability: When the answer summary contains all of the details in the query result, the query result table is automatically collapsed to improve readability.
- Better instruction following: Genie now more effectively follows text instructions on how to format answer summaries to common questions.
November 2025
Dashboard visualization enhancements
November 27, 2025
- Improved pivot table performance: Pivot table headers now render significantly faster with reduced scroll lag.
Genie space limits and Research Agent improvements
November 27, 2025
- Increased SQL snippets and JOIN relationship limit: The limit for SQL snippets and
JOINrelationships in a Genie space has been increased to 200. - Research Agent starter questions: Research Agent (Beta) now displays starter questions to help users begin their data exploration.
- Auto-suggested benchmarks: Genie now automatically suggests benchmarks based on the space context to help authors build evaluation sets.
- Fixed knowledge store permissions: Resolved an issue where users with CAN EDIT permissions couldn't manage Genie knowledge store column descriptions and entity matching (previously value dictionaries).
Dashboard visualization improvements and bug fixes
November 20, 2025
- Counter visualization improvements: You can now use counters to track and compare metrics over time and show sparklines. To create a counter with a sparkline, select a main value and a date column. See Counter visualization.
- Configure filter application behavior: Dashboards now support applying multiple filters at the same time alongside the default instant application. See Configure filter application behavior.
- Fixed data label positioning: Resolved an issue where data labels were sometimes half above and half below bars on bar charts.
- Fixed label color legibility: Resolved an issue where label color was not legible against all background colors.
Genie APIs and Research Agent in Beta
November 20, 2025
- Genie Create and Update APIs in Beta: Genie Create and Update APIs have been released to Beta. Get API has been updated to allow users to retrieve a serialized definition of the Genie space. See the Genie API.
- Research Agent in Beta: Research Agent extends Genie's capabilities to help you uncover deeper insights and tackle complex business questions using multi-step reasoning and hypothesis testing. See Agent mode in Genie spaces.
Draft dashboards removed from Databricks One
November 20, 2025
Draft dashboards no longer displayed: Only published dashboards are now visible in Databricks One. This change ensures business users see finalized content that is relevant and reliable for their workflows.
Dashboard search and embedding enhancements
November 13, 2025
- Enhanced search functionality: Users can now search over dashboard names, page names, widget titles and descriptions, dataset names, and their queries. Dataset queries are searchable only from the workspace search bar.
- Ask Genie button for embedded dashboards: When viewers access dashboards configured with basic embedding, they can now access the Ask Genie button for dashboards published with an associated Genie space.
- Fixed browser window navigation issue: Resolved a bug where navigating to a different browser window and back to the dashboard caused the dashboard to display no data.
Genie navigation and accuracy improvements
November 13, 2025
- Fixed back navigation error: Resolved a bug where clicking the browser back button while viewing a Genie space would result in an error.
- Fixed entity matching documentation link: Fixed a broken link to the description of entity matching (previously value dictionaries).
- Improved column selection: Genie now optimizes column selection to provide more columns with higher relevance while efficiently managing context consumption.
Dashboard filter and counter enhancements
November 6, 2025
- Per-widget filter enhancements: Per-widget filters now support date ranges, relative date ranges, and number filters.
- Metric view metadata support: AI/BI dashboards now consume Unity Catalog metadata from metric views, including formatting and display name.
- Horizontal chart scrollbars on hover: Scrollbars for horizontal charts now show on hover.
- Fixed custom calculations display in draft mode: Resolved an issue where visualizations using custom calculations were not displaying in draft mode.
- Fixed Slack notification OAuth token field: Resolved a bug where the OAuth token field appeared pre-filled with placeholder text despite no prior token being provided for dashboard subscription Slack notifications.
Genie visualization and query result improvements
November 6, 2025
- Text explanations for empty results: Genie now includes text explanations of query results when query results are empty.
- Improved auto-generated charts: Visualizations now use query result metadata for higher-quality auto-generated charts.
- Improved date formatting: The process for formatting date results in visualizations has been improved.
October 2025
Dashboard visualization, pivot table, and authoring improvements
October 30, 2025
- Dashboard subscriptions to Slack channels: Dashboard authors can now add Slack channels as subscribers to a scheduled dashboard refresh. See Subscribe a Slack or Microsoft Teams channel.
- Top N scroll bar behavior: The scroll bar on top N visualizations now appears only on mouseover for a cleaner interface.
- Legend placement options: You can now place legends at the top and left of visualizations in addition to existing placement options. See Customize chart elements.
- Cut, copy, and paste filters: Authors can now cut or copy filters from the canvas. To paste them into the global panel, right-click an empty space and select Paste. See Use dashboard filters.
- Labels match Y-axis formatting: Labels now default to the same format as the Y-axis, showing 2 decimal places by default and handling small values better.
- Export to materialized view: Authors can now generate a materialized view from any dataset on their dashboard for improved performance and more efficient refresh and execution. To access this feature, click the kebab menu next to a dataset, then select Export to Materialized View. See Create and manage dashboard datasets and Materialized views.
- Pivot table improvements: See Pivot table configuration.
- Authors can add links to text in pivot tables by specifying a URL path in the Actions tab of pivot table values.
- Pivot table header values are now sticky and remain on screen while scrolling.
- Users can conditionally set the text color in pivot tables.
- Duplicative audit log events: Dashboards with companion Genie spaces no longer emit duplicative
getPublishedDashboardevents in audit logs.
Genie thinking steps and benchmark error resolution
October 30, 2025
Genie thinking steps in plain language: Genie thinking steps now explain SQL logic in plain language to help non-technical users understand and build trust in how answers are generated.
Asset preview in selection dialog: When selecting tables or views in the Select an asset dialog, you can now hover over an asset to preview its schema and metadata, including the owner and last updated time. This helps you quickly identify the right data source for your Genie space.
Fixed benchmark service principal error: Resolved a bug where running benchmarks would occasionally return a service principal credential error.
Dashboard publishing, scheduling, and field management improvements
October 23, 2025
- Notify viewers disabled by default for dashboard publishing: When publishing dashboards, the Notify viewers option is now turned off by default to reduce unintended notifications. See Publish a dashboard.
- New functions for custom calculations: Custom calculations now support over 170 functions. See Custom calculation function reference.
- Drag-and-drop field reordering in visualizations: Authors can now drag to reorder fields when creating some visualizations such as Pivot and Line charts.
- Waterfall visualization type: Waterfall charts are now available for dashboards. See Waterfall chart.
Genie benchmark scaling and SQL function support
October 23, 2025
- Increased benchmark limit: The maximum number of benchmarks you can add to a Genie space has been raised from 100 to 500.
- Run benchmarks selectively: You can now select a subset of benchmark questions to start a run from either the benchmark list page or from a previous benchmark result. See Review individual evaluations.
- Unity Catalog SQL functions as benchmark answers: You can now add Unity Catalog SQL functions as gold standard answers to benchmarks for more comprehensive testing.
Dashboard pivot tables, gridlines, and drill-through enhancements
October 16, 2025
- Dynamic text functions in pivot tables: Pivot tables now support
contains(),startswith(), andendswith()functions for conditional formatting. See Conditional formatting with text functions. - Gridline toggle: Charts now support toggling gridlines on and off. See Gridlines
- Dashboard tags and certification in Public Preview: You can now add tags to dashboards and Genie spaces to improve organization across your workspace. Tags can be used for automation. For example, you can tag a dashboard as Work in progress, and an overnight process can automatically retrieve all dashboards with that tag using the API and assign them to the temporary warehouse until they're tagged as Certified. Search is not supported using dashboard tags. See Manage dashboard tags and Add tags.
- Drill-through without target filters: Drill-through now filters any visualization based on the same dataset as the source selection without an explicit target filter. If a target filter exists, it is still applied. See Use drill through to filter data.
- Fixed discarded dashboard API error: APIs now return
404 NOT_FOUNDinstead of403 PERMISSION_DENIEDwhen accessing dashboards in the trash.
Genie API updates, benchmark explanations, and JOIN improvements
October 16, 2025
- JOIN relationship discovery improvements: You can now sort
JOINrelationships and SQL snippet definitions for easier management. - API endpoints moving to Public Preview: The following Genie API endpoints are moving from Beta to Public Preview: list conversation messages, delete conversation message, and send thumbs up/down feedback.
- Benchmark result explanations: Benchmark results now include an explanation for why a result was rated incorrect.
- SQL execution result summaries: Genie now automatically generates summaries of SQL execution results to make responses more natural and easier to interpret.
- SQL measures in knowledge stores: Users can now add SQL measures to a space's knowledge store, along with filters and dimensions, to guide Genie in generating specific SQL expressions. See Build a knowledge store for more reliable Genie spaces.
- Fixed permissions messaging: Messaging for users with CAN RUN or CAN VIEW permissions has been corrected to accurately reflect their capabilities in the monitoring and data tabs.
- Workspace asset tagging support: Genie spaces are now included in the workspace asset tagging public preview.
AI/BI dashboard table and text widget improvements
October 9, 2025
- Adjustable line thickness in line charts: You can now control the thickness of lines in line charts. If no series are specified in the size area, the slider changes all line thickness uniformly. If series are specified, you can set different thickness values for each series, similar to different size circles in scatter charts.
- Copy link URLs from tables: You can now copy link URLs directly from table visualizations.
- Improved pivot row headers: Row header field names in pivot tables no longer overflow and now scroll together with row values.
- Improved handling of the
<character in text widgets: Fixed an issue where the<character would sometimes disappear or delete adjacent characters after re-clicking a text widget. - Improved precision for custom calculations: Aggregate functions now support the
DISTINCTkeyword and theFILTER(WHERE ...)clause. Use them to count unique entities and perform conditional aggregation, replacing complexCASEstatements. See Aggregate functions. - Additional predicate support for custom calculations: Custom calculations now support
IN,BETWEEN, and pattern matching predicates (LIKE,ILIKE,RLIKE) for more flexible filtering and comparison operations. See Boolean functions and operators.
Genie knowledge store enhancements and benchmark improvements
October 9, 2025
- Easier benchmark generation:
- Space editors can save representative messages or SQL answers from chat conversations to benchmark questions. See Other response actions.
- Space editors can generate benchmark SQL answers after entering a benchmark text question. See Add benchmark questions.
- Accurate Genie answers from one benchmark result can now be saved to update future benchmark sets. See Review individual evaluations.
- Improved performance and latency: Genie's internal reasoning process has been simplified, slightly improving overall latency and streamlining context for SQL generation.
AI/BI dashboard enhancements and global filters improvements
October 2, 2025
- Fixed global filters panel overflow: Resolved an issue where the global filters panel extended beyond its intended width.
- Access for account-level users: Users without a workspace can now access dashboards shared with them that were published without embedded credentials. See What are shared data permissions?.
- Preview fields and measures for metric views: Authors can now preview available fields and measures for metric views in the Add data dialog.
- Query insights in the dashboard dataset editor: Query insights are now available in the dashboard dataset editor to help analyze query performance.
- Copy and paste widgets and pages: Dashboard widgets and pages can now be copied and pasted between dashboards.
- Top or bottom N categories in bar charts: Bar charts can now display the top or bottom N categories. To edit, open the kebab menu for the categorical axis dimension and set the number under Default number of categories.
Semantic metadata support for metric views
October 2, 2025
You can now define semantic metadata in a metric view. Semantic metadata helps AI tools such as Genie spaces and AI/BI dashboards interpret and use your data more effectively.
To use semantic metadata, your metric view must use YAML specification version 1.1 or higher and run on Databricks Runtime 17.3 or above. The corresponding Databricks SQL version is 2025.30, available in the Preview channel for SQL warehouses.
See Agent metadata in metric views and Upgrade considerations.
Genie space enhancements and thinking trace features
October 2, 2025
- Add tables and metric views to spaces: Users can now add tables and metric views to a space and analyze them together.
- Benchmarks scoring improvement: Benchmarks now treat extra rows or columns in Genie's output as incorrect. See Interpret ratings.
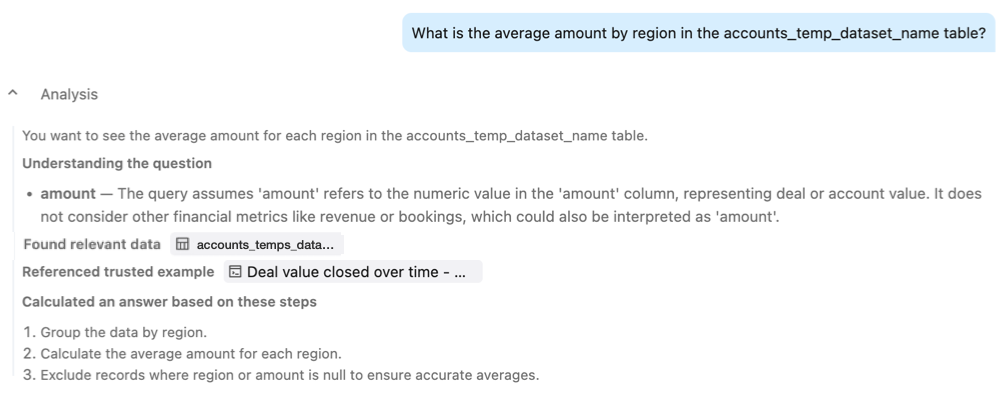
- Thinking steps in responses: Each Genie response now includes thinking steps that show how the prompt was interpreted, along with the tables and example SQL statements that were used. See Review a response.
September 2025
AI/BI dashboard global filters panel improvements
September 25, 2025
- Global filters panel expanded by default: The global filters panel now opens by default when users first visit a dashboard to improve discoverability. On subsequent visits, the panel preserves the user's last setting.
Genie benchmarks and JOIN relationship enhancements
September 25, 2025
- Benchmarks run in the background: Benchmarks now run as background tasks. Users can start a run without blocking their workflow.
- Checkmark for accepted JOIN relationships: Accepting extracted JOIN relationships now displays a checkmark to confirm acceptance.
- Improved benchmarks accessibility: Benchmarks are now available from the top-line toolbar for easier access.
- Notifications for benchmarks: A notification now encourages users to run benchmarks after making changes to instructions.
AI/BI dashboard Genie integration and publish dialog improvements
September 18, 2025
- Genie credential handling for embedded dashboards: Genie integrated with dashboards published with embedded credentials now runs generated queries using the publisher's data credentials. Dashboards published without embedded credentials continue running using the viewer's data credentials.
- Simplified publish dialog: The dashboard publish dialog has been redesigned and simplified. The toggle for Genie integration has been moved to dashboard settings.
Genie SQL improvements, API enhancements, and bug fixes
September 18, 2025
- Upgraded large language models (LLMs): The LLMs used by Genie to author SQL have been upgraded for improved accuracy and performance.
- SQL autocomplete: Autocomplete is now available when editing Genie SQL to help users write queries more efficiently.
- Feedback API endpoints: Thumbs up and thumbs down feedback API endpoints are now available for collecting user feedback on Genie responses.
- Suggested follow-up questions API: Suggested follow-up questions through the API are now available. See Get message.
- Consumer entitlement API access: Users with the workspace consumer entitlement can now use the API suite.
- Warehouse ID in API responses: GET API requests for Genie spaces now include the
warehouse_idattached to the space.
AI/BI dashboard text widget and performance improvements
September 11, 2025
- Improved text widget editor: The dashboard text widget now has an enhanced UI for formatting text, adding links, and inserting images.
- Fixed performance regressions: Resolved issues that caused performance slowdowns, including pages failing to load and URL parameters applying incorrectly.
Genie chart fixes and feature enhancements
September 11, 2025
- Fixed thin bars on binned date charts: Resolved an issue where very thin bars appeared in bar charts with binned dates.
- Fixed single-point maps: Point maps now render correctly even when only a single point is present.
- Increased entity matching limit: Spaces can now include up to 120 entity matching (previously value dictionary) columns. Newly created spaces automatically select 120 columns. For existing spaces, authors can configure settings to add more. See Configure entity matching.
- Improved accuracy for percentage questions: Genie now returns more accurate results for percentage-type queries, such as conversion rates, with correct rounding to two digits.
- Fixed unsaved instruction warning: The warning dialog for unsaved instruction changes now dismisses correctly.
- Fixed cloning issue for spaces with 100 instructions: Spaces containing 100 instructions can now be cloned successfully.
- Space ID field in settings: A new field in the settings page lets users directly copy the Genie space ID for use in building Genie space agents.
- Upload files in Public Preview: Workspace admins can now manage the Genie - Upload File feature from the previews page. See Upload a file.
AI/BI dashboard active filter bar and visualization improvements
September 4, 2025
- Active filter bar: A new filter bar shows all active filters on a dashboard. Any filter (global or page-level) not set to All, as well as any cross-filtering, appears in this bar.
- Minimum and maximum aggregations for date fields: Date fields now support minimum and maximum aggregations.
- Improved histogram labels: Histograms now display both the start and end of each bin, instead of only the start.
New Genie API endpoints and improved benchmarks
September 4, 2025
New API endpoints: The following new endpoints are available for managing and analyzing conversations:
For more guidance, see Best practices and limits.
Prompt matching is generally available: Prompt matching (previously value sampling) is now generally available. Prompt matching improves Genie's ability to translate user prompts into the right column and row values by providing format assistance and entity matching for eligible columns. See Prompt matching overview.
Unified permission APIs: Genie now uses the Databricks Permission APIs. See Permissions.
Improved Benchmarks evaluation: The evaluation function now classifies results more flexibly. For more information, see Interpret ratings.
August 2025
Dashboard external embedding Public Preview and new custom calculations functions
August 28, 2025
- Custom calculation functions: Support added for
ln,log,log10, androundfunctions. See What are custom calculations?. - Custom calculations limit increase: You can now define up to 200 custom calculations per dataset.
- Embedding for external users in Public Preview: Embedding dashboards for external users is now available in Public Preview. See Embedding for external users.
- Multi-y charts with apostrophes in column names: Labels now render correctly when column names include apostrophes.
- Custom tooltips for pie charts: Pie charts now support custom tooltips.
- Fixed page and dataset renaming: An issue that prevented users from renaming pages and datasets has been resolved.
Genie follow-up questions and fixes
August 28, 2025
- Fixed cloning issue for large spaces: Spaces with a large number of instructions can now be cloned successfully.
- Fixed CSV download issue on Windows: Downloaded query result files now open reliably on Windows.
Dashboard sorting and formatting improvements
August 21, 2025
Fixed sorting on temporal categorical axes: Resolved an issue where sorting did not work correctly on temporal categorical axes.
Numeric formatting as Bytes: Users can now format numeric values as Bytes.
Totals in histogram tooltips: Histograms now display totals in tooltips.
Axis gridlines respect custom background colors: Gridlines now automatically update based on custom color palette selections for background color.
Genie SQL validation and space management
August 21, 2025
SQL expression validation for join relationships: Added validation logic to help authors write correct SQL join relationships. If a join statement contains errors, the validation logic flags them.
Fixed cloning issue for spaces: Resolved a bug where cloned spaces did not correctly copy over the associated tables.
Dashboard table visualization and chart improvements
August 14, 2025
Indicator for calculated measures in table editor: Added an indicator in the table visualization editor to show when calculated measures are not displayed in the table.
Fixed transparent headers in light mode: Resolved a bug where table visualization headers appeared transparent in light mode.
Fixed pivot table column width retention: Resolved an issue where custom column widths in pivot table visualizations were not retained after subsequent edits.
Measure fields appear before dimension fields: In the visualization field picker, measure fields now appear before dimension fields.
Funnel chart support in AI/BI dashboards: Funnel charts are now supported in AI/BI dashboards. See Funnel chart.
Genie interface and file upload enhancements
August 14, 2025
Fixed off-screen color ramp editor in Genie: Resolved a bug where the color ramp editor was hidden off-screen.
Improved file upload security and setup in Genie: File uploads are now accessible only to the users who uploaded them. Setup is simplified to automatically designate the catalog and schema where the file is stored. See Upload a file.
Dashboard theme improvements
August 4, 2025
- Updated selection color in Terra theme: The selection color in the Terra theme has been updated to improve visibility.
Genie join relationships and data handling enhancements
August 4, 2025
Local join relationships in Genie space knowledge stores: You can now define join relationships locally within a Genie space's knowledge store. This is useful when authors lack permissions to define primary and foreign keys on upstream tables or when the join relationship has specific requirements, such as one-to-many or complex joins. See Add SQL examples and instructions.
Fixed saving issue for example SQL statements: Resolved a bug where example SQL statements were not saving after clicking Save.
Improved entity matching selection: Entity matching (previously value dictionaries) now selects the most frequent 1024 values from the first 100k rows, instead of the first 1024 values encountered.
Improved CSV download file naming: Downloaded CSV file names no longer include special characters (
< > : " / \ | ? *). These characters are now replaced with underscores to ensure compatibility when opening files.Bulk actions for showing or hiding columns: Added bulk actions that let you show or hide multiple columns at once in Genie spaces. See Hide or show relevant columns.
July 2025
Sankey visualization and table formatting improvements
July 31, 2025
Display name support for Sankey visualizations: Sankey charts now support display names for nodes.
Fixed duplicate
$signs in table formatting: Resolved an issue where table visualizations sometimes displayed duplicate dollar signs.
Genie CSV downloads and caching enhancements
July 31, 2025
Fixed
NULLvalue handling in downloaded CSVs: Genie no longer replacesNULLvalues with the stringundefinedwhen downloading CSV files.Improved caching of Genie space context: Caching enhancements speed up question performance when starting a new Genie session.
Fixed incorrect access to Genie file upload feature: The file upload feature is now restricted to customers who have opted into the Public Preview as intended.
Dashboard performance optimizations and feature enhancements
July 24, 2025
Metric views dataset performance improvement: The dataset result table view for Metric views has been removed to reduce query executions and improve performance.
Undo and redo support: Authors can now undo and redo actions on the canvas using keyboard shortcuts or the toolbar.
Metric views filtering in data dialog: Within the Add data dialog, authors can now filter to show only metric views.
Dashboard header menu reorganization: The kebab menu
 in the dashboard header has been reorganized for improved usability.
Choropleth maps PNG download: Choropleth maps now support download to PNG format.
Axis label rotation: Non-categorical axes now support label rotation for better readability.
AGGREGATE OVERsupport in custom calculations: Custom calculations now supportAGGREGATE OVERto enable window function-like behavior, such as computing moving averages and running totals. See What are custom calculations?.
Genie column selection and query improvements
July 24, 2025
Improved column selection accuracy: Genie's ability to choose relevant columns based on user prompts has been improved, especially when the prompt contains a specific column value.
Cross-geo processing error fix: Resolved an issue where customers based in Australia would receive a cross-geo processing error.
Query execution timeout: Genie now automatically cancels query executions that take longer than 15 minutes to execute.
Entity matching refresh fix: Resolved an issue with long-running entity matching (previously value dictionary) addition and refresh operations.
New workflow for creating metric views from dashboards
July 17, 2025
- Create a metric view from a dashboard dataset: Authors can now promote a dashboard dataset to a metric view using the AI/BI dashboard data tab. See Export as a metric view.
Genie user experience and evaluation improvements
July 17, 2025
Feedback labels remain visible across conversation redirections: Feedback labels added to earlier messages now remain visible after users ask follow-up questions.
Editable parameters supported for date and numeric fields: Genie now allows editable parameters on
dateandnumericfields, expanding beyond previous support for string fields.Revamped response explanations: Response explanations are now more concise and easier to read.
Improved result classification for benchmark evaluations: The evaluation function more accurately classifies results as Good or Bad, especially when Genie returns empty results or omits data found in the example SQL output.
Improved date boundary handling for year-over-year questions: Genie now includes the correct range of data. For example, when calculating year-over-year growth between 2022 and 2024, Genie considers data from 2021 through 2024.
Dashboard visualization updates
July 10, 2025
- Area chart error message fix: Fixed an error message that appeared when using disaggregated stacked area charts.
- Point map visualization UI update: Swapped the latitude and longitude sections in Point Map visualizations.
Genie interface, query, and data improvements
July 10, 2025
- Editable filters displays multiple values: Editable filters now display multiple values when Genie generates a SQL filter clause that includes more than one filter value.
- Edit space descriptions: You can now edit Genie space descriptions directly in place.
- SQL query recommendation: Genie now suggests popular SQL queries that come from notebooks. Previously, only popular SQL query objects were suggested.
- Faster entity matching identification: Entity matching (previously value dictionaries) now identifies unique values faster.
Dashboard theme settings and page enhancements
July 3, 2025
Dashboard import and export retains theme settings: When you import or export a dashboard as a file, theme settings are now preserved. To learn how to set a theme, see Theme settings.
Dashboards now support up to 15 pages: The maximum number of pages per dashboard has increased from ten to fifteen. See Author dashboards.
Annotation lines supported for temporal scales: You can now add annotation lines to charts with temporal scales.
Parameterized schedules re-enabled: Support for parameterized schedules has been restored. See Create a schedule.
Genie visualization and permissions improvements
July 3, 2025
- Genie visualizations respect SQL sort order: Genie visualizations now default to the same sort order as returned by the SQL query.
- Permissions fix: Users with CAN MANAGE on a Genie space can now delete it.
- Datatype interpretation fix: Resolved an issue where string fields were incorrectly interpreted as date or time values.
June 2025
Dashboard Git integration and workflow improvements
June 26, 2025
Improved diff review for dashboard files: When committing dashboard changes to Git, queries and text box content now appear across multiple lines in the diff, making changes easier to review.
Multi-statement queries in Genie on dashboards: Genie on dashboards now supports multistatement SQL queries.
Improved schedule and subscribe workflow: You can now add subscribers when setting up a new schedule. Previously, you could only add subscribers to an existing schedule. See Create a schedule.
Genie API enhancements and SQL function improvements
June 26, 2025
New Genie API endpoints in Public Preview: You can now use the Genie API to list all conversations in a space, delete conversations, and delete Genie spaces. See Genie in the REST API reference for details.
More selective application of SQL functions in Genie: Genie's ability to apply SQL functions to relevant user questions has been improved.
File upload and theme customization features
June 19, 2025
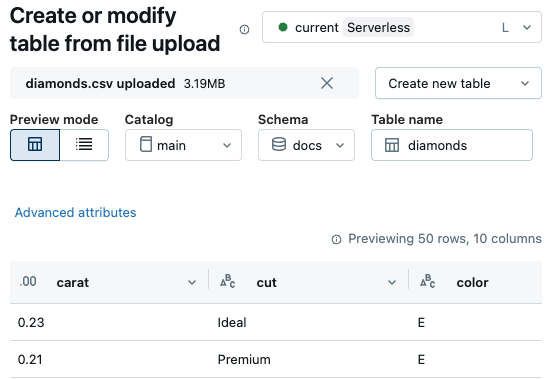
- File upload to Unity Catalog from dashboards: Authors can now upload files to Unity Catalog directly from the dashboard data tab. See Create and manage dashboard datasets.
- Customizable dashboard theme: Authors can now customize the dashboard theme by setting custom font, background, and widget colors. See Dashboard settings.
Genie filter editing and audit log enhancements
June 19, 2025
Editable filters in Genie: Users can now edit filter values to refine responses. For string columns that have entity matching (previously value dictionaries) enabled, Genie uses context to determine when editable filters could improve accuracy and offers them accordingly.
New audit log field for Genie comments: A new
comment_typefield is available in the audit log response for thecreateConversationMessageCommentaction. When a user adds a feedback comment to a conversation message, the interaction is recorded as one of the following types:REQUEST_COMMENT: User leaves a feedback comment.REVIEW_COMMENT: Tracks following comments, such as when a space author responds.THUMBS_DOWN_COMMENT: User clicks Fix it to get a new response.
List Spaces Genie API: A new List Spaces Genie API endpoint retrieves all spaces the requestor has access to, including the following fields: Genie space title, description, and ID.
Dashboard visualization fixes and schedule updates
June 12, 2025
Dashboard visualization fixes:
- Tooltip field highlighting in combo charts fix: Tooltips shown as you hover over fields in combo charts are now correctly highlighted.
- Table collapse icon fix: Fixed an issue where expanding and collapsing long text in table cells did not work as expected.
- Drop-down menu rendering fix: Fixed an issue where some drop-down menus rendered incorrectly.
Parameterized schedules temporarily disabled: Parameterized schedules have been temporarily disabled due to unexpected conflicts with some existing dashboard schedules.
Consumer access entitlement is generally available
June 5, 2025
- New consumer entitlement is generally available: Workspace admins can now grant consumer access as an entitlement to users, service principals, and groups. Consumer access enables limited workspace UI access, querying SQL warehouses using BI tools, and viewing dashboards with embedded or viewer credentials. See Manage entitlements and Share a dashboard.
Dashboard scheduling and filtering improvements
June 5, 2025
- Dashboard schedule fix: Resolved an issue where schedules for dashboards published with global filters were not executing.
- Cross-filtering fix for histograms: Fixed an issue where cross-filtering with histograms did not work on large datasets.
Genie entity matching and SQL editor improvements
June 5, 2025
More entity matching in Genie: Genie can now support up to 60 entity matching (previously value dictionary) columns. See Build a knowledge store for more reliable Genie spaces.
Genie space SQL editor fix: Resolved an issued that caused the SQL editor in a chat window disappear if the user deleted the generated query. You can now use the editor to delete and rewrite queries.
May 2025
Metric views are in Public Preview
May 29, 2025
- Unity Catalog metric views are now in Public Preview: Metric views provide a centralized way to define and manage consistent, reusable, and governed core business metrics. They abstract complex business logic into a centralized definition, enabling organizations to define key performance indicators once and use them consistently across reporting tools like dashboards, Genie spaces, and alerts. Use a SQL warehouse running on the Preview channel (2025.16) to work with metric views. See Unity Catalog metric views.
Dashboard catalog picker and filter fixes
May 29, 2025
- Catalog and schema picker in the dataset editor: You can now select a catalog and schema from the SQL editor in the Data tab of a draft dashboard. With the catalog and schema selected, you can write queries that reference a table name only, instead of a fully-qualified table name. You can still use a table's three-level namespace to reference it in a query.
- Fix for global filters on full-screen widgets: An issue that prevented full-screen widgets from displaying data when used with global filters has been resolved.
Genie knowledge store and metadata improvements
May 29, 2025
Benchmark execution bug fix in Genie: A bug where benchmarks would not execute immediately after creating a benchmark run has been fixed.
Popular query suggestions in Genie: Genie will now suggest popular queries as example SQL for newly added tables to the space. Only popular queries that the author has access to are suggested. See Create a Genie space.
Table metadata improvement in Genie: The process to provide table metadata to Genie has been changed to simplify data transformation for Genie workloads.
Genie knowledge store: The knowledge store allows authors to build more reliable, accurate Genie spaces. Authors can now annotate, edit, and manage Genie datasets at the space level using the following features:
- Increased accuracy with format assistance: Genie now provides format assistance (previously example values) when you add tables to a space, helping it better understand the data in your tables and generate more accurate responses. See Edit column metadata.
- Edit column descriptions in Genie: You can now edit table and column descriptions at the Genie-space level. This allows you to fine-tune metadata descriptions within a specific the Genie space. See Edit column metadata.
- Column synonyms support: You can now add column synonyms to help Genie interpret your data, making column descriptions easier to understand. See Edit column metadata.
- Hide unnecessary columns: You can now hide unnecessary columns from Genie to simplify the data model, without needing to create new UC assets. See Hide or show relevant columns.
Improved parameterized SQL query use in Genie: Genie's decision process for using parameterized SQL queries has been improved to better align its responses with the user's prompt.
Dashboard filter enhancements and visualization improvements
May 22, 2025
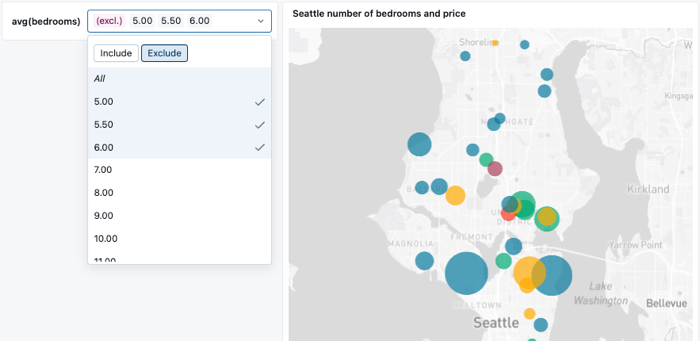
- Exclude selected values in filter widgets: Dashboard viewers can now include or exclude the values they select from multi-select filter widgets.
Drop-down selection fix: Fixed an issue where selection options in a drop-down list appeared out of order.
Global filters panel: Dashboard authors can now add filters to a global filters panel, which applies across all dashboard pages.
Relative date and time preview improvement: Previews for relative date and time controls are now hidden to avoid confusion caused by time zone differences.
Dashboard PDF snapshots improvement: Dashboard PDF snapshots now wrap the content of the dashboard and no longer include white space.
Constant reference line annotations: Horizontal and vertical constants reference line annotations for quantitative axes in cartesian chart types, such as area, bar, line, scatter, heatmap, and histogram charts.
Genie usage guidance and query performance
May 22, 2025
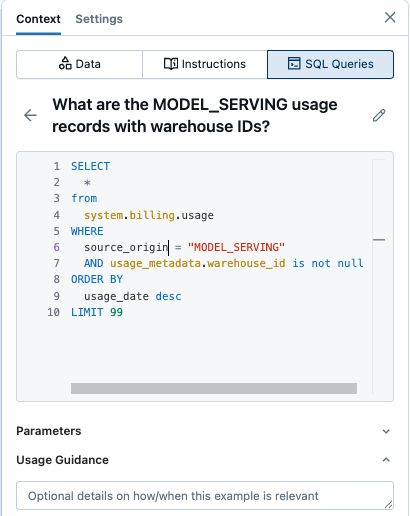
- Usage guidance addition in Genie: You can now add Usage Guidance to clarify how and when SQL examples should be used.
Improved query result display in Genie: Query results now show more quickly. It now displays Running query until the query result is ready and Still thinking if additional work is required.
UI polling update in Genie: The UI now starts polling for result data sooner rather than waiting until after the visualization and sample questions are generated.
Fixed missing Trusted badge in Genie: The Trusted badge now appears on certified answers and parameterized queries.
SQL function de-emphasis in Genie: The option to add SQL functions has been de-emphasized, making adding example SQL the default action.
Improved result delivery timing in Genie: Descriptions are now generated after the SQL is run, thereby reducing the time it takes to get results.
Fixed empty visualizations issue in Genie: Fixed an issue where empty visualizations were occasionally rendering in Genie.
Dashboard query updates and calculation support
May 15, 2025
Genie in dashboards query update: Genie in dashboards will now only query from dashboard datasets, instead of the underlying tables within dashboard datasets.
Custom calculation support in dashboards: Added support for custom calculations using
isnull,isnotnullfunctions, and thenulloperator.AI/BI dashboard schedule support: AI/BI dashboard schedules now support dashboards without embedded credentials.
Dashboard tooltip and number formatting fixes:
- Tooltip fix: Fixed tooltips to display an empty value when the field value is an empty string ("").
- Number formatting support: Number formatting in table and pivot table cells from notebooks, SQL editor, and legacy dashboards can now be carried over to AI/BI dashboards.
Dashboard data selection and point maps
May 8, 2025
Select and add multiple tables and views: Users can now select and add multiple tables and views at once from the Add data dialog.
Draft dashboard scheduling bug fix: Fixed a bug that allowed draft dashboards to be scheduled using the API. Now, only published dashboards can be scheduled.
AI-assisted point maps in dashboards: You can now use natural-language prompts to generate point map charts in dashboards.
Deploy dashboard tasks using Declarative Automation Bundles: You can now use dashboard tasks within a
jobresource when deploying bundles. To learn more about Declarative Automation Bundles, see What are Declarative Automation Bundles?. To learn more about programmatically configuring a dashboard task in a job, see the Jobs API.
Genie entity matching and point map support
May 8, 2025
Increased entity matching support in Genie: Each entity matching (previously value dictionary) column in Genie now supports 1024 values per column, up from 255. Click Refresh on your existing entity matching columns to increase cardinality support. See Build a knowledge store for more reliable Genie spaces.
Point maps support in Genie: Point maps are now supported in Genie.
Dashboard data truncation improvements
May 1, 2025
- View truncated data: You can now view more data in charts with truncated results by clicking Render more data.
Genie follow-up questions and instruction processing
May 1, 2025
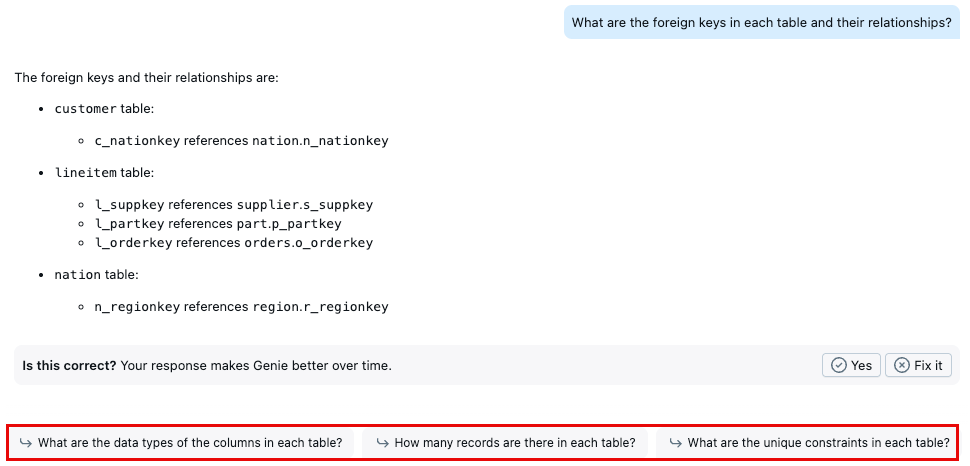
- Follow-up questions for text responses in Genie: Genie now suggests follow-up questions for text responses that include no generated SQL or results. Previously, follow-up questions appeared only after responses with a result set. Now, prompts such as Explain the data set also return suggested follow-up questions to help Genie space users explore the data.
- Improved instruction processing in Genie: Genie's chain-of-thought reasoning has been refined to prioritize and adhere to the most relevant instructions based on the user prompt.
April 2025
Dashboard choropleth maps and AI forecast
April 24, 2025
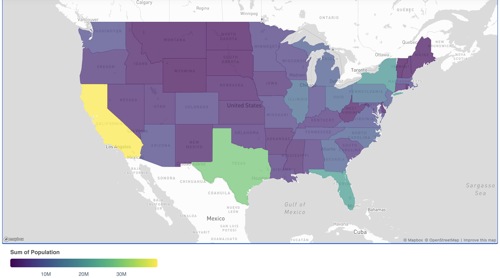
Choropleth maps available: Choropleth maps are now available for dashboards, allowing users to visualize data across geographical regions with varying colors based on values such as population, income, or other metrics. See Choropleth map.
AI Forecast on line charts: You can now generate a forecast for a line chart (Public Preview). See Generate a forecast.
Genie prompt improvements and prompt matching
April 24, 2025
Distilled top-k prompt snippet: Replaced the original top-k prompt snippet with a shorter version (25% of the original token count) to reduce irrelevant context and improve LLM response accuracy.
Clearer permissions warnings: Added a banner that explains when a user tries to access a Genie space containing tables they no longer have access to or that have been removed.
Clearer next steps for permissions issues: When users try to select a table they can't read, the error message now explicitly advises them to request access from the asset owner.
Improved collapsed visualizations: Collapsed visualizations now display the chart title in a full-width header bar with hover feedback and an expand icon. You can click or press Enter or Space to expand or collapse the visualization, improving keyboard accessibility and clarity.
Genie prompt matching can now be enabled from the previews page: Admins can now enable Prompt matching (previously data sampling), which allows Genie authors to add entity matching columns that improve Genie's ability to answer user prompts using correct columns and row values, from Previews. See Build a knowledge store for more reliable Genie spaces.
Dashboard custom dimensions and pivot table improvements
April 17, 2025
Custom dimensions: Authors can create custom dimensions on AI/BI dashboards. A new set of functions, including
CASE WHENstatements,CONCAT,COALESCE, and others, are now supported. See What are custom calculations?.Customizable pivot table widths: Pivot tables now support customizable widths.
Sankey visualization improvements: Sankey visualizations now have reduced flickering on hover and use a lighter gray for flow lines.
Genie example questions and table management
April 17, 2025
Example and follow-up questions: Genie now uses table metadata to automatically offer example and follow-up questions when users start exploring a Genie space. You can still add your own sample questions.
Improved response layout: Genie's response layout has been redesigned to simplify chat interactions.
View and remove missing tables: Users can now view and remove missing tables in a Genie space. The Data tab now shows visual indicators to mark tables that cannot be accessed. You can use the UI to remove those tables.
Improved data access transparency: The table picker in Genie now prevents choosing tables for which you do not have at least
SELECTprivileges. This helps to ensure that Genie spaces only include tables that can return results. To learn about data Unity Catalog data privileges, see Unity Catalog privileges reference.
End of support for legacy dashboards
April 10, 2025
You can no longer create or clone legacy dashboards using the UI or API. Databricks continues to address critical security issues and service outages, but recommends using AI/BI dashboards for all new development. To learn more about AI/BI dashboards, see Dashboards. For help migrating, see Clone a legacy dashboard to an AI/BI dashboard and Use dashboard APIs to create and manage dashboards.
Dashboard source control and export fixes
April 10, 2025
Source control for dashboards: Dashboards can now be integrated with Databricks Git folders for collaboration and version control(Public Preview). See Version control dashboards with Git.
Revert draft dashboards to the last published version: You can now discard changes to a draft dashboard and restore it to the most recently published state. This makes it easier to undo edits and return to a known, shared version. See Draft and collaborate on a dashboard.
Dashboard PDF export and embedded filter fixes:
- PDF export fix: Fixed an issue where PDF export did not apply selected filter values at the time of export.
- Embedded dashboard filter fix: Fixed an issue where filters were not rendering correctly in embedded dashboards.
Genie feedback workflow and security enhancements
April 10, 2025
Revamped feedback flow in Genie: The Genie feedback workflow is now more interactive and responsive. When a response is incorrect, you can explain why it's wrong by choosing from a selection of common issues or entering your own explanation. You can regenerate the response based on the feedback you provide, or send it to a space editor for manual review. See Response feedback.
Customer-managed key support for Genie: Genie spaces created after April 10, 2025 are now encrypted and compatible with customer-managed keys. See Customer-managed keys for encryption.
Dashboard publishing and visualization updates
April 3, 2025
Streamlined publish flow: All publish actions now embed the publishing user's warehouse permission. The only decision is whether to embed the data credential. Embedding credentials removes the previous requirement of all users requiring individual access to the selected warehouse if the dashboard was published without embedded credentials. See What are shared data permissions?.
Continue Genie conversations: When Genie is enabled for a dashboard, opening it now resumes the last conversation until a new one is started.
Stable color assignment: Color assignment is now stable as filter values change.
PNG download support for maps: Downloading PNGs for maps is now supported.
Sankey visualizations: Sankey visualizations are now available on AI/BI dashboards. See Sankey diagram.
Genie API performance and space creation fixes
April 3, 2025
Genie API performance improvement: API response latency has been improved by removing unnecessary completion steps.
Create Genie spaces from Catalog Explorer fix: An issue with creating Genie spaces from Catalog Explorer has been resolved.
March 2025
Dashboard migration and localization improvements
March 27, 2025
Chart migration fix: Dual-axis charts are now converted as expected when migrating from legacy dashboards to AI/BI dashboards.
More space for titles: Narrow widgets and filter drop-downs now allocate more space for titles.
Customize dashboard visualization settings by locale: Use the editing panel on your draft dashboard to select a locale and customize settings across all filter and visualization widgets.
Improved URL stability: Importing a new version of a dashboard in draft and publishing no longer breaks filter values saved in existing URLs. See Filters in published dashboard URLs.
Improved Genie creation flow: When you create a new Genie space, you need only to add tables to the space to start testing and iterating. See Set up and manage a Genie space.
Conversations API update: Messages sent through the Conversations API now appear in the monitoring tab.
Dashboard query history and sorting enhancements
March 20, 2025
Query history update: When viewing the query history, scheduled dashboard update queries now display the dashboard publisher as the user instead of System Service Principal.
Simplified actions menu: The Ask Genie button no longer appears in a widget's
kebab menu when Genie is not enabled on a dashboard.Increased custom sorting limits: You can now custom sort up to 500 items in a visualization.
Resolved issue with subscription emails: Dashboards created using jobs now correctly apply subscription settings set at the workspace level.
Genie UI redesign and permission management
March 20, 2025
New Genie space UI: Genie now has a redesigned UI for authoring and chats. The new layout has more space for conversations and a reorganized interface for adding and refining instructions. See Set up and manage a Genie space.
Privileged users can help refine instructions: Users with at least CAN EDIT permissions can now view the source SQL used to generate answers, allowing them to help refine Genie instructions.
Restricted table selection in Genie: To return results, users must have at least
SELECTprivileges on the Unity Catalog objects in the space. Authors are now restricted from adding tables where they have insufficient permissions.Improved SQL matching in Genie: Genie can now better utilize example SQL statements when user prompts closely match the example SQL.
Dashboard audit logs and workflow integration
March 13, 2025
New audit log emitted for dashboard downloads: Downloading dashboards as PDF now triggers the audit log event
triggerDashboardSnapshot.Dashboards are supported as a task type in workflows: Create a job task with the Dashboard task type to refresh dashboard results and optionally send subscription emails.
Calculated measures from dashboards better supported: Genie spaces created from dashboards are now better able to use any calculated measures defined on the dashboard.
Fixed null value styling: Pivot table cells with null values now display with the correct styling.
Sorting with filters now supported: Single-value and multi-value filters now support sorting.
Genie conversation API and prompt matching
March 13, 2025
Easier to understand audit events in Genie: The
updateConversationMessageFeedbackaudit event now includes afeedback_ratingfield to quickly see whether a rating is positive or negative.Genie Conversations API in Public Preview: The Genie Conversation API is now in Public Preview. Use the API to ask questions, retrieve generated SQL and query results, or get the details associated with a Genie space. For more details, see Set up and manage a Genie space.
Genie prompt matching is now available in Public Preview: Prompt matching (previously data sampling) improves Genie's ability to translate user prompts into the right column and row values. To test this feature, contact your Databricks account team.
Genie now self-reflects: As Genie generates SQL, it self-reflects to fix issues and return higher-quality answers. This improves Genie's ability to author filter conditions and fewer SQL errors.
Improved keyword contextualization in Genie: Genie has improved its ability to provide relevant context in its responses based on keywords in the user question.
Improved benchmark evaluation logic in Genie: Genie now supports column and row reordering and permits extraneous column selection in SQL results.
Dashboard visual indicators and chart improvements
March 6, 2025
New visual indicators for column names: Duplicate column names are now greyed out to indicate lack of support.
Fixed an issue with color mappings: Color mappings in the visualization editor now align with the renderer.
Restricted character set: The name property
customer_ref_idin the serialized dashboard format is now restricted to alphanumeric characters, hyphens, and underscores. Before, there was no restriction in the character set.Dual-axis charts now support zoom: You can now click and drag to zoom in on non-combo dual-axis charts.
Inclusive relative date ranges: The dates you select when choosing relative date periods in the date range picker, such as last week or last month, are now inclusive of the current date. See Date range picker.
Freeze table columns: You can now freeze table columns to the left side of the table display. Columns stay in view as you scroll right on the table. See Dashboard visualizations.
Fixed an issue with combo charts: Resolved misalignment between x-axis labels and bars when using a temporal field on the x-axis.
Genie benchmark evaluation improvements
March 6, 2025
- Improved benchmarks in Genie: The benchmark evaluation function now more accurately detects incorrect results.
February 2025
Dashboard date controls and notification features
February 27, 2025
Relative dates update: The relative dates in date and date range pickers now include the current day.
Error message improvement: Error messages for calculated measures now indicate that filter clauses are not supported.
Publish notification feature: Dashboard authors can now send publish notifications when updating a dashboard. See Publish a dashboard.
Ask Genie about specific charts: You can now ask questions about specific charts in Genie-enabled published dashboards. Genie uses the selected chart's title and dataset query as context for the conversation. See Ask Genie about a specific chart.
Genie file uploads and formatting improvements
February 27, 2025
File uploads in gated Public Preview: A new feature that allows users to upload CSV and Excel files directly to a Genie space. See Upload a file. To enable file uploads, contact your Databricks account team.
X-axis formatting: The x-axis for Combo charts now applies formatting for improved readability.
Consistent security settings: Genie now respects the workspace level setting to enable Results tables clipboard features in admin security settings. See Manage your workspace.
Dashboard thumbnails and table enhancements
February 21, 2025
Quickly navigate to the most popular dashboards: Dashboard thumbnails are now shown for all dashboards published with embedded credentials. The dashboards listing page attempts to show thumbnails for the four most popular dashboards you can access. Dashboards you don't have access to do not appear on the listing page.
Pivot tables support more cells: Pivot tables now accommodate up to 1,000 rows and 1,000 columns, up from the previous limit of 100 rows and 100 columns.
Edit box plot display names: You can now edit the Y-axis display names in box plots, enabling a more customized presentation.
Multiple Y fields for generated charts: Visualizations generated using the Databricks Assistant now support multiple Y fields.
ColorBy performance optimization: Rendering is now optimized for charts with a very large number of groupings. This optimization prevents performance issues and crashes.
Genie parameter editing and data source visibility
February 21, 2025
Edit parameters in a response: You can now edit the parameter values used to generate a response to a trusted question. See Review a response.
View data sources in Genie: Genie now displays the tables used as source data for each response.
Avoid unnecessary wait times in Genie: You can now cancel a SQL query execution during the Waiting for warehouse state to avoid unnecessary wait times.
Improved error messaging in Genie: Removed duplicate error messages from generated visualizations.
Dashboard listing page fixes
February 13, 2025
- Fixed dashboards listing page: An issue that caused some dashboards to be excluded from the listing page has been resolved. The listing page now shows all dashboards that you have permission to access.
Genie SQL reasoning and chart improvements
February 13, 2025
Improved reasoning about generated SQL: Genie's model for translating text into SQL now uses Chain-of-Thought reasoning to break down questions into manageable steps: first, identifying useful columns; next, planning the SQL generation; and finally, combining the parts into a single SQL query. This upgrade results in more robust and accurate SQL translations. You should see improvements in Genie's ability to pick precise filter conditions and improved reasoning on nuanced questions.
Fixed progress indication in Genie: Resolved an issue where Genie was showing a Still thinking status after a result had already been returned.
Genie space sharing notifications: Sharing a Genie space now sends an email notification to the recipient. See Share a Genie space.
Fixed zoom behavior:
- Resolved an issue where zooming in on a chart altered the colors associated with quantitative values.
- Resolved an issue that prevented zooming in on categorical charts with temporal fields.
Improved chart migration: Visualizations created in the SQL editor, legacy dashboards, and notebooks that do not include sorting now migrate as expected.
Dashboard customization and page management
February 6, 2025
Customize sort order and label angles: Control the sorting order of data on the axis and adjust the angle of labels in visualizations. See Format axis settings.
Custom column widths for tables: All column types in table visualizations now support custom widths. Drag the handle at the top of a column to adjust its size.
Clone dashboard pages: You can now duplicate dashboard pages. See Clone a page.
Updated timezone handling: Visualizations now use the timezone from the dataset or compute resource instead of the browser settings. If a widget includes two columns with different time zones, the second is formatted to match the first.
Genie visualization display controls
February 6, 2025
- Hide visualizations in the chat window: Visualizations include a
 collapse icon in the upper-right corner that you can use to hide a chart. Click Show visualization to expand. To learn more about working with visualizations in Genie, see Generate visualizations.
January 2025
Dashboard calculated measures and data display
January 30, 2025
Create calculated measures: Perform calculations and visualize new data fields without modifying the SQL queries that define a dataset. For details, see What are custom calculations?.
Sort dashboards by name: You can now sort dashboards by name on the dashboard listing page.
Expanded data display in charts: Dashboard visualizations now support up to 15,000 rows of data.
Genie visualization generation and warehouse status
January 30, 2025
Genie-generated visualizations: When Genie detects that a visualization would improve response clarity, it includes one with the result.
Improved warehouse status visibility: Genie now displays a Waiting for warehouse message when a request is queued and awaiting processing by the associated SQL warehouse.
Updated warehouse picker UI: The warehouse picker in Genie spaces now automatically selects the first running warehouse from the list. Its updated appearance matches other compute selectors in the Azure Databricks UI.
Fixed results table issue: Genie now reliably includes table results in responses.
Dashboard service principal publishing and cross-filtering
January 23, 2025
Publish using a service principal: You can now use the REST API to publish dashboards with service principal credentials. See Use a service principal to publish and share dashboards.
Reorder datasets: Drag and drop dataset names to change their order in the Data tab.
Cross-filtering support for point maps: Cross-filtering is now available for point map charts. For a list of chart types that support cross-filtering, see Apply cross-filtering.
New scatter chart scaling options: A Log (Symmetric) scale function is now available for scatter charts.
Fixed range sliders: The Range slider filter now correctly limits items to those within the selected range.
Fixed tooltips: Tooltips now display accurate totals for charts with labels.
Genie table quoting and query fixes
January 23, 2025
Fixed table identifier quoting: Genie now properly quotes table name identifiers in queries by adding backticks around each part of the catalog, schema, and table name. For example,
catalog.schema.tableis now formatted as`catalog`.`schema`.`table`to preventTABLE_OR_VIEW_NOT_FOUNDerrors.Fixed ANY keyword error: Genie now replaces the
ANYkeyword with theINkeyword when querying list columns to avoid common SQL errors.Improved query descriptions: Genie now uses an updated model to generate more precise and accurate query descriptions.
Dashboard PDF download and dataset visualization
January 16, 2025
Download as PDF: You can now download a PDF copy of a published dashboard. See Download a published dashboard.
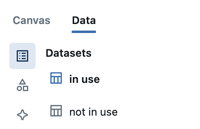
Visually identify datasets in use: A visual indicator now marks whether datasets in the data tab are used in visualizations on the canvas. Datasets that support canvas widgets have a blue icon and a bolded title. Unused datasets have a grey icon and a non-bolded title.
Generate new charts with Databricks Assistant: Databricks Assistant now supports creating dual-axis charts from natural language requests.
COUNT(*)added as a measure: When choosing fields from the visualization editor,COUNT(*)is now in the measure section.Dashboard hover lines and Excel download fixes:
- Fix: Hover lines now appear correctly on horizontal charts.
- Fix: Downloading datasets as Excel files now preserves the correct numeric data types.
Genie warehouse selector improvements
January 16, 2025
- See warehouse details in Genie: The Default Warehouse selector in the space settings has been updated to display status, size, and warehouse type. You can also type to filter and select warehouses.
Dashboard full-screen mode and page name display
January 9, 2025
Dashboard full-screen mode fixes: Filters and context menus now appear in full-screen mode as expected.
Show page names: Dashboard page names can now display 50% more characters before being truncated.
Genie table count and syntax fixes
January 9, 2025
- Genie table count and syntax improvements:
- Improvement: Genie now correctly responds with the number of tables in a space.
- Improvement: Reduced the frequency of
PARSE_SYNTAX_ERRORissues triggered by improper use of backticks.