Note
Access to this page requires authorization. You can try signing in or changing directories.
Access to this page requires authorization. You can try changing directories.
This article provides you with resources you can use in the event you need to troubleshoot compute behavior in your workspace. The topics in this article relate to compute start-up issues.
For other troubleshooting articles, see:
- Debugging with the Spark UI
- Diagnose cost and performance issues using the Spark UI
- Handling large queries in interactive workflows.
Use Genie Code to debug compute environment errors
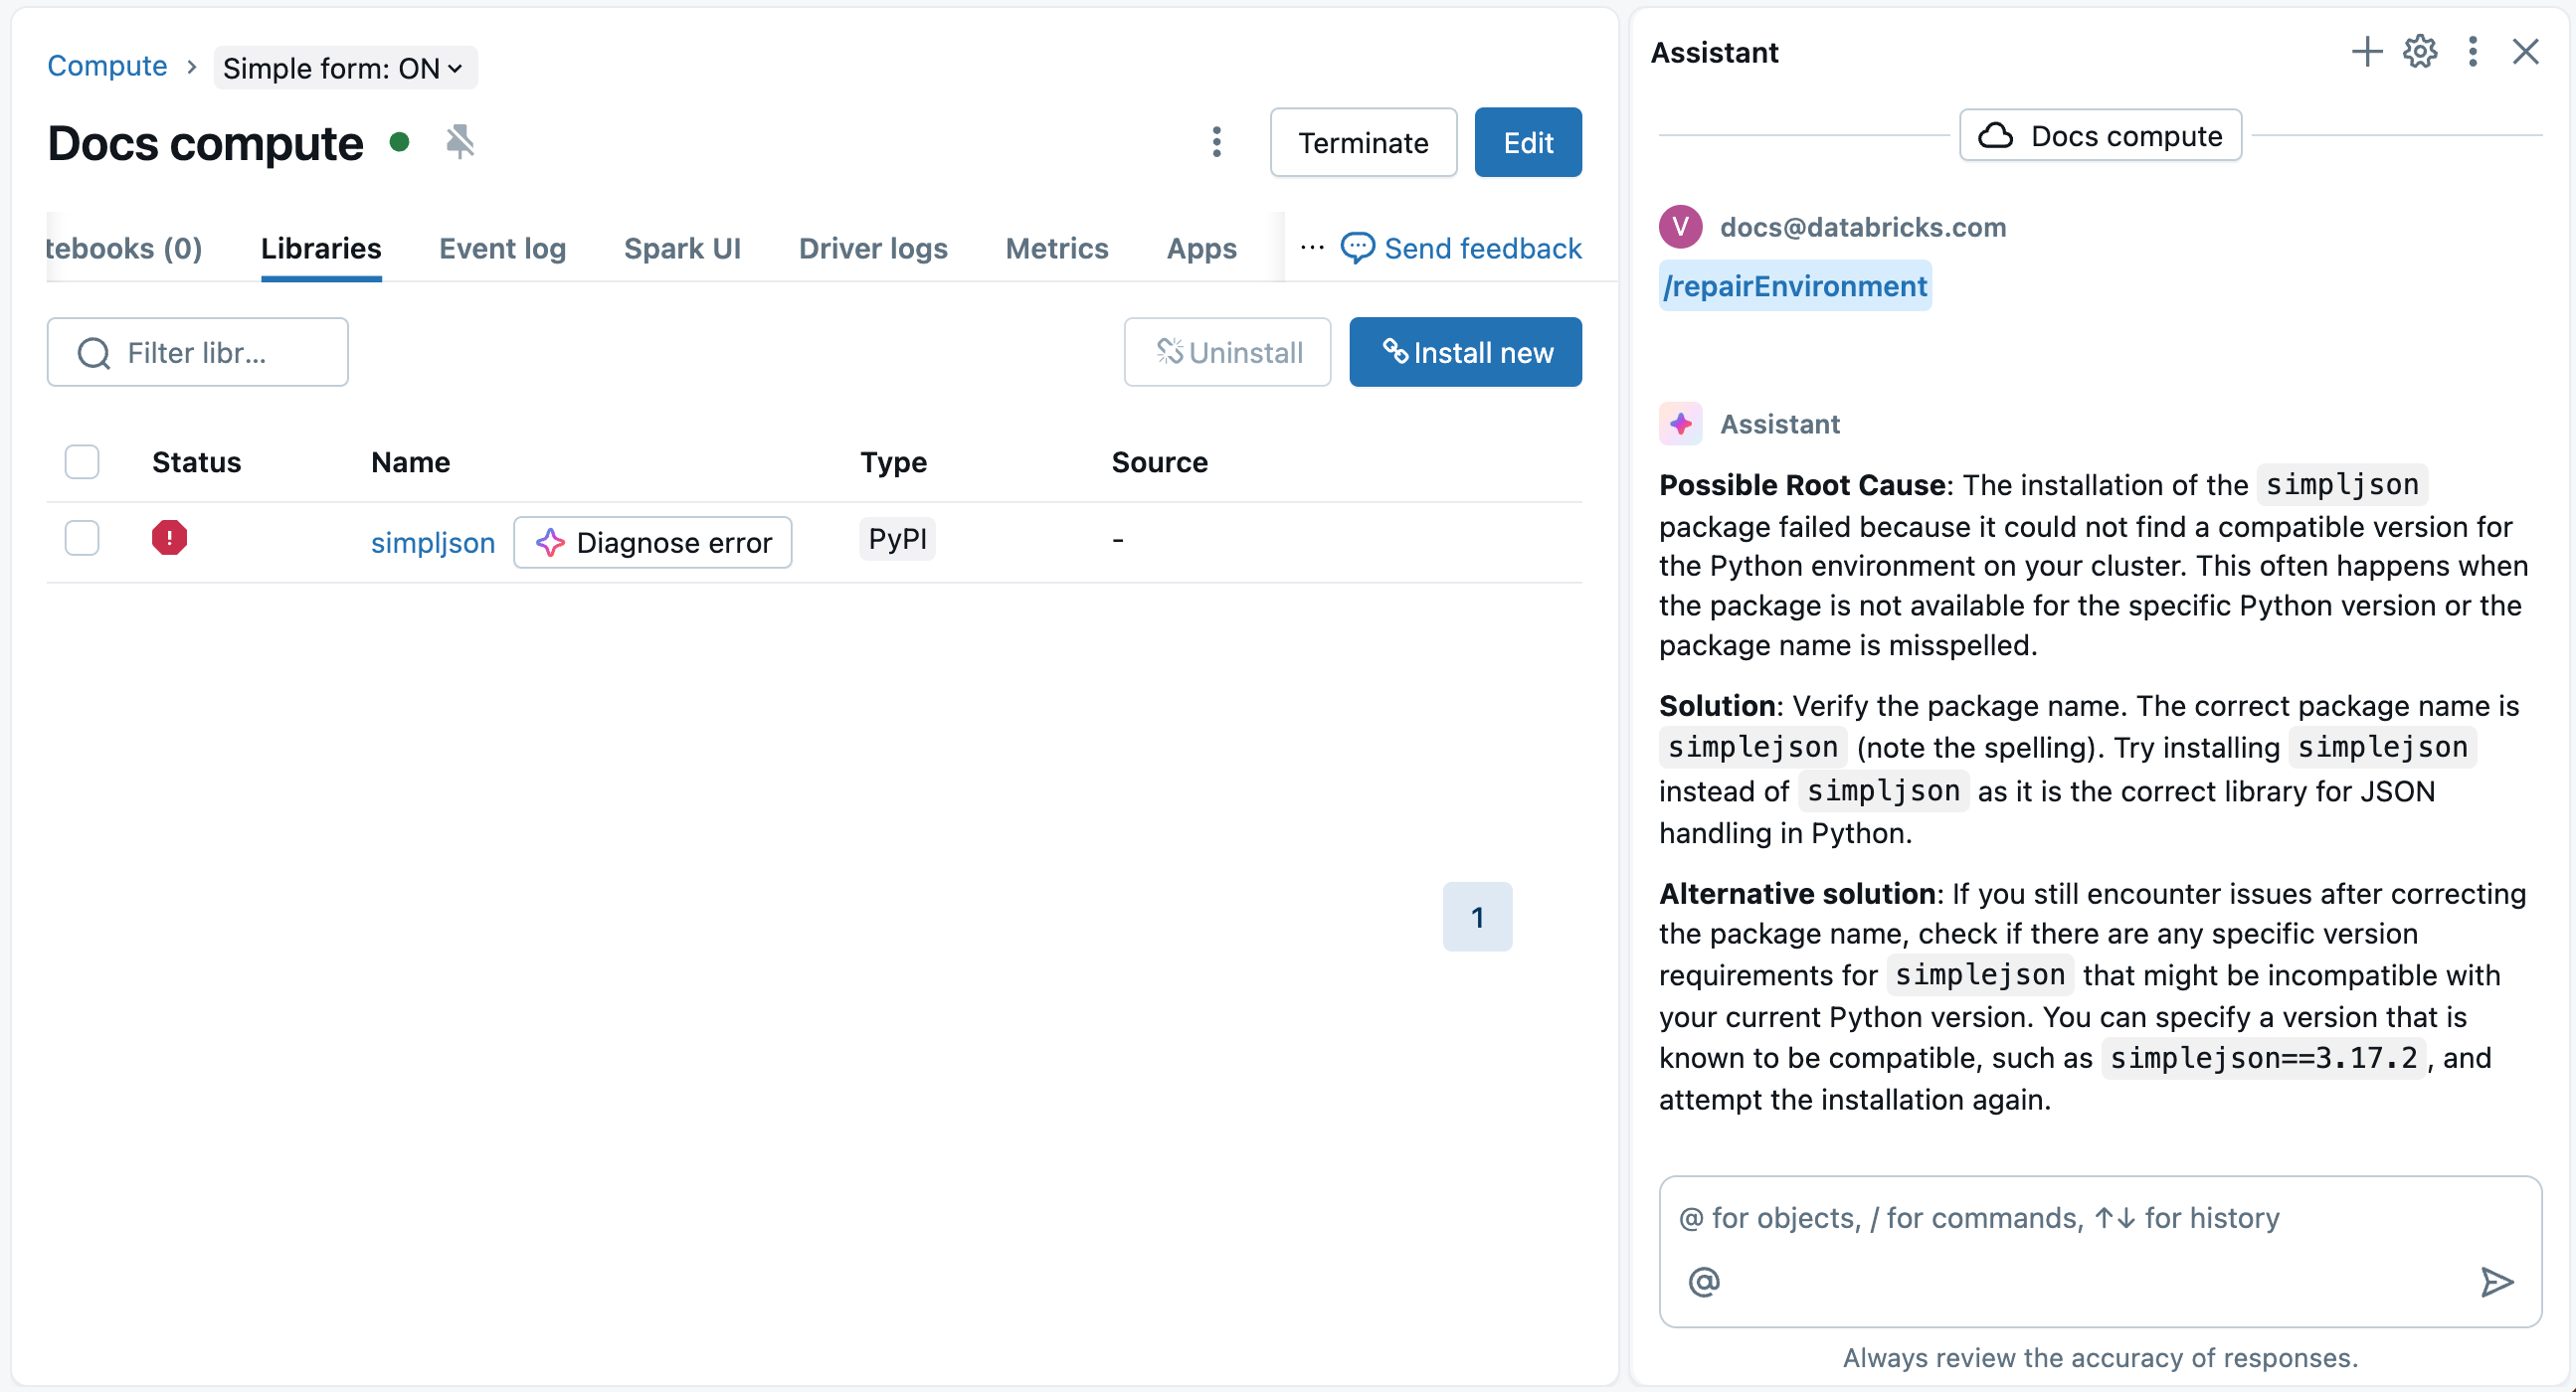
Genie Code can help diagnose and suggest fixes for library installation errors.
On the compute's Libraries page, a ![]() Diagnose error button appears next to the failed package name and on the details modal that pops up when you click on the failed package. Click
Diagnose error button appears next to the failed package name and on the details modal that pops up when you click on the failed package. Click ![]() Diagnose error to use Genie Code to help you debug. Genie Code will diagnose the error and suggest possible solutions.
Diagnose error to use Genie Code to help you debug. Genie Code will diagnose the error and suggest possible solutions.
You can also use Genie Code to debug compute environment errors within a notebook. See Debug environment errors.
A new compute does not respond or “compute plane network is misconfigured” event log error
Issue: After what seems like a successful workspace deployment, your first test compute doesn't respond. After approximately 20-30 minutes, if you check your compute event log, you see an error message like the following:
The compute plane network is misconfigured. Please verify that the network for your compute plane is configured correctly. Error message: Node daemon ping timeout in 600000 ms …
Cause: The previous error message indicates that the routing or the firewall is incorrect. Azure Databricks requested VM instances for a new compute, but encountered a long delay waiting for the VM instance to bootstrap and connect to the control plane. The compute manager terminates the instances and reports this error.
Recommended fix: Your network configuration must allow compute node instances to successfully connect to the Databricks control plane. For a faster troubleshooting technique than using a compute, you can deploy a VM instance into one of the workspace subnets and do typical network troubleshooting steps like nc, ping, telnet, or traceroute.
See IP addresses and domains for Azure Databricks services and assets for access domains, IPs, and relay CNAMEs by region. For the Artifact Storage, ensure that there's a successful networking path to Azure blob storage.
The following example uses the Azure region westus:
# Verify access to the web application
nc -zv 40.118.174.12 443
nc -zv 20.42.129.160 443

# Verify access to the secure compute connectivity relay
nc -zv tunnel.westus.azuredatabricks.net 443

# Verify Artifact Blob storage access
nc -zv dbartifactsprodwestus.blob.core.windows.net 443
nc -zv arprodwestusa1.blob.core.windows.net 443
..
nc -zv arprodwestusa15.blob.core.windows.net 443
nc -zv dbartifactsprodwestus2.blob.core.windows.net 443

# Verify Metastore Database access
nc -zv consolidated-westus-prod-metastore.mysql.database.azure.com 3306
nc -zv consolidated-westus-prod-metastore-addl-1.mysql.database.azure.com 3306
nc -zv consolidated-westus-prod-metastore-addl-2.mysql.database.azure.com 3306
nc -zv consolidated-westus-prod-metastore-addl-3.mysql.database.azure.com 3306
nc -zv consolidated-westus2c2-prod-metastore-addl-1.mysql.database.azure.com 3306

# Verify Log Blob storage access
nc -zv dblogprodwestus.blob.core.windows.net 443
If the previous commands return correctly, the networking path might be configured correctly but there might be another issue if you are using a firewall. The firewall might have deep packet inspection, SSL inspection, or something else that causes Azure Databricks commands to fail. Using a VM instance in the Azure Databricks subnet, run the following command, replacing <token> with your personal access token and <workspace-url> with the URL for your workspace:
curl -X GET -H 'Authorization: Bearer <token>' [https://](https://):re[workspace-url]/api/2.0/clusters/spark-versions
If the previous request fails, run the command again with the -k option to remove SSL verification. If this works, then the firewall is causing an issue with SSL certificates.
Look at the SSL certificates by running the following command, replacing <workspace-url> with the URL for your workspace:
openssl s_client -showcerts -connect <workspace-url>:443
The previous command shows the return code and the Azure Databricks certificates. If it returns an error, your firewall might be misconfigured.
Note that SSL issues are not networking layer issues. Viewing traffic at the firewall doesn't show these SSL issues. Looking at source and destination requests works as expected.
Problems using your metastore or compute event log includes METASTORE_DOWN events
Issue: Your workspace seems to be set up and you can set up compute, but you have METASTORE_DOWN events in your compute event log, or your metastore doesn't seem to work.
Recommended fix: Confirm whether you use a Web Application Firewall (WAF) like Squid proxy. Compute members must connect to several services that don't work over a WAF.