Note
Access to this page requires authorization. You can try signing in or changing directories.
Access to this page requires authorization. You can try changing directories.
Important
This feature is in Public Preview.
Custom visualizations let you customize charts in AI/BI dashboards beyond the built-in visualization types. Custom visualizations use the Vega-Lite library to render charts from a JSON specification.
Create a custom visualization
- Select a dataset.
- In the visualization configuration pane, select Custom Viz under the Advanced visualization section.
- In the Fields section, add the fields you want to use. Each field has a unique Name. Reference fields in your Vega-Lite specification using these names.
- Enter your Vega-Lite JSON specification in the Vega-Lite specification editor.
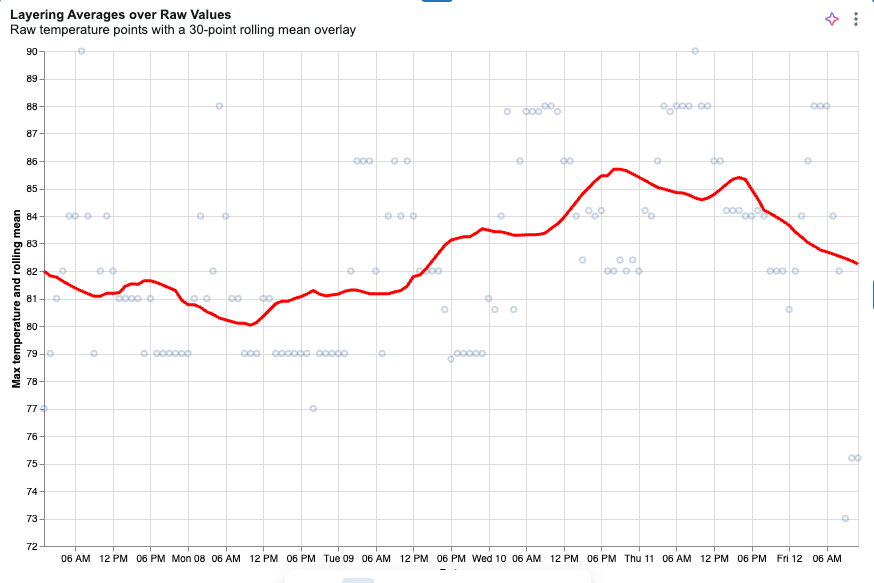
Step-by-step example
This example recreates the Layering Averages over Raw Values chart from the Vega-Lite example gallery.
Create a dataset with the following query:
SELECT date, temperature AS temp_max
FROM samples.accuweather.historical_hourly_imperial
WHERE city_name = 'singapore'
ORDER BY date
In the visualization configuration pane, under Advanced, select Custom Viz.
Select the dataset you created in the previous step.
In the Fields section, add a field for the date column and set its Name to
date.Add a field for the temperature column and set its Name to
temp_max.Copy the following specification into the Vega-Lite specification editor.
If the x-axis is clipped, make the chart resize to its container. See Make a chart resize automatically.
The following specification shows the completed example:
JSON specification
{
  "$schema": "https://vega.github.io/schema/vega-lite/v5.json",
  "width": "container",
  "height": "container",
  "config": {
    "autosize": { "type": "fit", "contains": "padding" }
  },
  "data": { "name": "databricks_query" },
  "transform": [
    {
      "window": [{ "field": "temp_max", "op": "mean", "as": "rolling_mean" }],
      "frame": [-15, 15]
    }
  ],
  "encoding": {
    "x": { "field": "date", "type": "temporal", "title": "Date" },
    "y": { "type": "quantitative", "scale": { "zero": false }, "axis": { "title": "Max temperature and rolling mean" } }
  },
  "layer": [
    {
      "mark": { "type": "point", "opacity": 0.3 },
      "encoding": { "y": { "field": "temp_max", "title": "Max temperature" } }
    },
    {
      "mark": { "type": "line", "color": "red", "size": 3 },
      "encoding": { "y": { "field": "rolling_mean", "title": "Rolling mean of max temperature" } }
    }
  ]
}
Reference dataset columns
There are two ways to reference columns in a Vega-Lite specification:
Use
"field": "{columnName}". The following example assigns thexFieldcolumn to the x-axis:"encoding": { "x": { "field": "xField", "type": "quantitative" } }In expressions, use
datum["{columnName}"]ordatum.{columnName}. The following example defines a newxcolumn from therandanglecolumns:{ "calculate": "datum.r * cos(datum.angle)", "as": "x" }
For more information, see datum in the Vega expressions documentation.
Resize a chart automatically
To make a chart resize to fit its container, add the following settings at the top level of your specification:
"width": "container",
"height": "container",
"config": {
  "autosize": {
    "type": "fit",
    "contains": "padding"
  }
}
Example chart specifications
The following specifications show charts that aren't available as built-in visualization types. For more examples, see the Vega-Lite example galleries.
Bullet chart
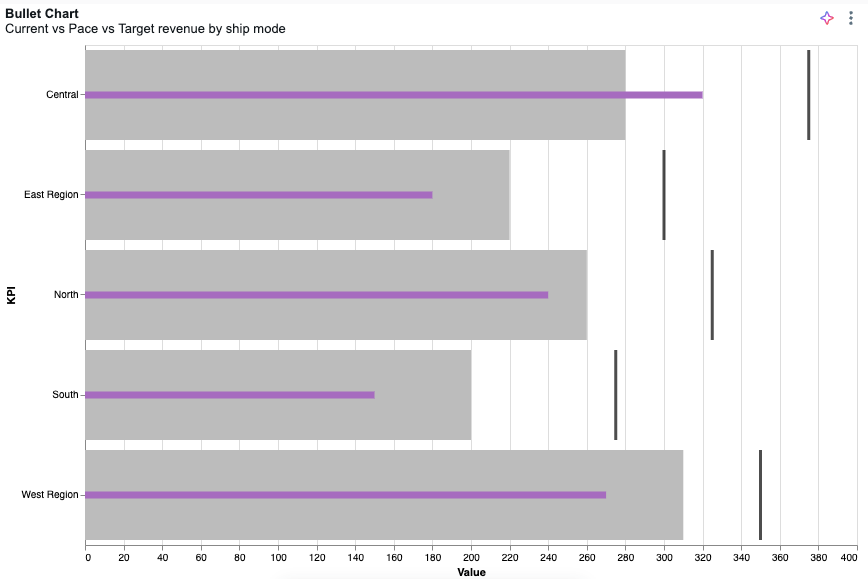
Define categoryField, currentField, paceField, and targetField in the Fields section.
JSON specification
{
  "$schema": "https://vega.github.io/schema/vega-lite/v5.json",
  "width": "container",
  "height": "container",
  "data": { "name": "databricks_query" },
  "config": {
    "autosize": { "type": "fit", "contains": "padding" }
  },
  "transform": [
    {
      "fold": ["targetField", "paceField", "currentField"],
      "as": ["measure_name", "measure_value"]
    },
    {
      "calculate": "toNumber(datum.measure_value)",
      "as": "measure_value"
    },
    {
      "calculate": "{ \"targetField\": \"Target\", \"paceField\": \"Pace\", \"currentField\": \"Current\" }[datum.measure_name]",
      "as": "measure_label"
    },
    {
      "calculate": "indexof([\"Target\", \"Pace\", \"Current\"], datum.measure_label)",
      "as": "measure_order"
    }
  ],
  "layer": [
    {
      "mark": "bar",
      "params": [
        {
          "name": "legend_click",
          "select": { "type": "point", "fields": ["measure_label"] },
          "bind": "legend"
        }
      ],
      "encoding": {
        "color": { "field": "measure_label" },
        "opacity": { "value": 0 }
      }
    },
    {
      "transform": [{ "filter": { "param": "legend_click" } }],
      "layer": [
        {
          "layer": [
            {
              "mark": { "type": "bar", "tooltip": true },
              "encoding": { "color": { "field": "measure_label", "legend": null } },
              "transform": [{ "filter": { "field": "measure_label", "oneOf": ["Pace"] } }]
            },
            {
              "mark": { "type": "bar", "height": 7, "tooltip": true },
              "encoding": { "color": { "field": "measure_label", "legend": null } },
              "transform": [{ "filter": { "field": "measure_label", "oneOf": ["Current"] } }]
            },
            {
              "mark": { "type": "tick", "tooltip": true, "thickness": 3 },
              "encoding": { "color": { "field": "measure_label", "legend": null } },
              "transform": [{ "filter": { "field": "measure_label", "oneOf": ["Target"] } }]
            }
          ],
          "encoding": {
            "x": {
              "field": "measure_value",
              "type": "quantitative",
              "stack": null,
              "title": "Value",
              "axis": { "orient": "bottom" }
            },
            "color": {
              "scale": {
                "domain": ["Target", "Pace", "Current"],
                "range": ["#000000", "#bcbcbc", "#A66BBF"]
              }
            },
            "order": {
              "field": "measure_order",
              "type": "quantitative",
              "sort": "descending"
            }
          }
        }
      ],
      "encoding": {
        "y": {
          "field": "categoryField",
          "type": "ordinal",
          "title": "Category",
          "axis": { "labelOverlap": true }
        },
        "tooltip": [
          { "field": "categoryField", "type": "nominal", "title": "Category" },
          { "field": "currentField", "type": "quantitative", "title": "Current" },
          { "field": "paceField", "type": "quantitative", "title": "Pace" },
          { "field": "targetField", "type": "quantitative", "title": "Target" }
        ]
      }
    }
  ]
}
Gauge
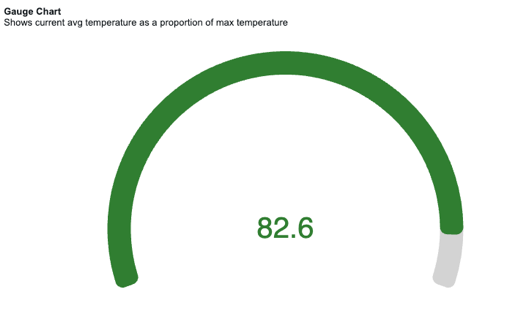
Define $valueField and $totalField in the Fields section.
JSON specification
{
  "$schema": "https://vega.github.io/schema/vega-lite/v6.json",
  "width": "container",
  "height": "container",
  "data": { "name": "databricks_query" },
  "config": {
    "concat": { "spacing": 0 },
    "autosize": { "type": "fit", "contains": "padding" }
  },
  "params": [
    { "name": "ring_max", "expr": "min(width, height) / 2 - 16" },
    { "name": "ring_width", "expr": "max(12, (min(width, height) / 2) * 0.12)" },
    { "name": "ring_gap", "expr": "max(4, (min(width, height) / 2) * 0.03)" },
    { "name": "label_color", "value": "#000000" },
    { "name": "ring_background_opacity", "value": 0.3 },
    { "name": "ring0_percent", "value": 100 },
    { "name": "ring0_outer", "expr": "ring_max + 2" },
    { "name": "ring0_inner", "expr": "ring_max + 1" },
    { "name": "ring1_outer", "expr": "ring0_inner - ring_gap" },
    { "name": "ring1_inner", "expr": "ring1_outer - ring_width" },
    { "name": "ring1_middle", "expr": "(ring1_outer + ring1_inner) / 2" },
    { "name": "arc_size", "expr": "220" }
  ],
  "transform": [
    { "as": "ratio", "calculate": "datum['$valueField'] / datum['$totalField']" },
    { "as": "_arc_start_degrees", "calculate": "360 - ( arc_size / 2 )" },
    { "as": "_arc_end_degrees", "calculate": "0 + ( arc_size / 2 )" },
    { "as": "_arc_start_radians", "calculate": "2 * 3.14 * ( datum['_arc_start_degrees'] - 360 ) / 360" },
    { "as": "_arc_end_radians", "calculate": "2 * 3.14 * datum['_arc_end_degrees'] / 360" },
    { "as": "_arc_total_radians", "calculate": "datum['_arc_end_radians'] - datum['_arc_start_radians']" },
    { "as": "_ring_start_radians", "calculate": "datum['_arc_start_radians']" },
    {
      "as": "_ring_end_radians",
      "calculate": "datum['_arc_start_radians'] + ( datum['_arc_total_radians'] * datum['ratio'] )"
    }
  ],
  "layer": [
    {
      "mark": {
        "type": "arc",
        "color": "lightgrey",
        "theta": { "expr": "datum['_arc_start_radians']" },
        "radius": { "expr": "ring1_outer" },
        "theta2": { "expr": "datum['_arc_end_radians']" },
        "radius2": { "expr": "ring1_inner" },
        "cornerRadius": 10
      }
    },
    {
      "name": "RING",
      "mark": {
        "type": "arc",
        "theta": { "expr": "datum['_ring_start_radians']" },
        "radius": { "expr": "ring1_outer" },
        "theta2": { "expr": "datum['_ring_end_radians']" },
        "radius2": { "expr": "ring1_inner" },
        "cornerRadius": 10
      },
      "encoding": {
        "color": {
          "value": "#307E31",
          "condition": [
            { "test": "datum['ratio'] < 0.33", "value": "#880808" },
            { "test": "datum['ratio'] < 0.66", "value": "#E49B0F" }
          ]
        }
      }
    },
    {
      "mark": { "type": "text", "fontSize": 40 },
      "encoding": {
        "text": { "field": "$valueField" },
        "color": {
          "value": "#307E31",
          "condition": [
            { "test": "datum['ratio'] < 0.33", "value": "#880808" },
            { "test": "datum['ratio'] < 0.66", "value": "#E49B0F" }
          ]
        }
      }
    }
  ]
}
Radar chart
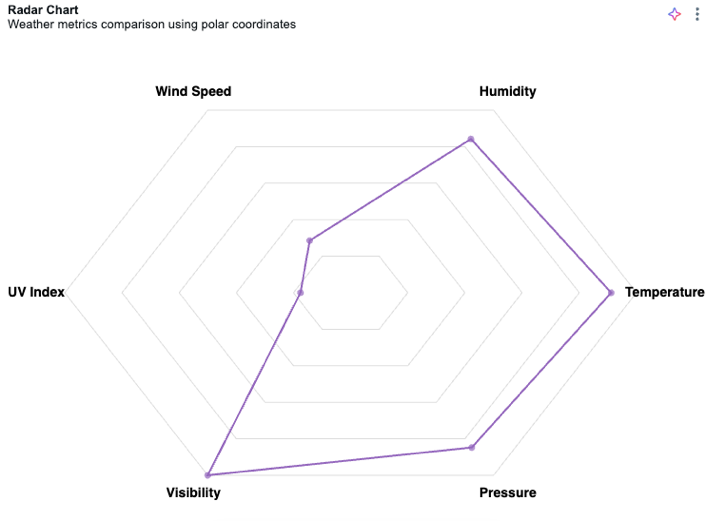
Define $key and $value in the Fields section.
JSON specification
{
  "$schema": "https://vega.github.io/schema/vega-lite/v5.json",
  "width": "container",
  "height": "container",
  "config": {
    "autosize": { "type": "fit", "contains": "padding" }
  },
  "data": { "name": "databricks_query" },
  "transform": [
    { "window": [{ "op": "row_number", "as": "category" }] },
    { "calculate": "datum.category - 1", "as": "category" },
    {
      "joinaggregate": [
        { "op": "count", "as": "numCategories" },
        { "op": "max", "field": "$value", "as": "maxValue" }
      ]
    },
    { "calculate": "2 * PI * datum.category / datum.numCategories", "as": "angle" },
    { "calculate": "100 * datum['$value'] / datum.maxValue", "as": "r" },
    { "calculate": "datum.r * cos(datum.angle)", "as": "x" },
    { "calculate": "datum.r * sin(datum.angle)", "as": "y" },
    { "calculate": "110 * cos(datum.angle)", "as": "label_x" },
    { "calculate": "110 * sin(datum.angle)", "as": "label_y" }
  ],
  "layer": [
    {
      "transform": [
        { "joinaggregate": [{ "op": "count", "as": "numCategories" }] },
        { "aggregate": [{ "op": "max", "field": "numCategories", "as": "numCategories" }] },
        { "calculate": "[0,1,2,3,4,5,6,7,8,9,10,11,12,13,14,15,16,17,18,19,20]", "as": "cats" },
        { "flatten": ["cats"], "as": ["cat"] },
        { "filter": "datum.cat <= datum.numCategories" },
        { "calculate": "2 * PI * datum.cat / datum.numCategories", "as": "angle" },
        { "calculate": "100 * cos(datum.angle)", "as": "x" },
        { "calculate": "100 * sin(datum.angle)", "as": "y" }
      ],
      "mark": { "type": "line", "color": "#ddd", "strokeWidth": 1 },
      "encoding": {
        "x": { "field": "x", "type": "quantitative", "scale": { "domain": [-120, 120] }, "axis": null },
        "y": { "field": "y", "type": "quantitative", "scale": { "domain": [-120, 120] }, "axis": null },
        "order": { "field": "cat" }
      }
    },
    {
      "transform": [
        { "joinaggregate": [{ "op": "count", "as": "numCategories" }] },
        { "aggregate": [{ "op": "max", "field": "numCategories", "as": "numCategories" }] },
        { "calculate": "[20,40,60,80,100]", "as": "levels" },
        { "flatten": ["levels"], "as": ["level"] },
        { "calculate": "[0,1,2,3,4,5,6,7,8,9,10,11,12,13,14,15,16,17,18,19,20]", "as": "cats" },
        { "flatten": ["cats"], "as": ["cat"] },
        { "filter": "datum.cat <= datum.numCategories" },
        { "calculate": "2 * PI * datum.cat / datum.numCategories", "as": "angle" },
        { "calculate": "datum.level", "as": "r" },
        { "calculate": "datum.r * cos(datum.angle)", "as": "x" },
        { "calculate": "datum.r * sin(datum.angle)", "as": "y" }
      ],
      "mark": { "type": "line", "color": "#ddd", "strokeWidth": 1 },
      "encoding": {
        "x": { "field": "x", "type": "quantitative" },
        "y": { "field": "y", "type": "quantitative" },
        "detail": { "field": "level" },
        "order": { "field": "cat" }
      }
    },
    {
      "mark": { "type": "line", "color": "#9467bd", "strokeWidth": 2, "interpolate": "linear-closed" },
      "encoding": {
        "x": { "field": "x", "type": "quantitative" },
        "y": { "field": "y", "type": "quantitative" },
        "order": { "field": "category" }
      }
    },
    {
      "mark": { "type": "point", "filled": true, "size": 50, "color": "#9467bd" },
      "encoding": {
        "x": { "field": "x", "type": "quantitative" },
        "y": { "field": "y", "type": "quantitative" }
      }
    },
    {
      "mark": { "type": "text", "fontSize": 14, "fontWeight": "bold" },
      "encoding": {
        "x": { "field": "label_x", "type": "quantitative" },
        "y": { "field": "label_y", "type": "quantitative" },
        "text": { "field": "$key", "type": "nominal" }
      }
    }
  ],
  "view": { "stroke": null }
}
Radial chart
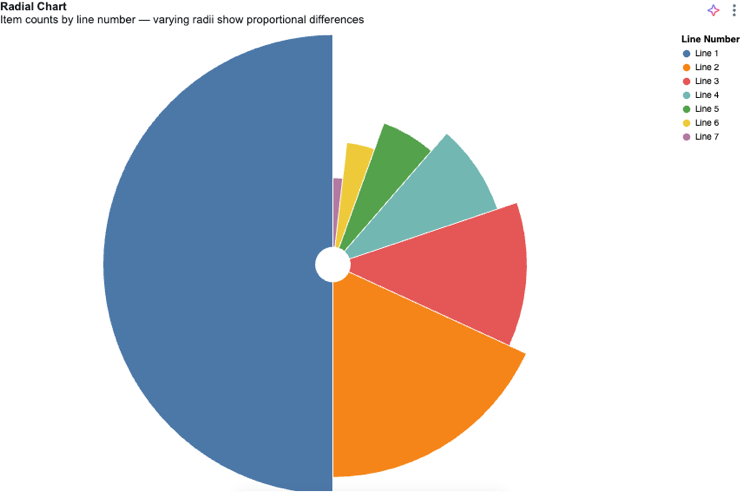
Define $valueField and $colorField in the Fields section.
JSON specification
{
  "$schema": "https://vega.github.io/schema/vega-lite/v6.json",
  "width": "container",
  "height": "container",
  "config": {
    "autosize": { "type": "fit", "contains": "padding" }
  },
  "data": { "name": "databricks_query" },
  "transform": [
    {
      "aggregate": [{ "op": "sum", "field": "$valueField", "as": "total" }],
      "groupby": ["$colorField"]
    },
    {
      "window": [{ "op": "rank", "as": "rank" }],
      "sort": [{ "field": "total", "order": "descending" }]
    }
  ],
  "layer": [
    {
      "mark": { "type": "arc", "innerRadius": 20, "stroke": "#fff" }
    }
  ],
  "encoding": {
    "theta": {
      "field": "total",
      "type": "quantitative",
      "scale": { "type": "sqrt" },
      "stack": true,
      "sort": "descending"
    },
    "radius": { "field": "total", "scale": { "type": "sqrt", "zero": true } },
    "color": {
      "field": "$colorField",
      "type": "nominal",
      "title": "Sub-Category",
      "sort": { "field": "total", "order": "descending" },
      "legend": { "orient": "right" }
    },
    "tooltip": [
      { "field": "$colorField", "type": "nominal", "title": "Sub-Category" },
      { "field": "total", "type": "quantitative", "title": "Sales" }
    ]
  },
  "view": { "stroke": null }
}
Sunburst chart
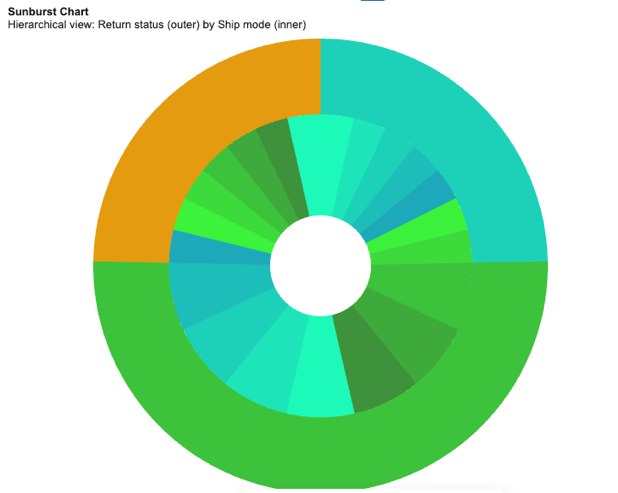
Define outerGroupField, innerGroupField, and sizeField in the Fields section.
JSON specification
{
  "$schema": "https://vega.github.io/schema/vega-lite/v5.json",
  "width": "container",
  "height": "container",
  "data": { "name": "databricks_query" },
  "config": {
    "autosize": { "type": "fit", "contains": "padding" }
  },
  "transform": [
    { "calculate": "datum['outerGroupField']", "as": "OUTSIDE" },
    { "calculate": "datum['innerGroupField']", "as": "INSIDE" },
    { "calculate": "datum.OUTSIDE + '-' + datum.INSIDE", "as": "OUT_IN" },
    { "calculate": "toNumber(datum['sizeField'])", "as": "SIZE" }
  ],
  "resolve": {
    "scale": { "color": "independent" },
    "legend": { "color": "independent" }
  },
  "layer": [
    {
      "mark": {
        "type": "arc",
        "tooltip": true,
        "innerRadius": { "expr": "min(width, height)/9" },
        "outerRadius": { "expr": "min(width, height)/3" }
      },
      "encoding": {
        "theta": { "field": "SIZE", "type": "quantitative", "stack": true },
        "color": {
          "field": "OUT_IN",
          "type": "ordinal",
          "sort": "ascending",
          "title": "Inner Grouping",
          "scale": {
            "range": [
              "#1DF9B9",
              "#1DE5B9",
              "#1DD1B9",
              "#1DBDB9",
              "#1DA9B9",
              "#3DF23B",
              "#3DDA3B",
              "#3DC23B",
              "#3DAA3B",
              "#3D923B"
            ]
          }
        },
        "order": { "field": "OUT_IN", "sort": "ascending" },
        "tooltip": [
          { "field": "OUTSIDE", "type": "nominal", "title": "Outer Grouping" },
          { "field": "INSIDE", "type": "nominal", "title": "Inner Grouping" },
          { "field": "SIZE", "type": "quantitative", "title": "Count" }
        ]
      }
    },
    {
      "transform": [
        {
          "aggregate": [{ "op": "sum", "field": "SIZE", "as": "total_users" }],
          "groupby": ["OUTSIDE"]
        }
      ],
      "mark": {
        "type": "arc",
        "tooltip": true,
        "innerRadius": { "expr": "min(width, height)/3" }
      },
      "encoding": {
        "theta": {
          "field": "total_users",
          "type": "quantitative",
          "stack": true,
          "sort": "ascending",
          "title": "Users Count"
        },
        "color": {
          "field": "OUTSIDE",
          "type": "ordinal",
          "sort": "ascending",
          "title": "Outer Grouping",
          "scale": { "range": ["#1DD1B9", "#3DC23B"] }
        },
        "order": { "field": "OUTSIDE", "sort": "ascending" },
        "tooltip": [
          { "field": "OUTSIDE", "type": "nominal", "title": "Outer Grouping" },
          { "field": "total_users", "type": "quantitative", "title": "Count" }
        ]
      }
    }
  ]
}
Limitations
- Treemap charts aren't supported. Vega-Lite doesn't support treemaps.