Note
Access to this page requires authorization. You can try signing in or changing directories.
Access to this page requires authorization. You can try changing directories.
Lakebase gives you four ways to understand what a Postgres database is doing:
- Lakebase telemetry in system tables (Beta): query plans, session history, wait events, schema changes, and logs, captured automatically into the
system.lakebaseschema. - Insights (Beta): a background agent that reviews that telemetry on a schedule and surfaces diagnosed issues.
- Genie: conversational help investigating a problem, reading the telemetry, and adjusting a project's configuration.
- Metrics and activity: built-in views of compute and Postgres metrics, running queries, recent query performance, and platform operations.
Metrics and activity views are available on every project. The two Beta features are turned on from the Previews page.
Lakebase telemetry in system tables
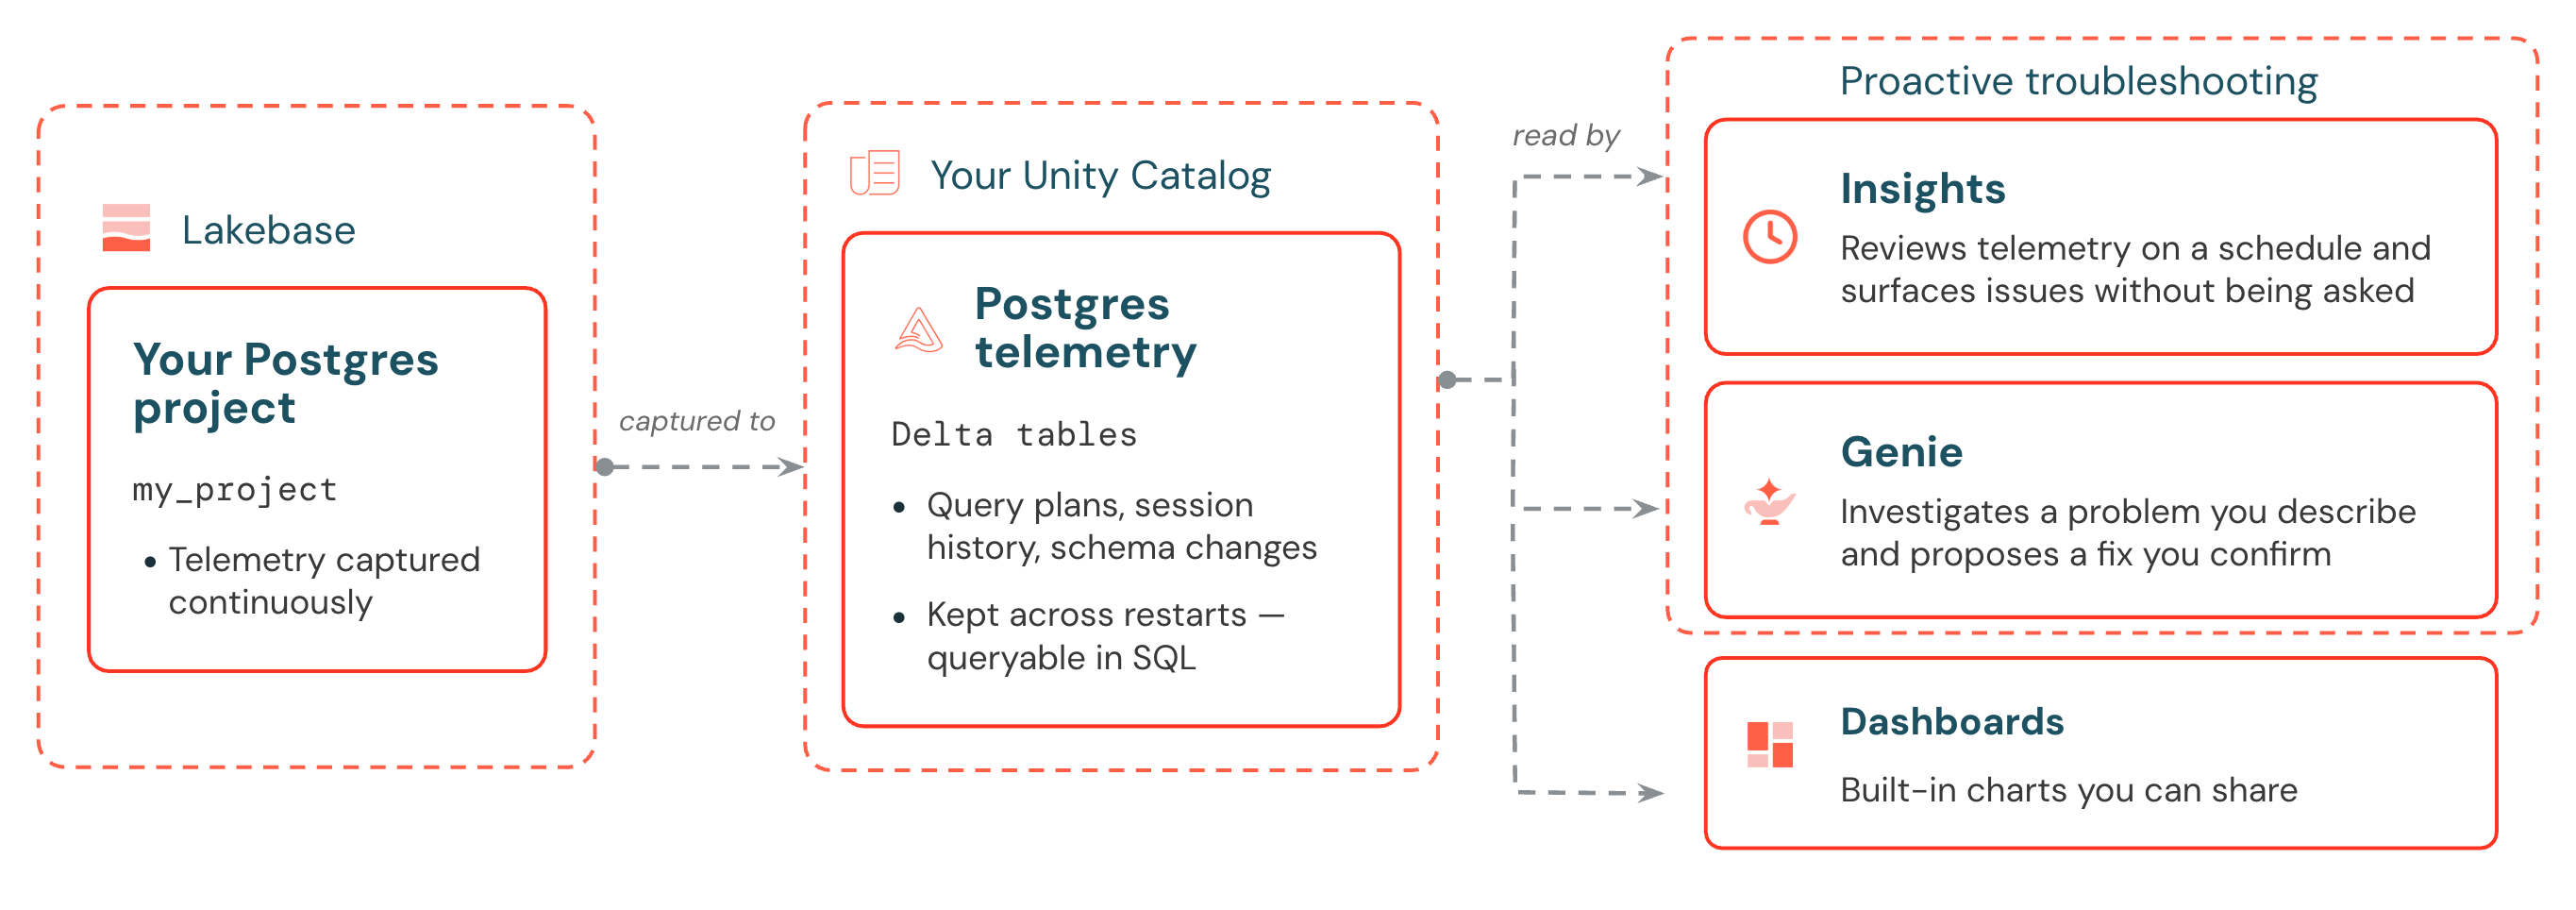
Lakebase continuously writes Postgres telemetry to the system.lakebase schema, giving you a queryable history of how your database behaves. These tables hold query plans, session history, wait events, schema-change history, database and compute health, and Postgres logs, and records are retained for 7 days.
Account admins and metastore admins can read these tables and manage access to them. Any user who's been granted access can query this telemetry the way they would any Unity Catalog table: from a notebook, a dashboard, or Genie. See Lakebase telemetry in system tables for the tables and their columns, and Lakebase system table reference for where they sit among the other system tables.
Insights
Insights reviews the captured telemetry and surfaces issues without being asked, each with a severity, the evidence behind it, and a recommended fix. It runs per project on a managed system identity, on a schedule you set in the project's settings or once on demand. Fixing what it finds usually continues in Genie.
Genie
Genie investigates a problem and proposes a fix you confirm. Use it on something you noticed yourself, or to resolve an issue Insights detected. It reads the captured telemetry for users who can access it, and it also helps you adjust a project's configuration.
Metrics and activity
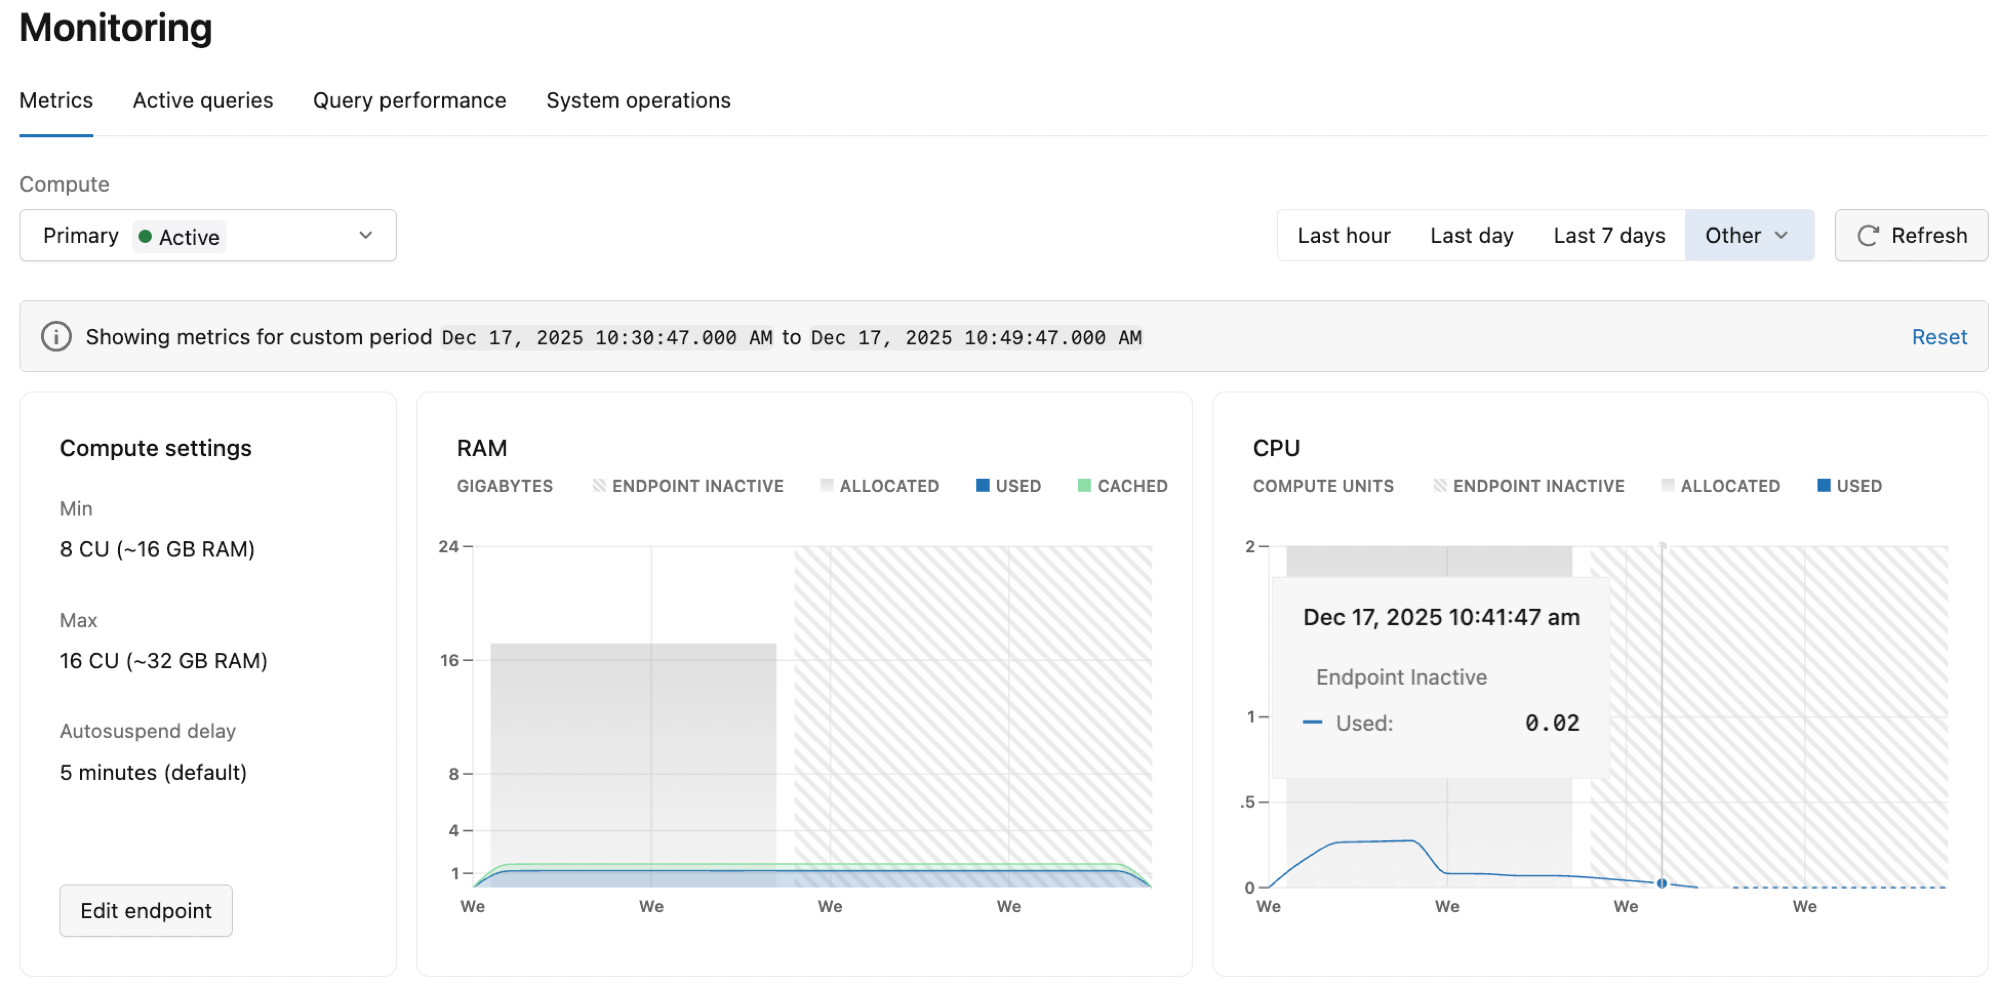
Open a project's Monitoring page in the Lakebase App to see what your database is doing, scoped to the branch and compute you select. These views read your compute's metrics and Postgres's own statistics directly. Metrics graphs go back up to seven days, while the query views reset when a compute suspends.
| Tool | Description |
|---|---|
| Metrics | Graphs of a compute's RAM, CPU, connections, database size, cache, and more, over a selected time period. |
| Active queries | The queries running right now, from pg_stat_activity. Sort by duration to find long-running operations. |
| Query performance | The top 100 recent queries by calls and execution time, from pg_stat_statements, grouped by normalized statement. |
| System operations | A log of platform actions on the project: starting and suspending compute, creating branches, applying config. |